
Understanding stock chart patterns is critical for any trader, whether you’re just starting out or have been in the game for a while. These patterns are the foundation of technical analysis and can signal both the continuation of a trend and potential trend reversals. Recognizing these patterns helps in identifying entry and exit points, thereby aiding in risk management and maximizing profits. Each of these formations tells a story about market sentiment and potential price movements. As a trader, becoming familiar with these patterns is not just beneficial; it’s a necessity for making informed decisions.
Smart trading starts with technical analysis — that means you must know how to read stock chart patterns. Patterns that form on stock charts signal what stocks can do next. It’s how traders set trade plans, know when to take action, and manage risk.
Read this article because it delves into the crucial role of stock chart patterns in trading, offering valuable insights for both new and seasoned traders to enhance their market strategies.
I’ll answer the following questions:
- What is a stock chart pattern?
- Why are stock chart patterns important for traders?
- How do stock chart patterns work for day trading?
- What are the three types of chart patterns: breakout, continuation, and reversal?
- What are the best chart patterns for day trading?
- Why should traders use stock patterns?
- What are classic chart patterns every trader must know?
- How do bar charts compare to candlestick charts in day trading?
Let’s get to the content!
Table of Contents
- 1 What Is a Stock Chart Pattern?
- 2 Why Stock Chart Patterns Are Important
- 3 How Stock Chart Patterns Work
- 4 Best Chart Patterns for Day Trading
- 5 Why Should Traders Use Stock Patterns?
- 6 Classic Chart Patterns Every Trader Must Know
- 7 How to Learn Stock Patterns
- 8 Use StocksToTrade to Help You Trade Chart Patterns
- 9 Conclusion
- 10 Frequently Asked Questions About Stock Chart Patterns
- 10.1 Do Chart Patterns Work?
- 10.2 How Many Stock Chart Patterns Are There?
- 10.3 How Do You Predict if a Stock Will Go Up or Down?
- 10.4 What Patterns Do Day Traders Look For?
- 10.5 How Can Understanding Support Levels and Price Patterns Benefit Day Trading?
- 10.6 What Is the Role of Client Services in Enhancing Trading Strategies?
What Is a Stock Chart Pattern?
Stocks do one of three things — trend upward, trend downward, or consolidate. Whatever the stock’s doing, patterns form.
We call these chart patterns and traders like you use them to understand price action and build trading plans.
Why Stock Chart Patterns Are Important
This is the core of technical analysis and critical for traders.
Patterns tell us what moves might happen. If you’re looking to take a trade, you want to know where support and resistance are. Those are key levels where other traders might buy or sell.
Chart patterns can help with that.
If you’re oblivious to patterns, you’re trading at a disadvantage.
How Stock Chart Patterns Work
Stock chart patterns are like a roadmap for traders, providing vital clues about future price movements. These patterns, formed by the price movements on a chart, offer insights into the psychology of the market. A pattern like a flagpole, for instance, can indicate a strong price movement followed by a period of consolidation, guiding traders on potential future movements. Understanding these patterns is not just about recognizing shapes on a chart; it’s about interpreting the underlying market dynamics and investor sentiment.
In my trading experience, I’ve found that patterns such as peaks, troughs, and swing highs and lows can be crucial in determining support and resistance levels. These levels are not just lines on a chart; they represent key price points where an asset’s price could experience a significant movement, either upwards or downwards. This knowledge is invaluable in planning entry and exit points, helping to minimize risks and set appropriate stop-loss orders.
The shadow of a candlestick in forex or security trading can tell you a lot about market sentiment. A long shadow, for instance, might indicate a reversal, offering an opportunity or a warning to traders. Analyzing these patterns requires not just an understanding of the theory but also practical experience. Over the years, I’ve seen numerous cases and events that underline the importance of these patterns in making informed trading decisions.
Involving brokers and investors in discussions about chart patterns can also provide additional perspectives, enhancing your understanding of how these patterns play out in real market situations. Remember, each trader’s interpretation can vary, and what works for one might not necessarily work for another. Therefore, it’s essential to partner with a broker or service that aligns with your trading style and to continuously update your knowledge and skills in chart pattern analysis. This approach, combined with consistent research and analysis of data and statistics, can significantly improve your ability to interpret chart patterns and apply them effectively in your trading strategy.
How Stock Chart Patterns for Day Trading Work
Day trading demands a quick, strategic response to market movements. Here, chart patterns play a pivotal role in defining trading strategies. Patterns like candlesticks offer insights into short-term price movements, helping day traders to identify profitable entry and exit points. Candlestick patterns, with their wicks and bodies, provide a visual representation of market dynamics within a trading day, indicating moments of consolidation or trend reversals. When combined with other factors like volume and trendlines, these patterns can be powerful tools in a day trader’s arsenal, offering a deeper understanding of market sentiment and price directions.
How Intraday Trading Patterns Work
In intraday trading, patterns help in understanding the movement of prices within the same trading day. Swing lows and highs, for instance, indicate the volatility of a stock, guiding traders on when to enter or exit a position. Volume is also a key indicator in these patterns, as significant volume changes can confirm the strength of a trend. Recognizing these patterns and their implications can be the difference between making a profitable trade and missing an opportunity. Effective intraday trading relies heavily on the ability to read and interpret these patterns quickly and accurately.
The Three Types of Chart Patterns: Breakout, Continuation, and Reversal
Charts fall into one of three pattern types — breakout, reversal, and continuation.
- Breakout patterns can occur when a stock has been trading in a range. The top of the range is resistance, and the bottom is support. If the stock breaks through either end of this range, it’s a breakout. When it breaks above resistance, we call it a breakout. Below support is a breakdown. Learn more about breakout trading here.
- Reversal patterns happen at the end of a trend when the market’s about to change direction. For example, after a long uptrend in price, the market can wear out and start a downtrend.
- Continuation patterns signal that prices will continue the current trend. Stocks don’t go straight up or straight down. Sometimes a trend stalls before continuing in the direction it was going.
Bar Charts vs. Candlestick Charts
When it comes to day trading, the debate often boils down to bar charts vs. candlestick charts. Both offer valuable insights but in different ways. Candlestick charts, with their Japanese origins, provide detailed information about price movements, including open, high, low, and close values. The size and color of the candlestick body and wicks offer visual cues about buyer and seller momentum. Bar charts, on the other hand, focus more on the opening and closing prices, represented by horizontal lines. Each type of chart has its advantages, and the choice often depends on the trader’s personal preference and strategy.
Best Chart Patterns for Day Trading
For day traders, certain chart patterns stand out for their effectiveness in signaling potential trading opportunities. Candlestick patterns, such as the hammer or the shooting star, can indicate trend reversals. Support and resistance levels are also crucial, as they help in identifying where the price might pause or reverse. Additionally, patterns like trendlines and necklines provide insights into the continuation or change in market trends.
An understanding of these patterns, combined with a solid trading strategy and risk management principles, can significantly enhance a trader’s ability to make profitable trades. Remember, the key to success in day trading is not just recognizing patterns but also understanding their implications and how they fit into the broader market context.
I’ll get into basic patterns like the flag pattern, which is crucial for identifying continuation signals in the market. This pattern is formed when a sharp price movement is followed by a short consolidation period, resembling a flag on a pole. The flag can be bullish or bearish, indicating a pause before the previous trend resumes. Recognizing a flag pattern helps traders anticipate potential price movements, allowing them to strategize their entries and exits effectively. For a deeper dive into the intricacies of the flag pattern and how to leverage it in day trading, explore StocksToTrade’s comprehensive guide on the flag pattern.
Why Should Traders Use Stock Patterns?
Distinct chart patterns play out again and again. Why? Because human emotions drive the markets, and human nature rarely changes.
That’s why chart patterns are key. They can give you insight into the market’s underlying psychology. That can provide insight for making smarter trading decisions.
Classic Chart Patterns Every Trader Must Know
There are hundreds of stock chart patterns…
But traders tend to gravitate toward a handful of stock chart patterns. These are the classics. Get to know these key patterns to better understand price action and plan trades.
#1: The Cup and Handle
This is a popular breakout pattern.
The price comes up and sets a high. Then it falls back and sets a base. It comes back to the first high and pulls back again, but not to the original base. It rebounds off a higher low and breaks out.
The rounded bottom is the cup and the first base. The handle is where we see the higher low. Read more about the cup and handle here.

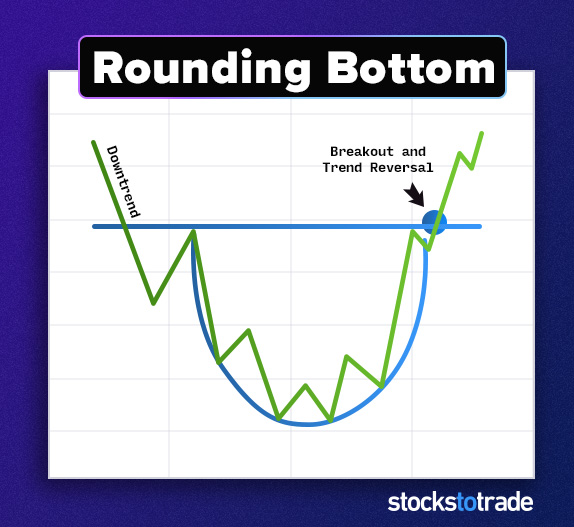
#2: The Rounding Bottom
The rounding bottom signals a reversal and can lead to a breakout.
It looks the way it sounds … The stock comes up to a resistance level, then pulls back. It downtrends to support before forming an uptrend. Picture a bowl.
This is also called an ABCD pattern.
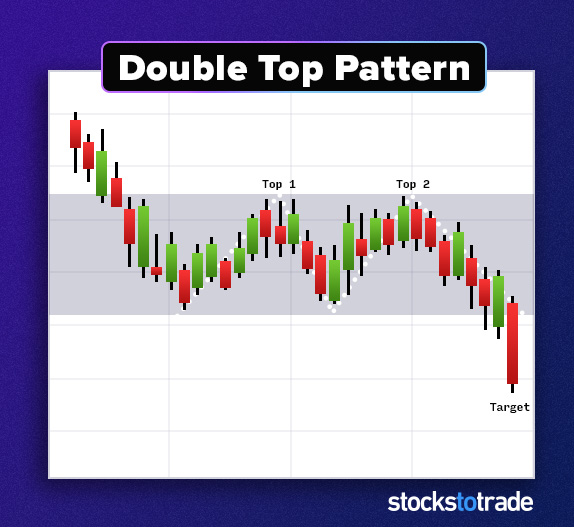
#3: The Double-Top
A double-top is a basic but powerful reversal pattern. We see this pattern when an uptrending market tests a level, pulls back, then tests that level again. It fails to break through, and the price falls back down.
The two highs are around the same price — that’s why we call it a double-top. The double-top pattern happens when the market doesn’t have enough bullish momentum.
This pattern can signal the end of an uptrend — at least for the time being. You can expect the price to either trade in a range or begin a downtrend.
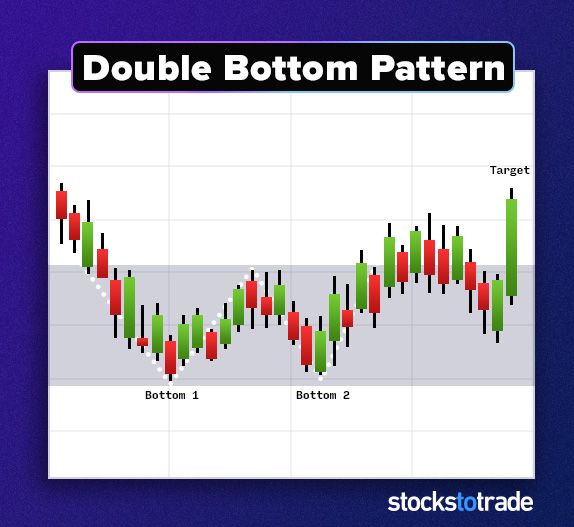
#4: Double-Bottom
The double-bottom pattern falls into the reversal category.
As the name implies, this pattern has two bottoms. The price falls and comes back up. Later, it tests the bottom again but finds support and moves up again.
Keep an eye on the level where it bottomed twice. That’s now a key level.
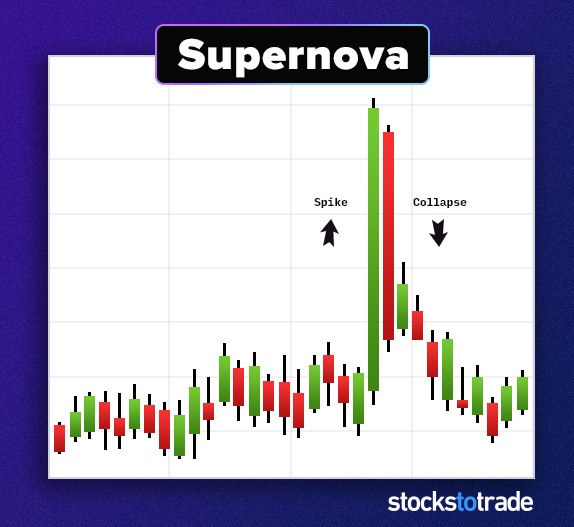
#5: The Supernova
The supernova is a favorite among penny stock traders.
This breakout pattern plays out a lot in penny stocks, especially with heavily shorted, low float stocks.
The supernova runs on hype. The hype hits, and buyers pile in, triggering a short squeeze. Once the mania dies, the price drops as fast as it went up. Don’t get greedy with this volatile play.
#6: The Head and Shoulders
This well-known reversal pattern looks like the name suggests and indicates the stock’s uptrend will end.
It starts with a small price movement upward, then pulls back. Then the price moves above the original resistance before pulling back. Finally, there’s another move upward that stops at the first resistance line.
The two smaller swings are the shoulders, and the big swing in the middle is the head.
Study the head and shoulders pattern further here.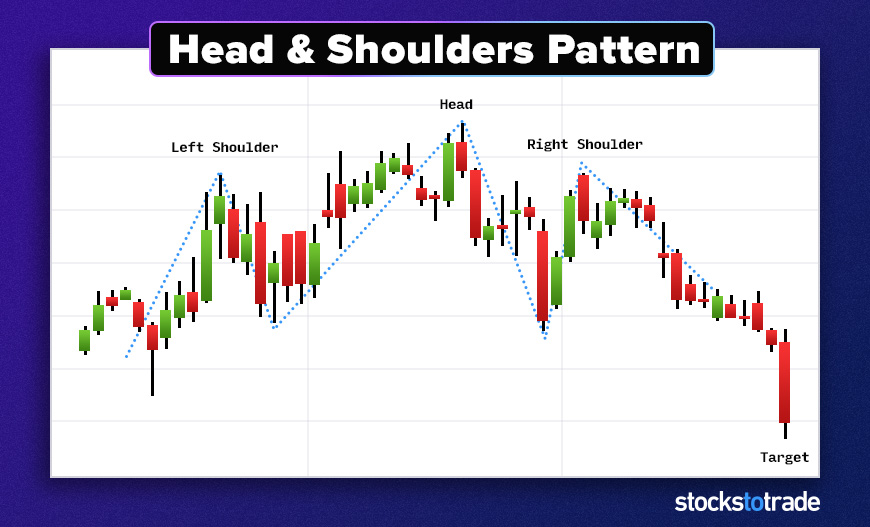
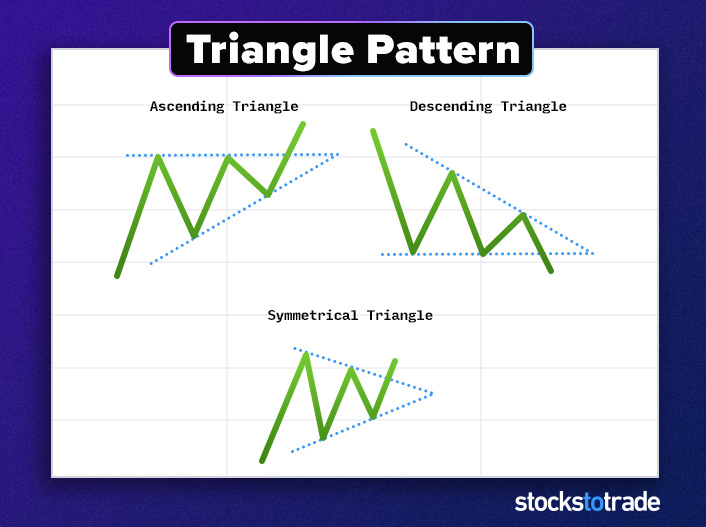
#7: The Triangle
With triangle chart patterns, the price makes smaller and smaller swings. If you connect lines along the tops and bottoms, they form a triangle.
Triangles are versatile and great for beginners. Some precede reversals and continuations, and others signal breakouts. Here are three types of triangle patterns:
- The symmetrical triangle. The top and bottom trend lines are equal distances from the midpoint. Traders often view this as a pause in the market’s momentum before it continues.
- The ascending triangle. The lower trend line is rising, but the top line is horizontal. This can be a breakout, continuation, or reversal. Read up on the ascending triangle pattern here.
- The descending triangle. The upper trend line slopes down, but the bottom line is horizontal. This continuation pattern is found in downtrends.
#8: The Wedge
The wedge is a kind of triangle that can signal a breakout or continuation.
It can be an upward or downward wedge. It starts with wide price action that gets tighter with a clear direction.
Higher lows and higher highs create a bullish wedge. Lower highs and lower lows create a bearish wedge. The top or bottom lines aren’t as steep as the support or resistance lines.
Imagine an ascending or descending triangle, but the horizontal line is on a slope.

Sundial Growers, Inc. (NASDAQ: SNDL) showing a wedge pattern (Source: StocksToTrade)
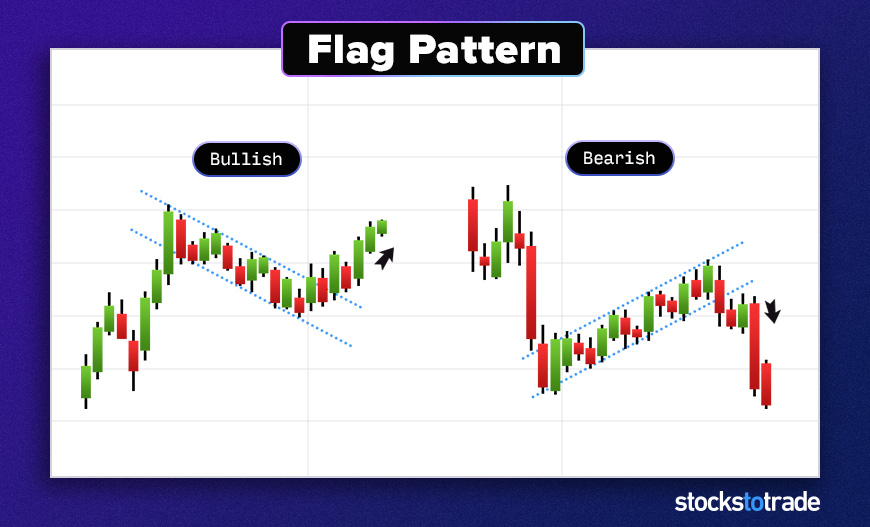
#9: The Flag
The flag is another common continuation pattern. Flags can be bullish or bearish.
A bull flag starts with a strong upward move. Then buyers relent and the price pulls back. Traders see this as a pause in momentum and expect the original trend to soon resume.
A bear flag is the opposite.
Learn more about bull flags here. This is another great pattern for beginners.
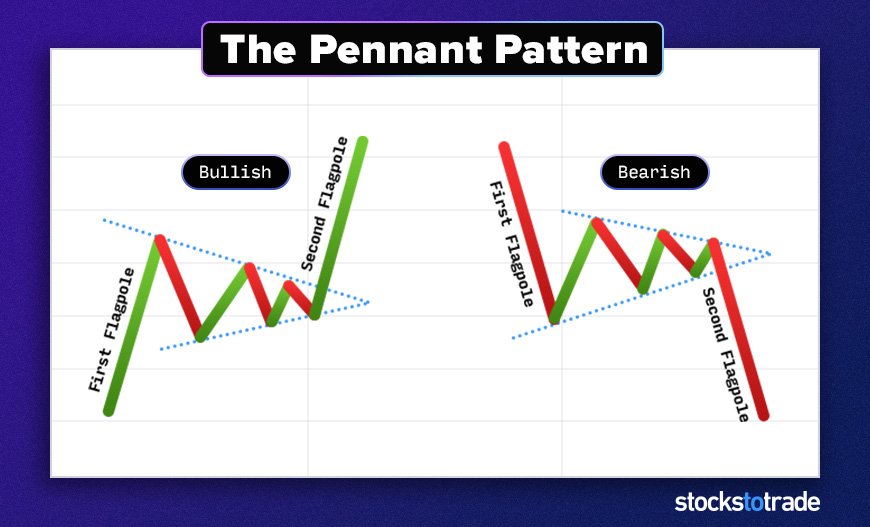
#10: The Pennant
Pennants signal continuation.
As with a bull or bear flag, the price shoots in one direction. This creates a pole. Then the price action pulls back and begins to move up and down. It gets tighter toward the point.
If you draw a line across the top and the bottom, you wind up with a long, symmetrical triangle.
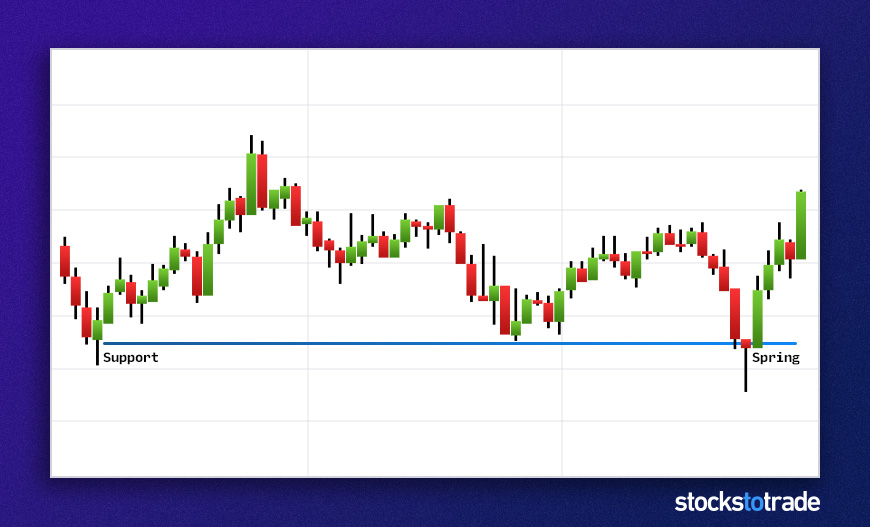
#11: The Spring
This reversal stock chart pattern isn’t as well known, but it’s a favorite of many pro traders.
The pattern has a few names, such as spring, stop-hunt, 2B, pump fake, and fake-out.
The market sets a key high or low point, then pulls away. Later, it retests. It flicks through the key high or low before the price falls away again.
It’s like a double-top or double-bottom. But instead, the spring penetrates the original level.
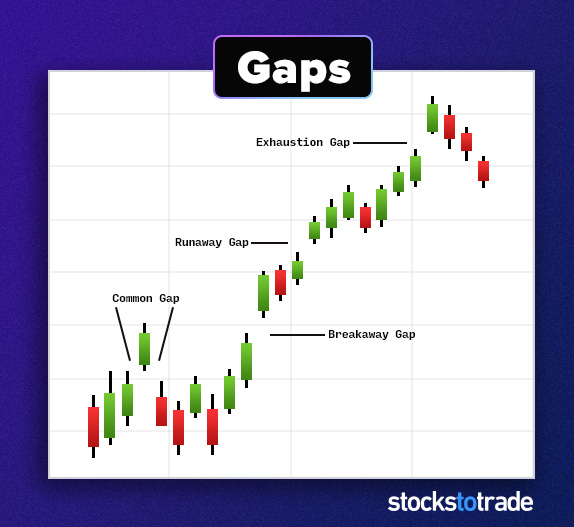
#12: Gaps
When a stock opens above or below its closing price, it creates a gap in the chart. Usually, this results from extended-hours trading. Sometimes trading halts can cause gaps intraday.
While not a pattern per se, this is a common occurrence in the market. A stock can gap above or below a key level. That would be a breakout.
It can also gap in the opposite direction of a trend, signaling a reversal.
How to Learn Stock Patterns
Want to know how to learn stock patterns? Practice, practice, practice.
There’s no shortcut. You have to put in screen time.
Review old charts. Look for the patterns I’ve shared here. Pick one or two patterns at a time and get to know them.
I talk about the hottest stocks in my premarket sessions. Catch me live at 8:30 a.m. Eastern on YouTube every Monday. Want access to my sessions the rest of the week — and get more on what I’m watching every week and month? Here’s how.
How to Read Stock Chart Patterns
With chart patterns you’re looking for key levels. You want to see how the price behaves around those key levels. Here are some key levels to watch:
- High and low of the day
- 52-week highs and lows
- Previous close
- Open
- Premarket highs
It takes LOTS of practice and screen time to see patterns form in real time. But traders like you can learn to do it.
Use StocksToTrade to Help You Trade Chart Patterns
Chart patterns, technical indicators, news catalysts — traders have countless ways to look for trades.
The markets are more competitive than ever, so enter battle with the right tools.
That’s something we thought about when building the StocksToTrade platform. It’s the all-in-one trading solution made by traders for traders.
I could list every feature, but you should see it for yourself. Start your 14-day trial of StocksToTrade today!
Conclusion
Stock chart patterns can be powerful tools to help you find amazing trades.
If you know how they work, they can help you build trade plans.
You don’t need to learn them all — just those that work best for you. Once you do that, study charts until your eyes bleed. OK, not really. But I’d get super cozy with them.
And you don’t have to go it alone. I go live daily to answer questions and help my students find their best trades.
What are your go-to chart patterns? Let me know in the comments!
Frequently Asked Questions About Stock Chart Patterns
Do Chart Patterns Work?
Yes, but no pattern works 100% of the time. And no pattern will play out exactly the same every time. To learn them, you need practice. Lots of practice.
How Many Stock Chart Patterns Are There?
There are three types of patterns — breakouts, reversals, and continuations. Within those three types of patterns, there are many possibilities. You don’t have to know them all. Find what works for you.
How Do You Predict if a Stock Will Go Up or Down?
Look for bullish patterns and bearish patterns. If a pattern;’s bullish, it’s likely to go up. The opposite holds true for bearish patterns. Remember you can try to predict, but you never know for sure what will happen. Be ready to cut losses if you’re wrong.
What Patterns Do Day Traders Look For?
I always check the daily chart first. Then I look for key levels and breakouts. My favorite patterns — and setups — are the dip and rip and the VWAP-hold high-of-day break. They’re not classics per se, but they’re effective and easy to learn.
How Can Understanding Support Levels and Price Patterns Benefit Day Trading?
In day trading, understanding support lines and price patterns is crucial for identifying lucrative entry points and effective stop loss positions. Support levels indicate a price level at which a stock historically doesn’t fall below, providing a potential entry point for traders. Price patterns, observed through a price chart, help in predicting future price movements. By analyzing these patterns, traders can make informed decisions about where to allocate money, enhancing their trading positions. Candlestick trading, as an example, is a popular method used to interpret price patterns for better trading strategies.
What Is the Role of Client Services in Enhancing Trading Strategies?
Client services play a pivotal role in enhancing trading strategies, especially in terms of providing examples, reasons, and assistance in account management and product recommendation. For a client looking to engage in day trading, these services offer essential guidance on products and creating effective trading attempts. Businesses that provide trading services often equip clients with tools and resources to better understand market dynamics and refine their approaches. This support is instrumental in helping clients navigate complex trading environments and make informed decisions in their trading endeavors.