
How easily can you spot a cup and handle pattern on a chart?
Here’s why it matters … Chart patterns are important because they can help traders better predict price movements.
By learning to recognize them in real time, traders can limit their risks by determining the best points for entry and exit.
One of the most popular chart patterns is the cup and handle pattern.
It’s been used for decades and it’s one of the many that we watch for in our SteadyTrade Team mentorship program.
It can take some time for this pattern to develop … but traders like it because it’s easy to recognize and has an excellent risk to reward ratio.
In this post, you’ll learn a lot about this basic pattern and how it works.
You’ll also learn what to do when you locate one.
So let’s get to it!
Table of Contents
- 1 What Is the Cup and Handle Pattern?
- 2 Cup and Handle Pattern Recognition
- 3 How Does the Cup and Handle Work?
- 4 Examples of the Cup and Handle Pattern
- 5 Advantages of the Cup and Handle Pattern
- 6 Limitations of the Cup and Handle
- 7 How to Trade the Cup and Handle Pattern
- 8 Awesome Charting With StocksToTrade
- 9 Conclusion
What Is the Cup and Handle Pattern?
It’s a technical chart pattern made popular by William O’Neil in his book “How to Make Money in Stocks.”
It’s a continuation pattern that may indicate future gains. Where did it get its name?
Well, if you look at the pattern from its side, it looks like a cup with a handle. Take a look at the chart below:
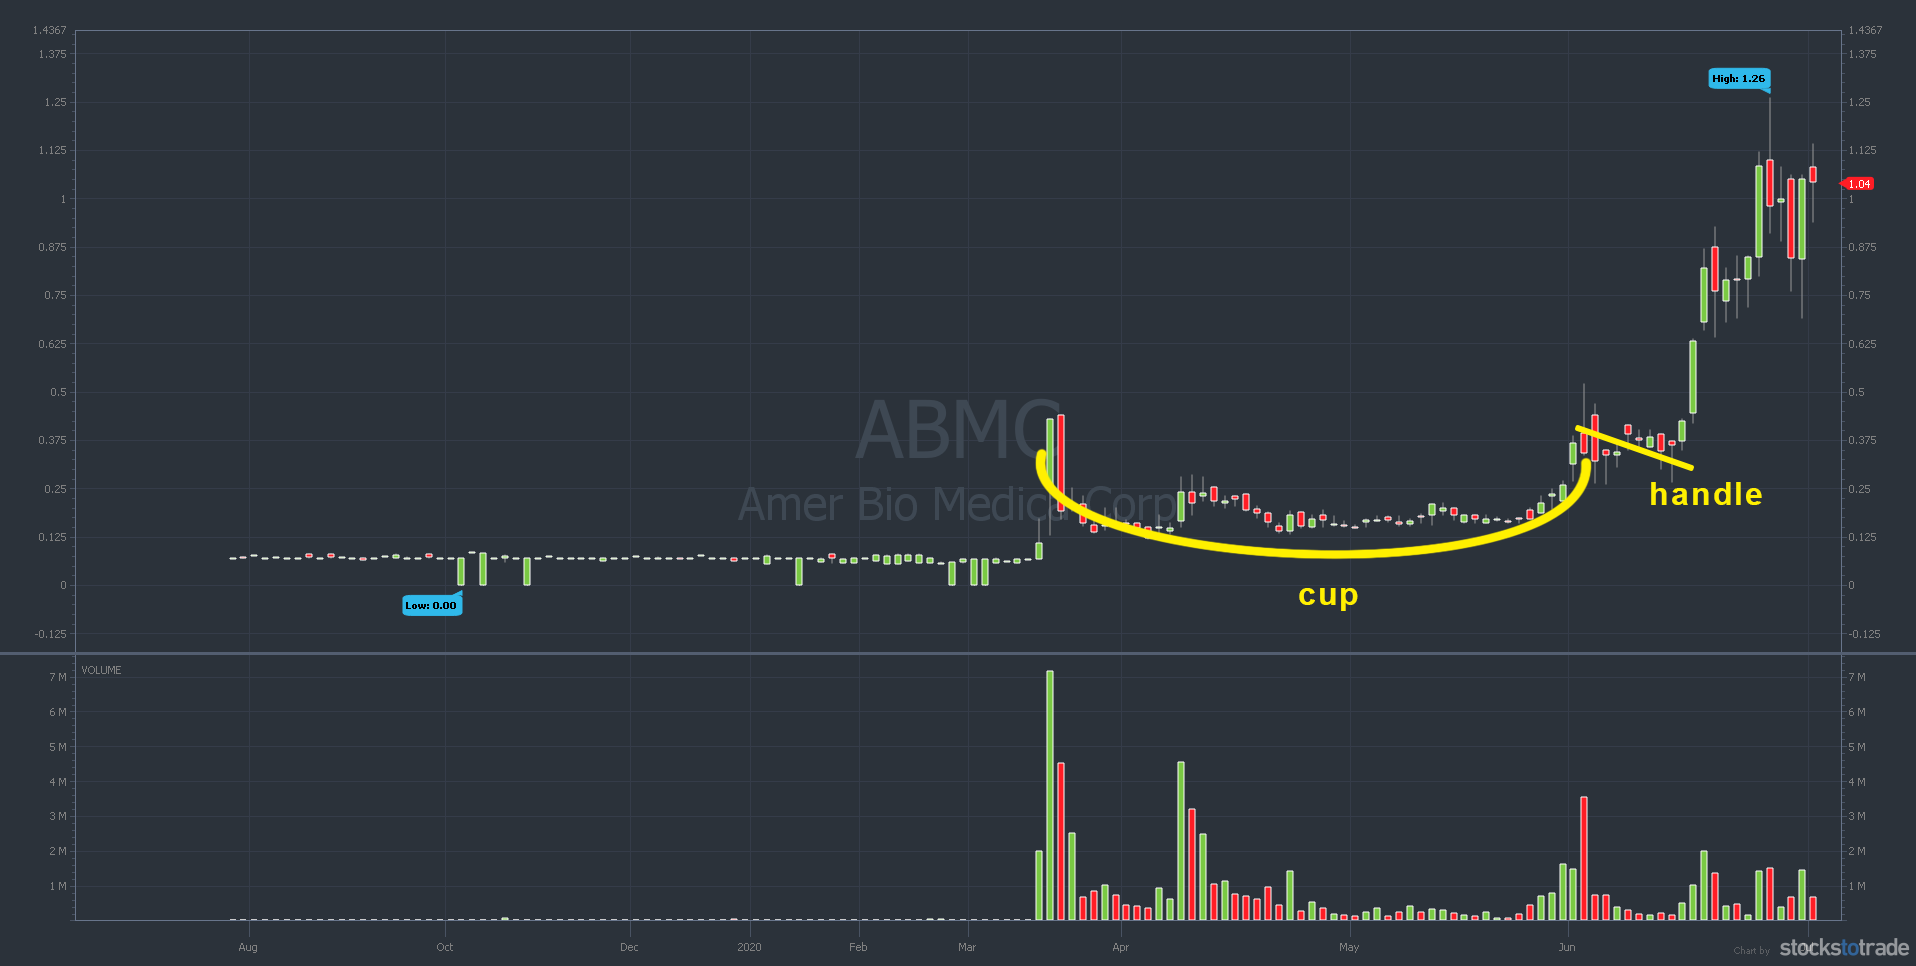
Amer Bio Medica Corp (OTCPK: ABMC) 1-year chart (Source: StocksToTrade)
(As an Amazon Associate, we earn from qualifying purchases.)
Is the Cup and Handle a Bullish Pattern?
Yep, this is a bullish pattern and can be a technical indicator for traders of a potential upcoming breakout.
Technical traders often buy right when the stock climbs back to the pivot price — or the top of the handle.
Cup and Handle Pattern Recognition
Cup and handle chart patterns can last anywhere from seven to 65 weeks.
It starts when a stock’s price runs up at least 30% … This uptrend must happen before the cup base’s construction. Then it has a 12%–33% drop from its high.
Eventually, the stock finds a floor of support for weeks or longer before climbing again. This forms the cup portion of the pattern.
From there a handle starts to form. A proper handle forms in the upper half of the base and is at least five trading days long, typically light in volume.
In most cases, the decline from the high to the low of the handle shouldn’t exceed 8%–12%. If it does, it shouldn’t exceed the previous drop within the cup.
The handle should complete within a month. If it doesn’t, the stock’s momentum may not be enough to break through the higher resistance level.
It’s important to note that even O’Neil says the pattern isn’t an exact science. Sometimes the initial drop from the top of the cup can go as deep as 75% … And sometimes the cups don’t even have a handle.
Remember: The purpose of chart patterns is to help you find trading opportunities.
As you practice and gain experience, you’ll get better at recognizing and using this pattern.
How Does the Cup and Handle Work?
After the initial stock runup of the pattern, the price drops as investors sell their shares. This drop in price forms the left side of the cup.
Why is the sell-off important? Well, it means less-committed investors are shaken out.
After they exit, the stock can consolidate to form the base until it runs again. This happens when traders and investors stop selling shares and shift back into buying mode. That sends the stock higher.
After the cup is completed, a trading range develops on the right side — which forms the handle.
Examples of the Cup and Handle Pattern
This pattern can happen in different time frames. Let’s take a look at a few examples.
Ideanomics Inc. (NASDAQ: IDEX)
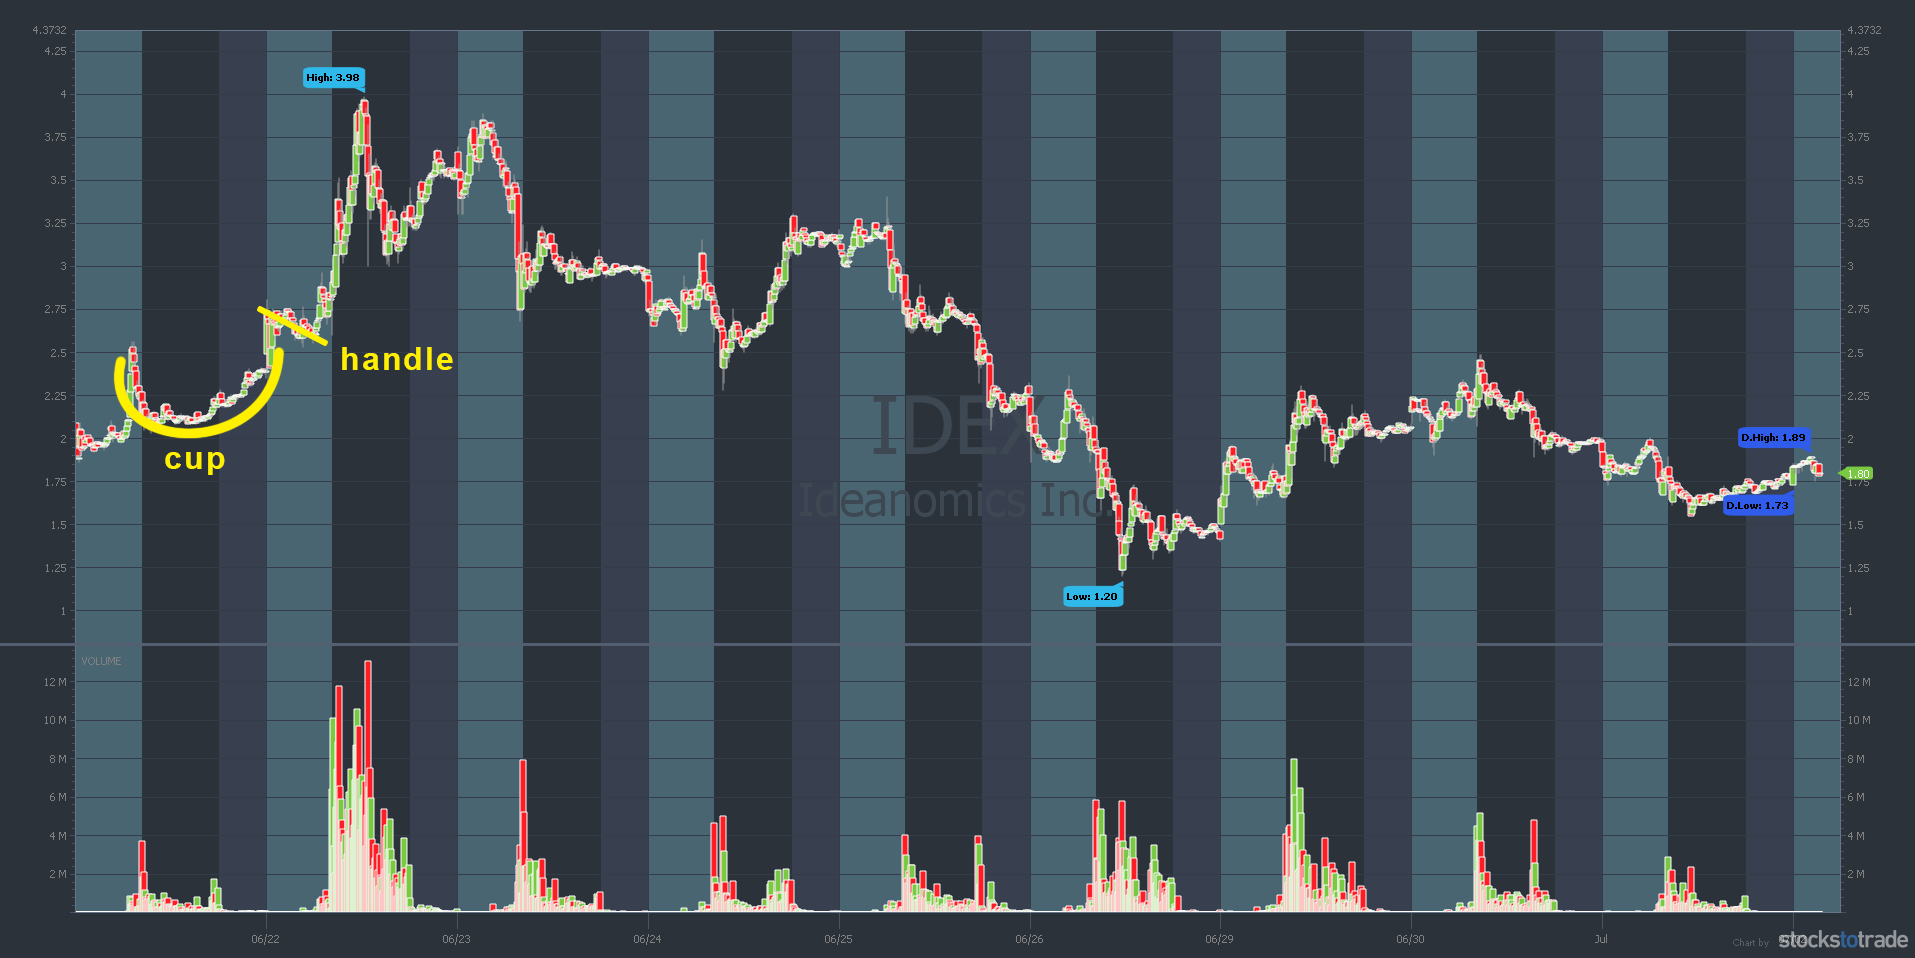
IDEX 5-minute chart, cup and handle, June 21–July 1 (Source: StocksToTrade)
IDEX formed a cup and handle on June 21. Notice the clear cup shape and the following handle before it spiked up the next day.
Nightfood Holdings Inc (OTCQB: NGTF)
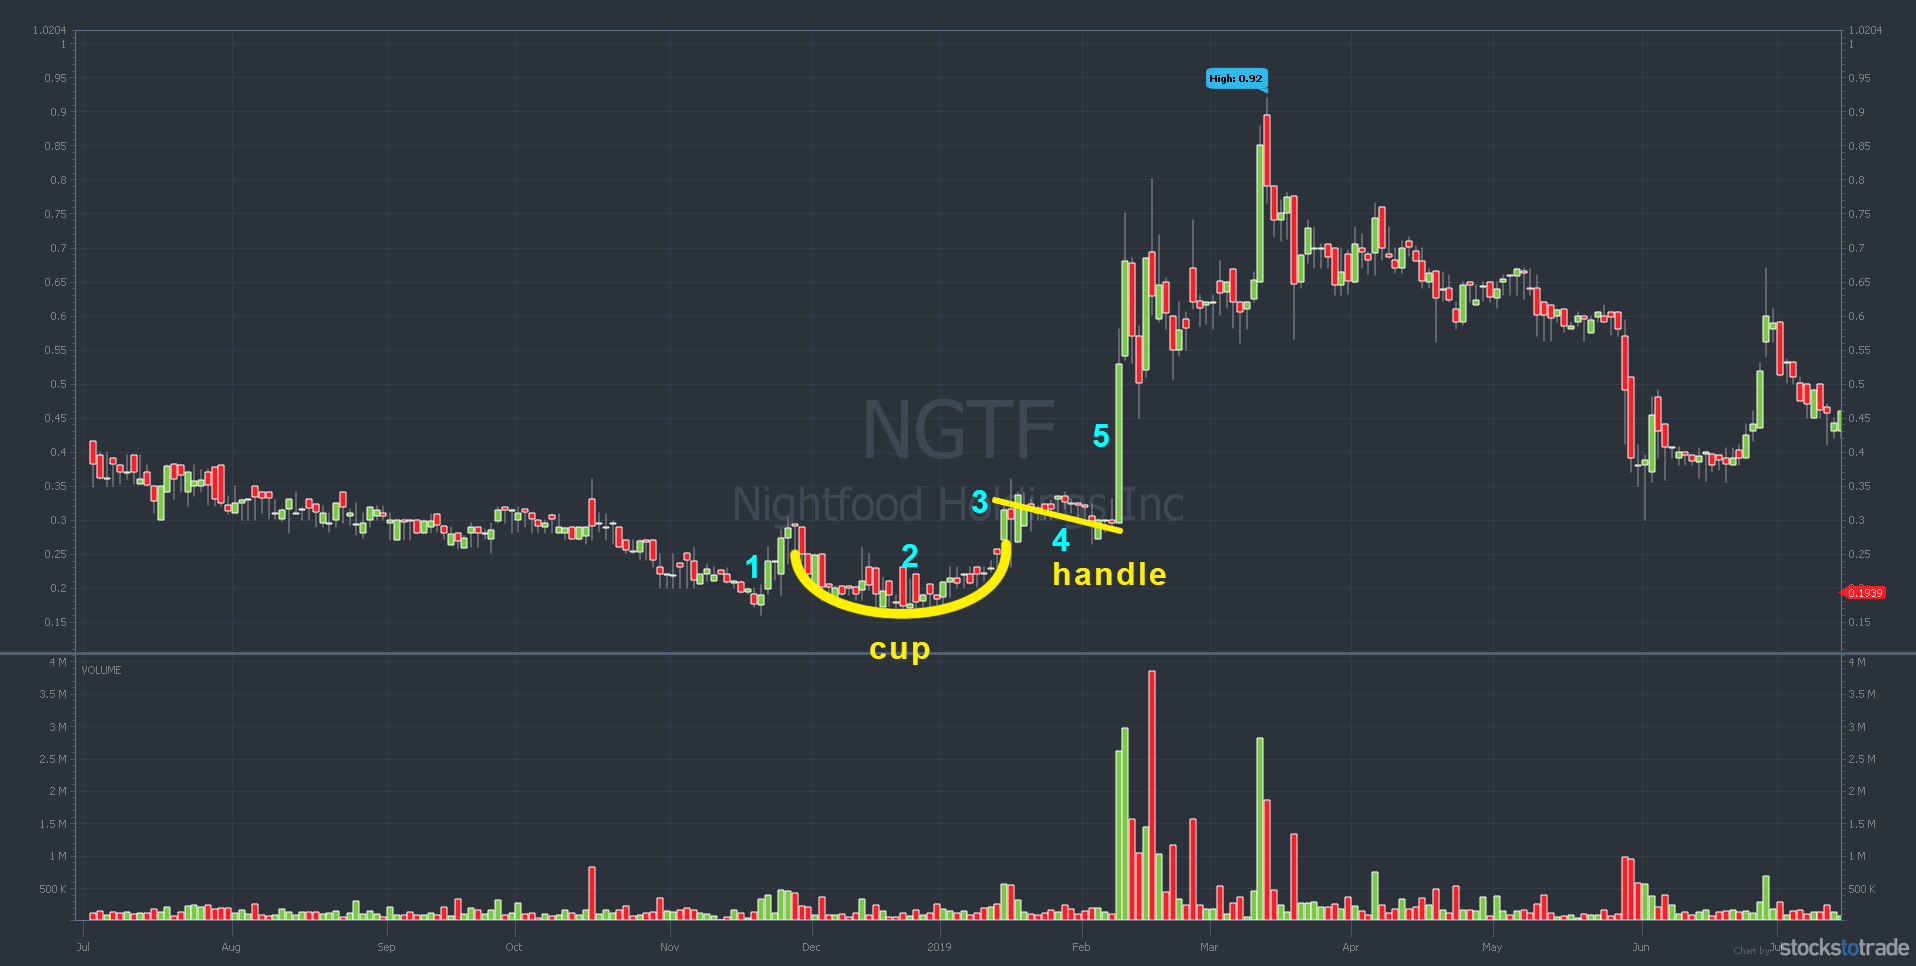
NGTF chart, cup and handle, July 2018–July 2019 (Source: StocksToTrade)
Here’s an example of a cup and handle in a longer time frame. NGTF started the pattern at the end of November 2018 and went into February of 2019.
Polymet Mining Corporation (AMEX: PLM)
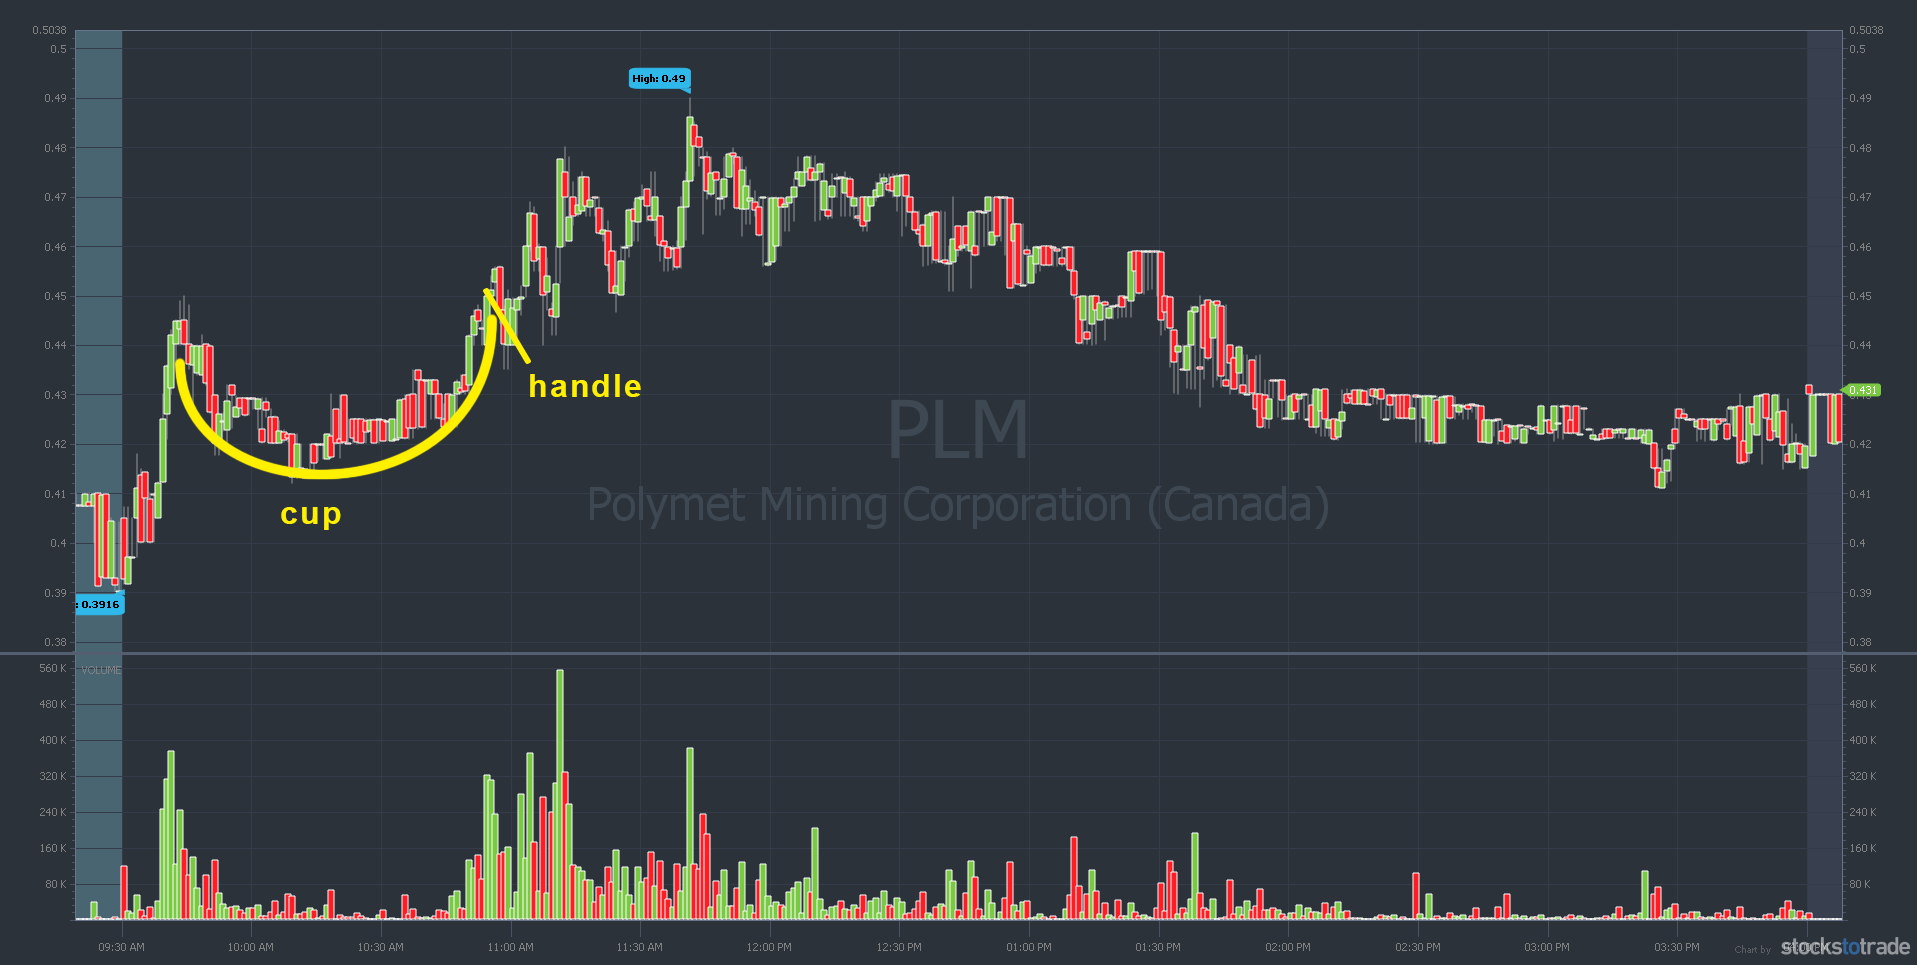
PLM chart, intraday cup and handle, July 1, 2020 (Source: StocksToTrade)
PLM formed an intraday cup and handle in July. The handle isn’t as pronounced as the first two, but it’s there.
Remember, patterns won’t look perfect all the time, and it’s unrealistic to expect them to do so. Patterns help us recognize possible upcoming movements so that we can create trading plans to catch moves that fit our strategies.
Plug Power Inc (NASDAQ: PLUG)
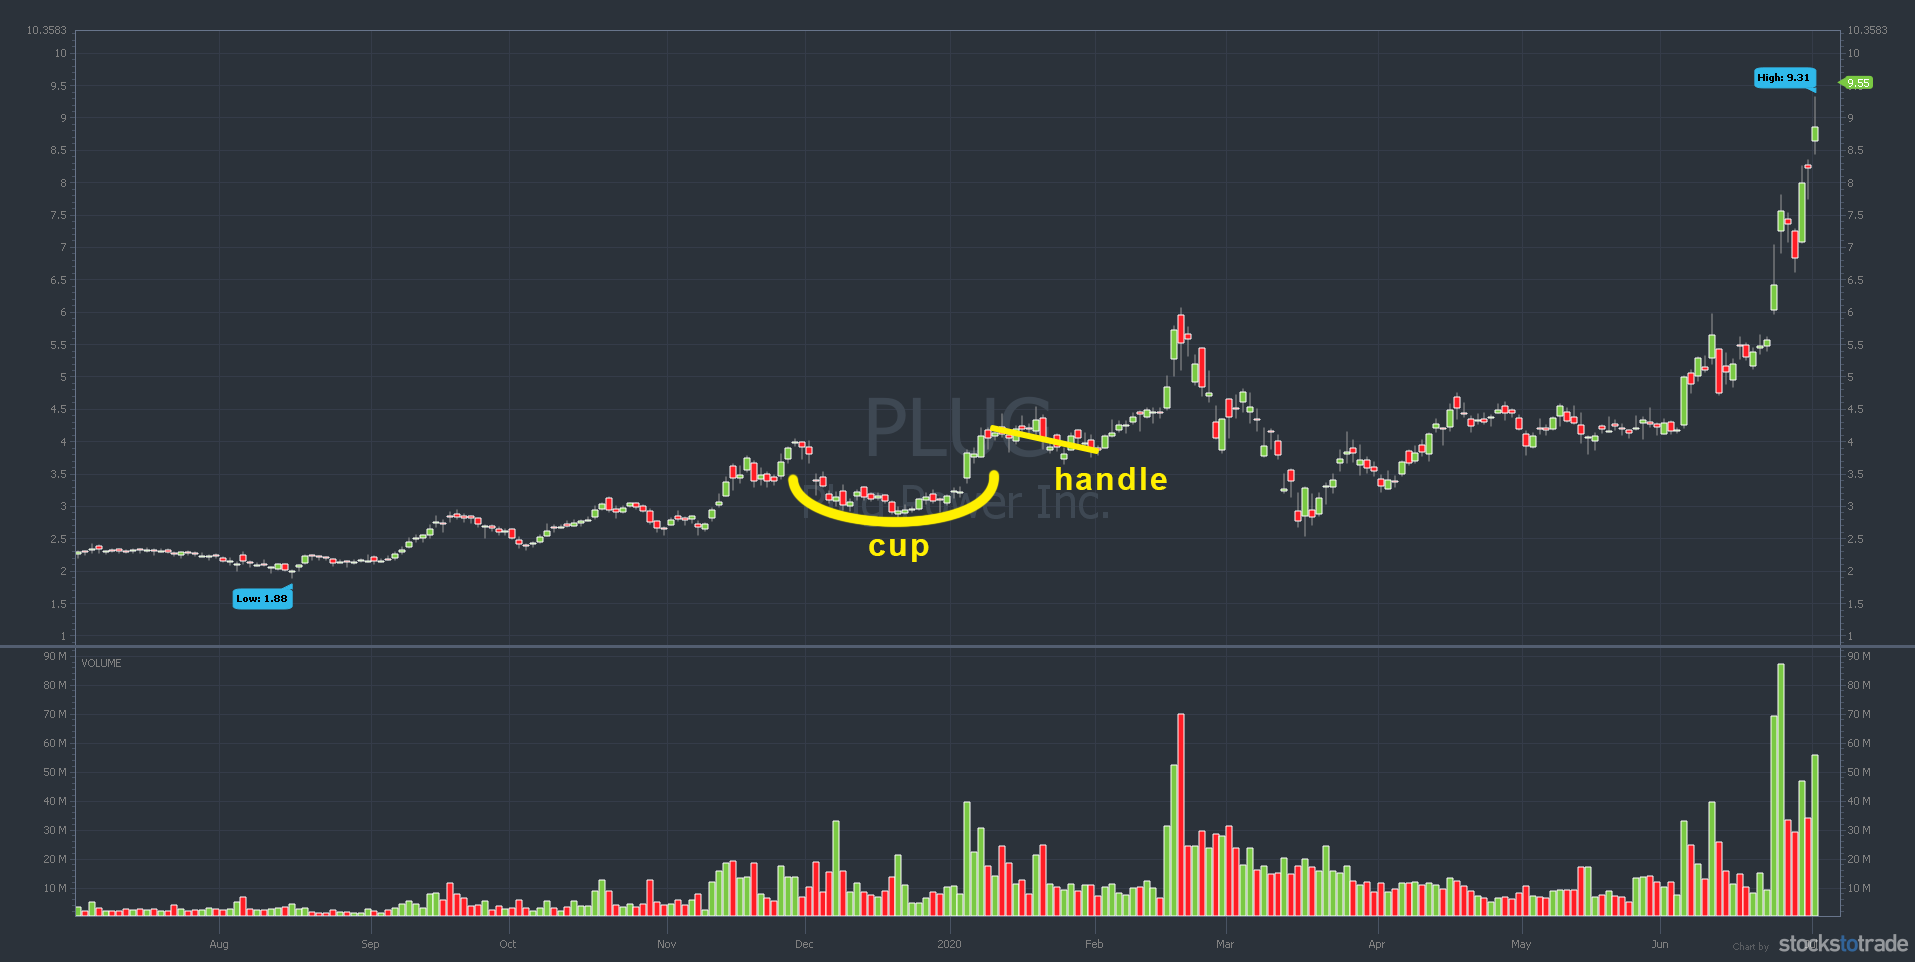
PLUG 1-year cup and handle (Source: StocksToTrade)
Here’s another cup and handle in a longer time frame.
PLUG started at the end of November in 2019 and went all the way into February 2020 before starting its rise.
Rare Element Resources Ltd. (OTCQB: REEMF)
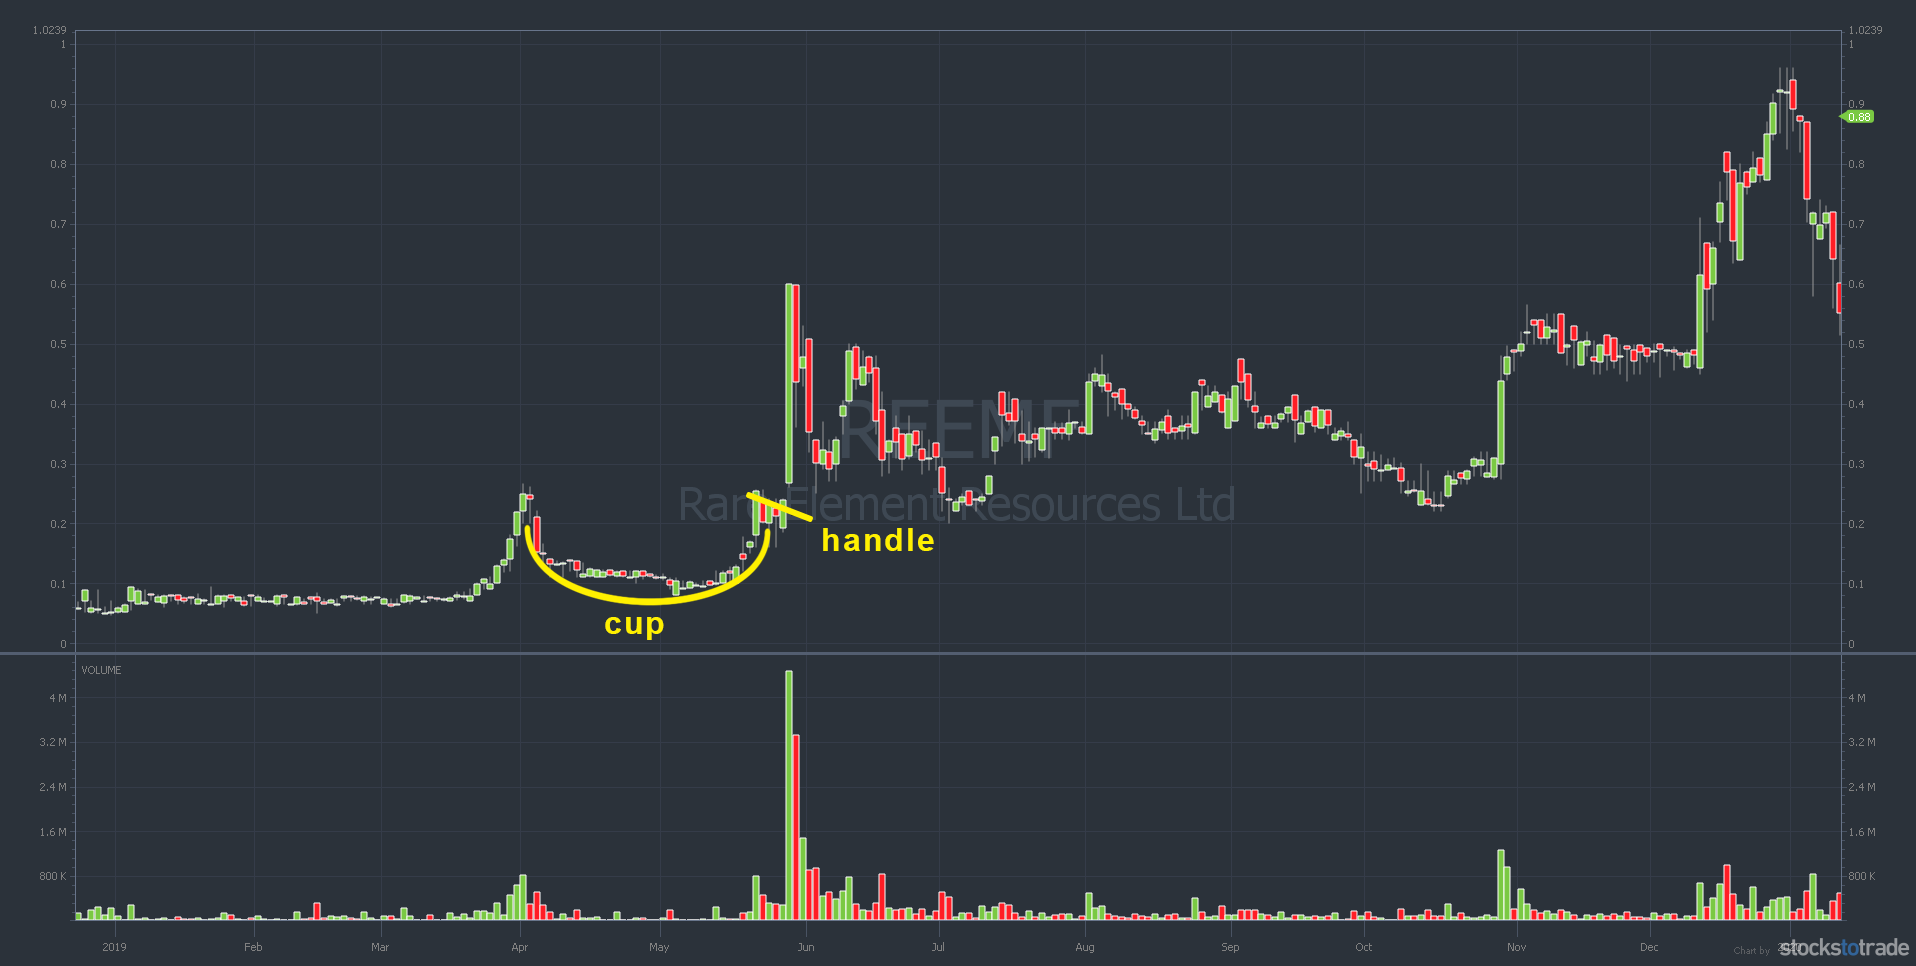
REEMF chart, cup and handle, 2019 (Source: StocksToTrade)
OTC stocks can form cup and handle patterns, too. REEMF started one in April of 2019 and went all the way to the end of May before spiking up.
ElectraMeccanica Vehicles Corp. (NASDAQ: SOLO)
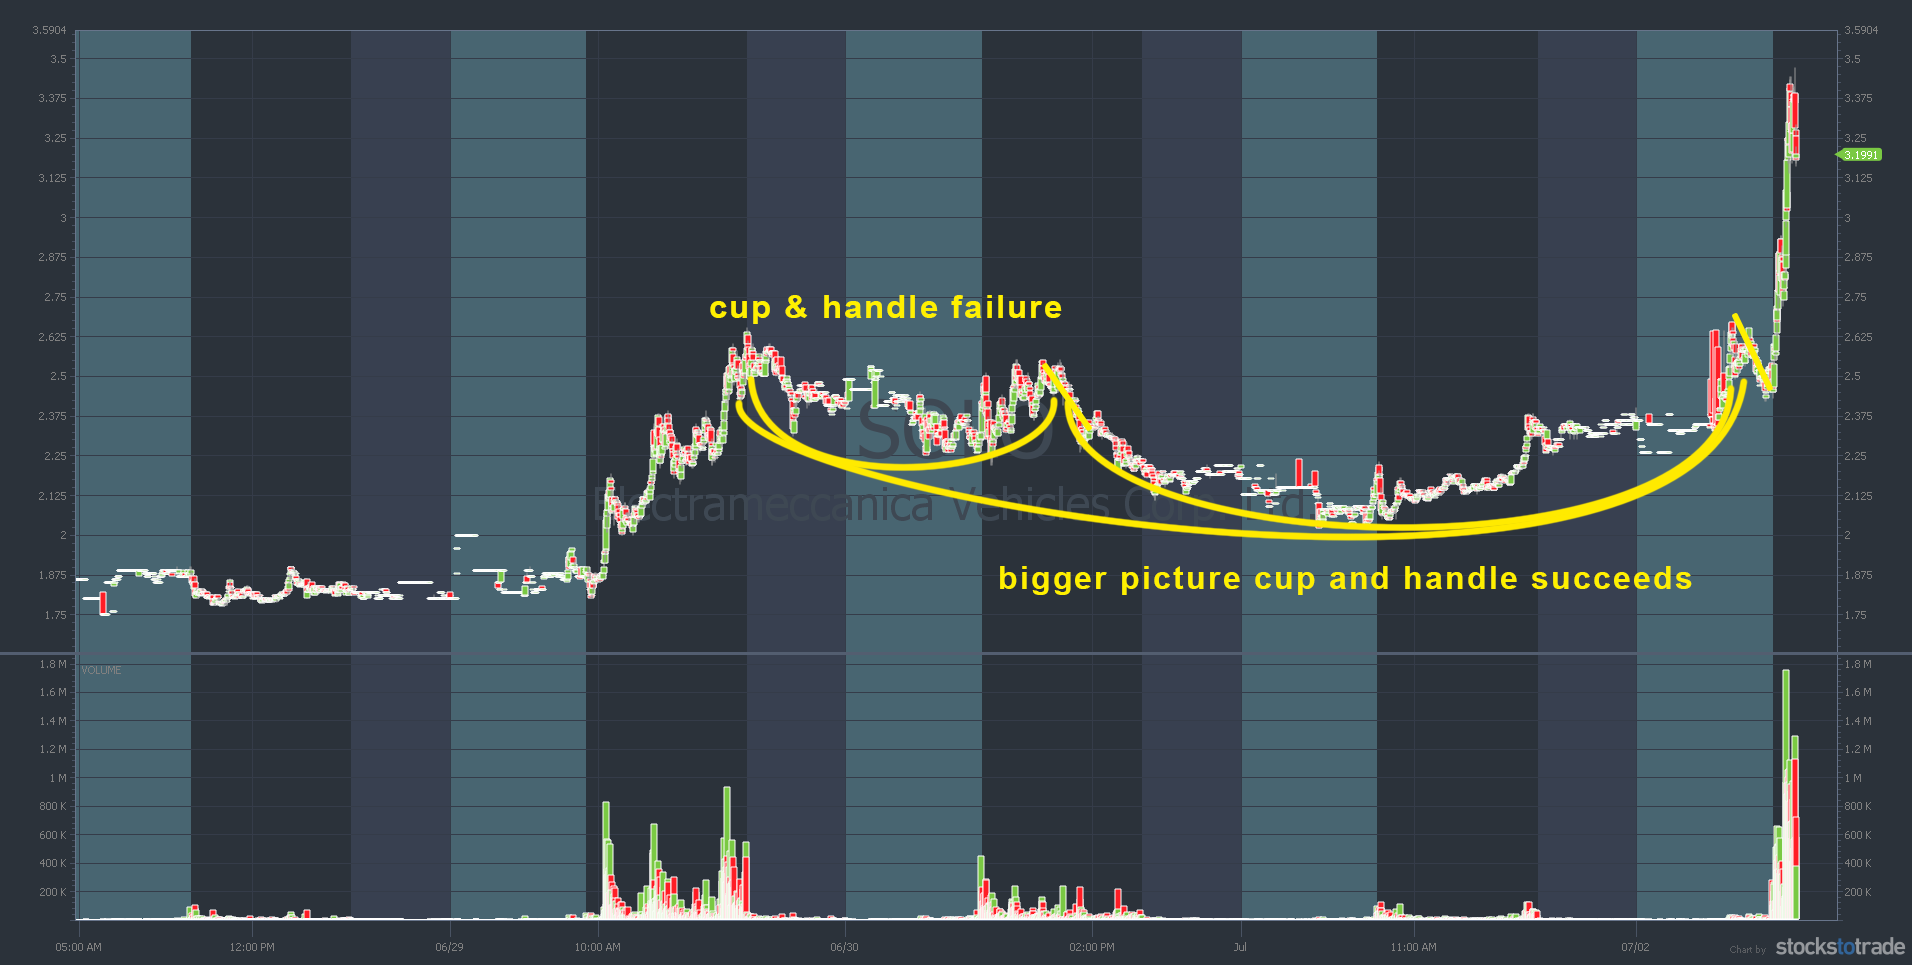
SOLO chart, cup and handle June 28–July 2, 2020 (Source: StocksToTrade)
This one’s tricky. The pattern failed at first … but ended up completing the pattern three days later.
Advantages of the Cup and Handle Pattern
This pattern tends to have a great risk/reward ratio.
The bottom of the cup is a stabilizing period where the price moves sideways. This means that the price found a good support level that it couldn’t drop below for some time. That can provide traders with a strong point to set a stop loss.
The heavy support level can potentially improve the odds of the price moving higher after a breakout.
And there’s another great thing about this pattern — it can be pretty easy to recognize once you become familiar with it.
Limitations of the Cup and Handle
Remember what I said earlier about O’Neill — the man who made the cup and handle pattern famous? Even he admitted that this pattern isn’t an exact science.
One of its limitations is the ambiguity of the pattern formation.
Cup shapes, heights, and price targets can differ greatly. If you’re going to use this pattern in your trading strategy, you’ll have to accept the discrepancies.
The pattern can also differ greatly with the time it takes to form. As I said earlier, the pattern can take between seven and 75 weeks.
How to Trade the Cup and Handle Pattern
It’s important to note that the cup should be round rather than V-shaped.
The round shape indicates consolidation, and that’s a good thing. If the cup is in a V-shape, the reversal will be too sharp of a movement.
The cup should also be relatively shallow. Less of a price drop from the high is a signal of strength and shows more potential of an upcoming uptrend.
If the pattern is successful, there’s a good chance for another breakout after the stock passes the cup’s previous high.
How and When to Enter or Exit This Pattern
The best place to enter a trade using this pattern is when the handle forms.
At this point, the cup and handle chart pattern will be evident. That can maximize the likelihood of predicting a breakout while potentially minimizing risk.
The handle will typically form a descending trendline … Take a look at the chart below for an example.
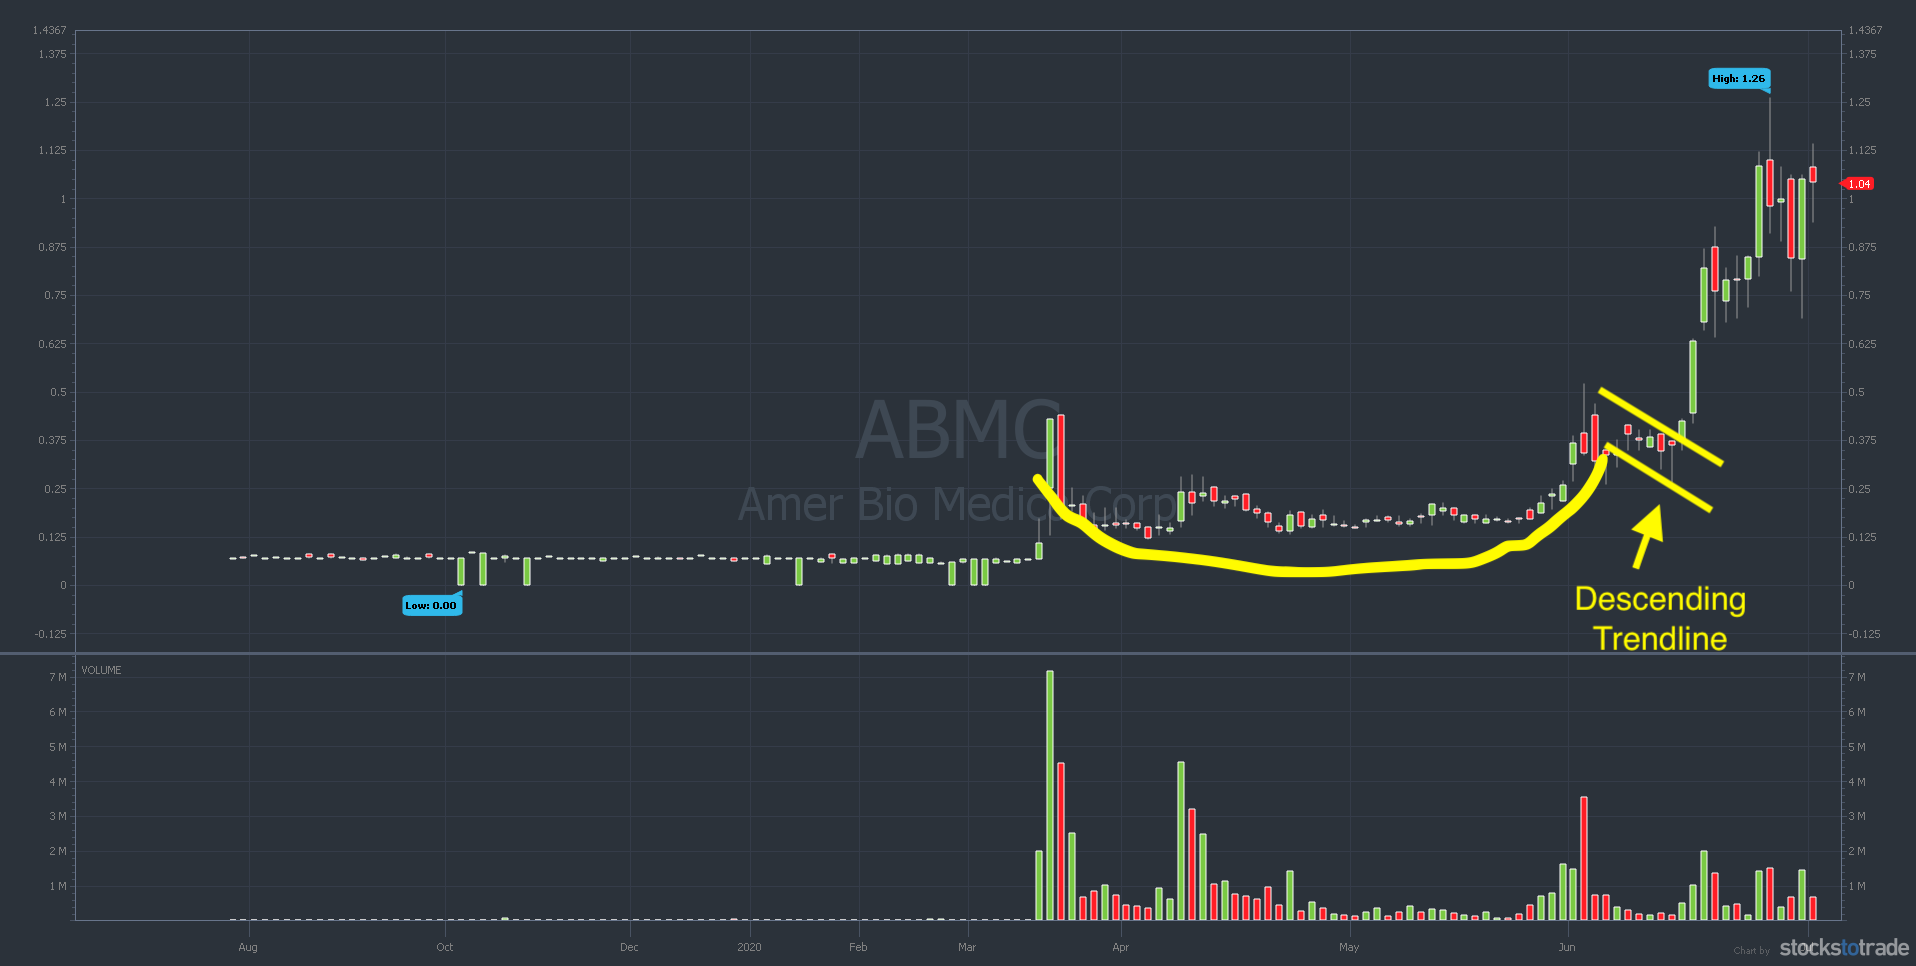
Amer Bio Medica Corp (OTCPK: ABMC) 1-year chart (Source: StocksToTrade)
A good entry would be when the price breaks above the top of the descending trendline. Make sure to watch for a sharp increase in volume. That can indicate that the stock may be breaking out.
What Is an Inverted Cup and Handle?
The inverted cup and handle is the opposite of the pattern I just broke down. You can think of it as an upside-down cup with a handle.
You may remember that I said the cup and handle is a bullish continuation pattern … Well, the inverted cup and handle is a bearish continuation pattern.
Look for a roughly 30% downward move, an inverted U-shaped correction, and a bounce handle. The final phase is a breakdown.

Awesome Charting With StocksToTrade
No big secret here — I love charts. I often tell new traders to study charts until their eyes bleed. That’s a bit of an exaggeration, but I want every trader to understand how much a chart can tell you.
That’s why we designed StocksToTrade to have such incredible, easy-to-customize charts. You can add in lines for support or resistance, use technical indicators, easily export to review later, and so much more.
That’s just one way the StocksToTrade platform makes it easier to trade every day. Try it — I bet you’ll fall in love with our features too. Get your 14-day trial for just $7 today and start charting!
Conclusion
Now you have another chart pattern in your tool belt to study. The cup and handle is one of the classic patterns that every trader should know.
Even if you don’t plan on using it, it’s popular with a lot of traders. That means it can become a self-fulfilling prophecy when enough traders see it forming.
If you can see what other traders are seeing and determine how they are thinking, you can make smarter decisions and trade more effectively.
Trading is a battle. You must know what your up against and you need to take the right gear into battle.
Good news — you don’t have to go it alone. I invite you to join the SteadyTrade Team today. Every day we provide members with mentorship, webinars, chat, trading education, and community. It’s all so you can ask questions, get answers, and find your market groove.
If you’re looking for a trading platform, check out StocksToTrade. Our platform is designed by traders for traders. It has a TON of tools and resources. Traders of all levels will love our charts, built-in scans, watchlist capabilities, and so much more. You can try it out for 14 days for only $7 here.

And you gotta check out our brand-new Breaking News chat feature. Traders love it. See how two skilled stock market pros can help you find the news with the most potential to move stocks. Here’s where you can learn more and start a 14-day trial TODAY.
What do you think about the cup and handle pattern? Leave a comment!