
Let’s dig into bullish vs. bearish in the markets … Bullish means up, and bearish means down, right? Well, almost…
There are bullish stocks, bearish markets, and bullish indicators. In just the past year we’ve had bull and bear markets … bull and bear sectors … and tons of bullish and bearish stocks. Phew!
But what do ‘bullish’ and ‘bearish’ actually mean? I’ll break it down for you here…
Table of Contents
- 1 Bullish vs. Bearish Meaning
- 2 Why Is It Called Bullish vs. Bearish?
- 3 Bullish vs. Bearish Origin
- 4 Bull Market Meaning
- 5 Bullish vs. Bearish: Bear Market Meaning
- 6 Bullish vs. Bearish: Why You Need to Know the Difference
- 7 Bullish vs. Bearish Trading Strategies
- 8 What Does Bearish vs. Bullish Sentiment Mean?
- 9 Bullish vs. Bearish Indicators
- 10 Bullish vs. Bearish Candlestick Patterns
- 11 Is It Better to Buy Bullish or Bearish Stocks?
- 12 Trading Routines of Bullish vs. Bearish Traders
- 13 Can You Trade Both Bullish and Bearish Markets?
- 14 Will 2021 Turn into a Bear Market?
- 15 Conclusion
Bullish vs. Bearish Meaning
Bullish means there’s a general sentiment that a stock or market will trend upward. Traders can be bullish on a stock over the next few minutes, days, or years. It all depends on the setup!
Bearish is the opposite: People expect a stock or market to trend downward. Again, traders can be bearish on a stock for any time frame, depending on the setup.
You can often determine long-term bullishness or bearishness by fundamental analysis. Short-term bullishness or bearishness is often shown by technical analysis.
Why Is It Called Bullish vs. Bearish?
Bulls and bears … How did animals (with no financial experience) become financial terms? It’s because of how these real-life animals fight. Bulls thrust their horns up to attack, and bears swat their claws down to attack. Or so the story goes.
Bullish vs. Bearish Origin
These terms originated in medieval times when bulls and bears were used in sport fighting. Some folks preferred bears, and others, bulls. And they gambled tons of money on these cruel contests…
I’m glad gamblers these days bet on stocks instead! My friend and trading mentor Tim Sykes supports charities that help animals in similar situations. Check out his Karmagawa Foundation.
Over time, bulls and bears were linked to the market by fighting style. Bulls thrust prices higher and bears swat prices lower. The names stuck.
Bull Market Meaning
A bull market is defined as beginning when the market rallies 20% off its bear market lows. The bull market ends when the market drops 20% from its all-time highs.
How Does the Bull Market Work?
Most of the time, the U.S. stock market is in a bull market. Stocks tend to go up over time. That’s why long-term investors tend to hold stocks for years.
History of Bull Markets
Bull markets occur when the majority of investors are optimistic. Some examples:
- Reaganomics bull market of the 1980s
- Dot-com bull market of the 1990s
- Tech bull market of the 2010s
What Causes a Bull Market?
Bullish U.S. markets usually correlate to the growth of the American economy. Bull markets rally when businesses prosper. They also rally when interest rates are low and inflation accelerates.
Investors are bullish on a market, so they invest in it. More people are looking to buy than sell. So the price rallies and draws other investors in. This cycle continues, often ending up in a market bubble.
Are We in a Bull Market?
Yes. But not because of U.S. economic growth. Money printing — currency devaluation — and low interest rates have caused assets to rally. The current market doesn’t represent the U.S. economy. Negative economic numbers barely have an impact. Nothing dies in this market!
Bullish vs. Bearish: Bear Market Meaning
A bear market begins when the market drops 20% off its bull market highs. It doesn’t last more than a few years. Sometimes it’s only a few weeks, like we saw in 2020.
Bear markets don’t usually fall as smoothly as bull markets rise. They can be choppy and volatile on the way down.
There are bear market rallies that send the market soaring 5% or more in a day. These usually don’t last long. Dip buyers get shaken out when the market starts tanking again. Then the market plunges to new lows. The bear market’s over when the market rallies 20% from its lows.
Is a Bear Market Good or Bad?
Penny stock traders need to constantly adapt to the market. That’s why I don’t like short selling in this crazy bull market.
A bear market is only bad if you don’t know how to adapt your setups. I love this bull market, but I’ll gladly adapt to a bear market too. Maybe I’ll finally short-sell again…
A bear market is neither good nor bad … it’s what you make it!
Adaptable traders learn to adjust to bear markets. If you’re looking to be a more flexible trader, come join us in the SteadyTrade Team. I go live twice every day and walk you through insights that have taken me years to master. When you’re a beginner, it helps to have a team that keeps track of the market day after day. Sign up to join the team!
History of Bear Markets
Bear markets usually go along with recessions and poor economic conditions. A few examples:
- Great Depression bear market from 1929 to 1933
- Dot-com crash bear market from 2000 to 2002
- Great Recession bear market from 2007 to 2009
Does Bearish Mean Buy?
Most of the time, bearish means sell. The outlook isn’t good for the stock or the market in the specified time horizon.
I only focus on buying bullish setups. All the indicators have to point in the bullish direction.
I post a lot of bullish stocks in my weekly watchlist. I keep a close eye on them, waiting for them to make the moves I want. Sign up for it here — it’s free with your email.
What Sectors Do Well in a Bear Market?
Every bear market’s different … and it depends on what’s causing it. But there are usually a few common sectors to watch.
Bonds usually do well in a bear market. So do defensive stocks, like utilities. Short selling also works a lot better when the market’s weak.
How Do Bearish Traders Make Money?
They don’t…
Just kidding. The main way bearish traders make money is by short selling. But they have to pick their trades selectively. They never short the front side of the move and stop out quickly. While short selling is a valid strategy, it’s risky. It’s easier to go long, especially in an uptrending market.
Bullish vs. Bearish: Why You Need to Know the Difference
These are basic terms most traders know. Some traders will be bullish on a stock, and others will be bearish on the same stock!
Traders can be bullish on the market overall, but bearish on a sector. Or be bearish on a stock in the long run and also bullish in the short term.
Traders need to figure out a time frame over which they’re bullish vs. bearish.
The way I do this is through technical analysis.
I review the intraday and daily charts on StocksToTrade. StocksToTrade also shows a live news feed, so I never miss any catalysts. Get access to beautiful and responsive charts with a 14-day trial for $7 — or combine it with the Breaking News Chat add-on for $17.
Bullish vs. Bearish Trading Strategies
I think the best trading strategies are bullish. In the past year, we’ve seen many short sellers blow up their accounts. We saw tons of short squeezes in the first weeks of 2021. And I think we could see many more…
Short squeezes push bullish stocks even higher. And they can give longs more gains. I love buying the VWAP-hold high-of-day break pattern. More on VWAP later…
What Does Bearish vs. Bullish Sentiment Mean?
Bearish vs. bullish sentiment is investors’ collective opinion toward a certain stock or market.
Bullish sentiment means the majority of people in the market think prices will go up. Bearish sentiment means the majority think prices will go down.
Sentiment is split if the number of bulls is about the same as the number of bears.
Bullish vs. Bearish Indicators
How can you tell if a stock is bullish or bearish?
Bullish stocks tend to be those that rally and show recent strength. Ideally, they have lots of volume and make new highs on news. Here are some of the bullish indicators I use:
- 52-week highs
- Breakouts
- Very high volume
- Amazing news
- Price holding above VWAP
Bearish stocks tend to be weak and have recently been one-and-dones. (That’s when a stock starts strong in the morning but closes lower). Or they’re super overextended and due for a pullback. Steven Johnson — one of my awesome co-hosts on the SteadyTrade podcast — loves short selling this setup.

VWAP
Volume-weighted average price (VWAP) is critical to my trading. It shows up on the intraday chart. It indicates whether bulls or bears are in control. If the price is above VWAP, longs are more profitable than shorts. If the price is below VWAP, shorts are more profitable than longs.
Stocks that hold over VWAP will be bullish in the short term.
Traders use VWAP in combination with other bullish indicators to confirm their thesis. I use it for my VWAP-hold high-of-day break pattern. If a stock has been holding above VWAP all day and it’s after 2 p.m., that’s a very bullish indicator. I’ll buy it if it has other bullish indicators too.
Bullish vs. Bearish Candlestick Patterns
The trend can indicate whether a stock is bullish or bearish. But candlestick patterns offer additional indicators for price action.
Bearish candles can indicate a reversal in a bullish trend. And bullish candles can indicate a reversal in a bearish trend.
Bullish Candlestick Patterns
The Hammer
The hammer is a single candlestick with a tiny body and a long lower wick.
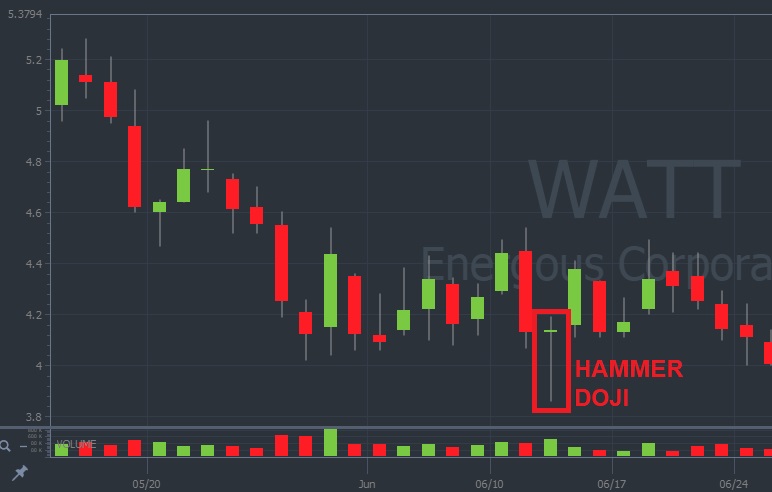
Energous Corp. (NASDAQ: WATT) hammer pattern chart (Source: StocksToTrade)
Morning Star
The morning star is formed with three candlesticks. The first candle is a big red one. The second is a tiny candle that’s lower than the first one. The third candle is a big green candle.
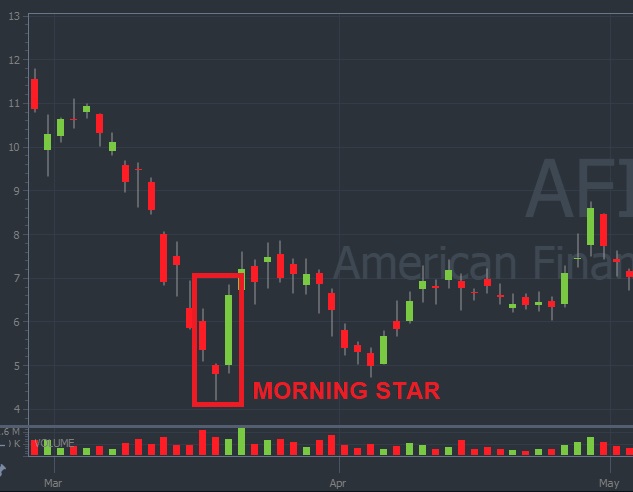
American Finance Trust Inc. (NASDAQ: AFIN) morning star pattern chart (Source: StocksToTrade)
Piercing Line
The piercing line is formed with two candlesticks. The first candle is a big red one. The second is a green candle that opens below the first but retraces at least 50% of the first candle.
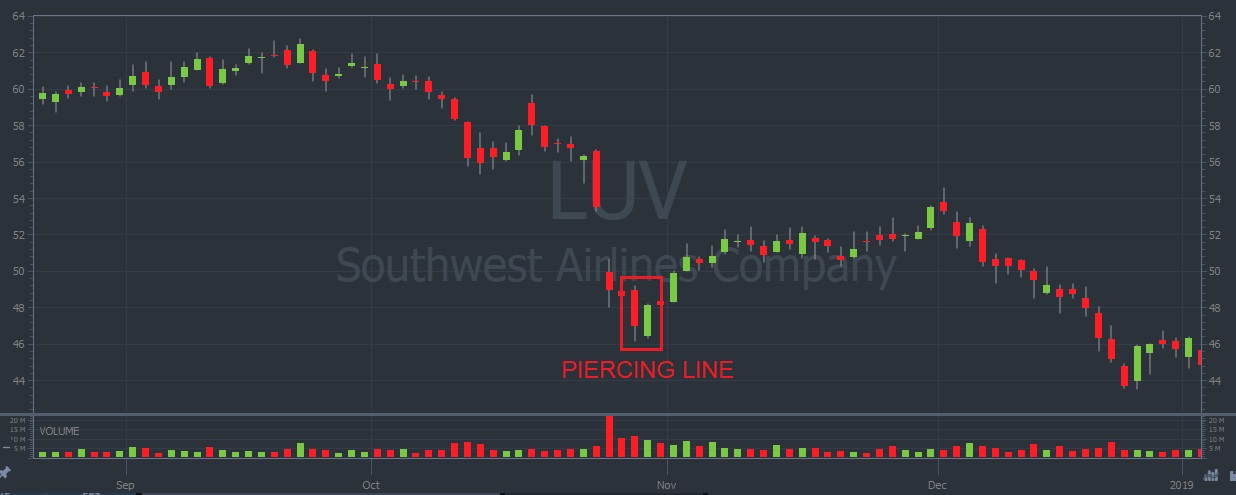
Southwest Airlines Company (NYSE: LUV) piercing line pattern chart (Source: StocksToTrade)
Three White Soldiers
The three white soldiers pattern is three big green candles in a row.
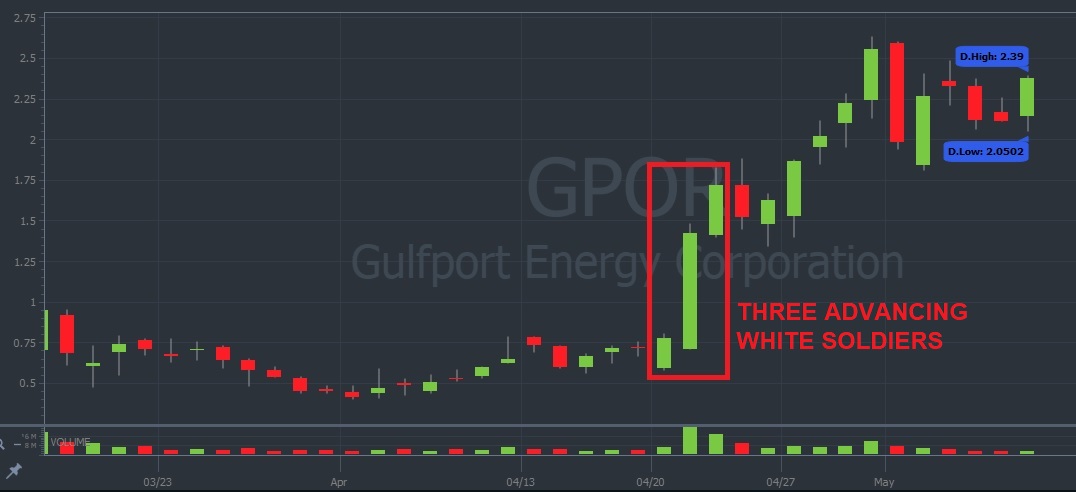
Gulfport Energy Corp. (NASDAQ: GPOR) three white soldiers pattern chart (Source: StocksToTrade)
Abandoned Baby
The abandoned baby is formed with three candles. The second candle opens far below the first and last candles.
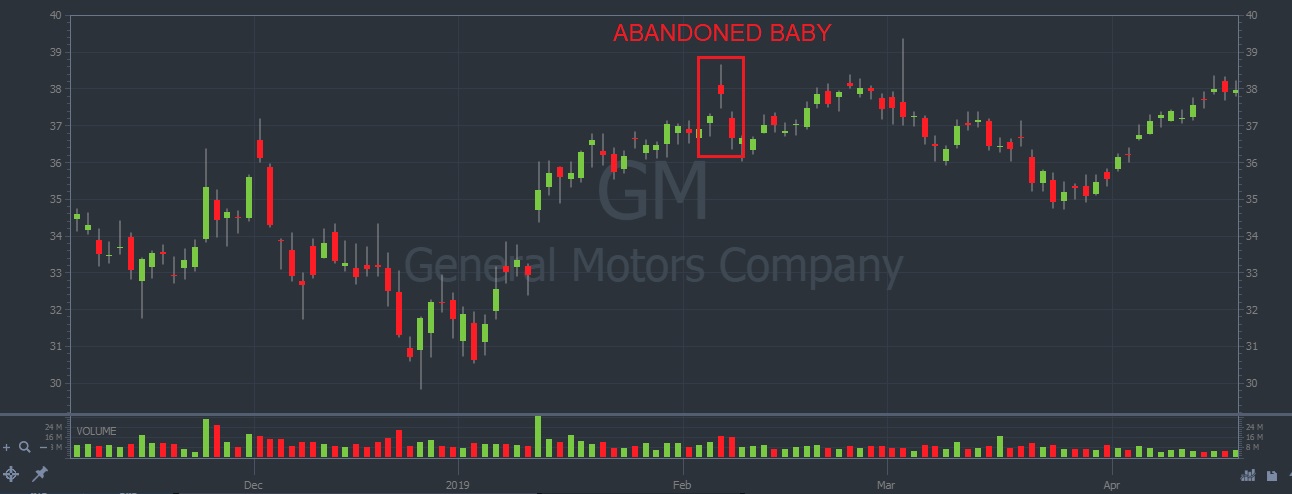
General Motors Company (NYSE: GM) abandoned baby pattern chart (Source: StocksToTrade)
Three Line Strike
The three line strike is formed with four candles. Each of the first three candles closes above the last candle. The fourth candle opens above the third candle but closes below the first candle.
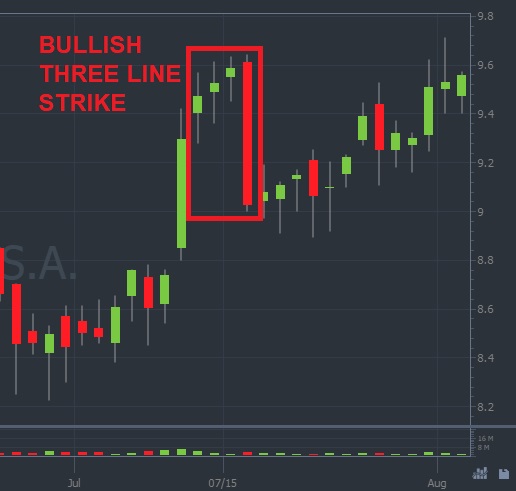
Grupo Televisa S.A. (NYSE: TV) three line strike pattern chart (Source: StocksToTrade)
Bearish Candlestick Patterns
Shooting Star
The shooting star is a single candlestick with a tiny body and a long upper wick.
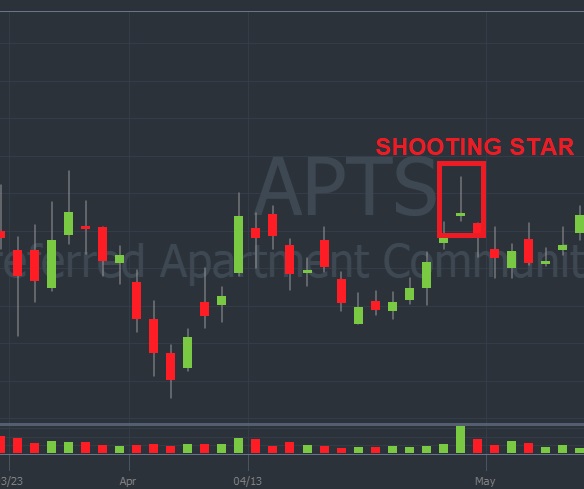
Preferred Apartment Communities Inc. (NYSE: APTS) shooting star pattern chart (Source: StocksToTrade)
Evening Star
The evening star is formed with three candlesticks. The first candle is a big green one. The second is a tiny candle that’s higher than the first one. The third candle is a big red candle.
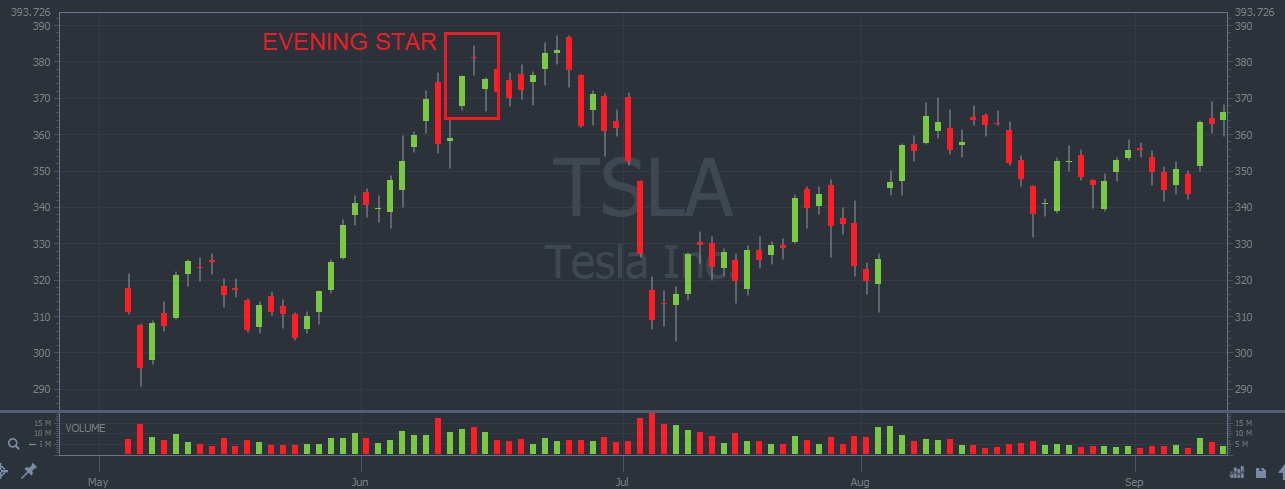
Tesla Inc. (NASDAQ: TSLA) evening star pattern chart (Source: StocksToTrade)
Three Black Crows
The three black crows pattern is three big red candles in a row.
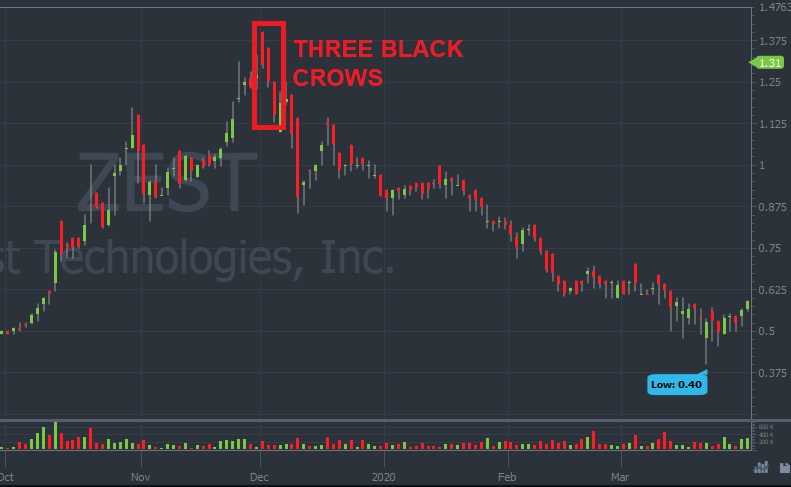
Ecoark Holdings Inc. (OTCQB: ZEST) three black crows pattern chart (Source: StocksToTrade)
Two Black Gapping
Three candlesticks form the two black gapping. The first candle is green. The second is red and opens above the first candle’s close. The third candle is red and opens above the second candle’s open, but closes below the second candle’s close.
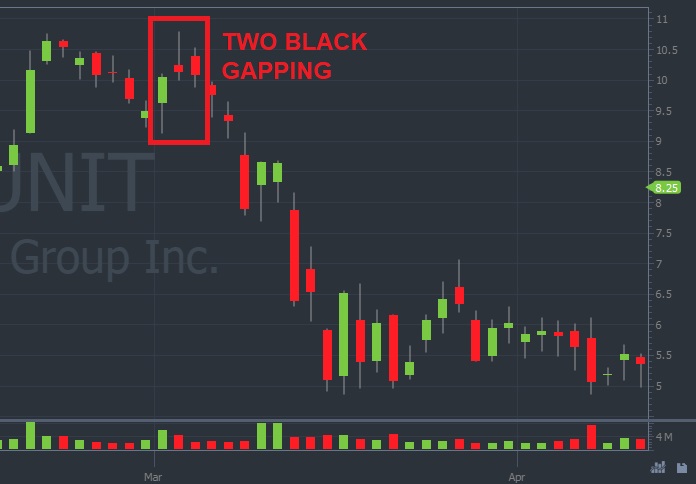
Unit Group Inc. (NASDAQ: UNIT) two black gapping pattern chart (Source: StocksToTrade)
Is It Better to Buy Bullish or Bearish Stocks?
I like to focus on bullish stocks. Buying stocks that have already been bullish is easier in this short-squeezing market. Chasing is being rewarded. But be cautious! When market conditions change, chasing will lead to losses.
Buying bearish stocks isn’t what I do in penny stock land. Sometimes I buy a dip, but that’s it.
Many traders in this niche are buying the worst companies. It’s not worth buying a downtrending stock in hopes of a reversal. There’s a great chance it’ll just go lower. So, my thinking in regards to buying bearish stocks is … avoid, avoid, avoid!
Trading Routines of Bullish vs. Bearish Traders
Bullish traders look for big percent gainers with great news. The stock has to have huge volume. Ideally, there’s also a breakout and the price is holding above VWAP.
Bearish traders look for weak companies that are overextended or running on fluff news. They prefer lower volume because longs are less interested. Short sellers get in once the stock shows bearish indicators, like price holding under VWAP.
Can You Trade Both Bullish and Bearish Markets?
Yes! You have to be flexible. Trade bullish in a bullish market, and adapt when the market becomes bearish.
Will 2021 Turn into a Bear Market?
There’s no way to be sure what this crazy market will do next. While we’re overextended going into the year, the money printing isn’t stopping soon. We’ve seen many hot sectors in the past year taking off — Bitcoin, EV, NFTs, and battery plays…
That said, you gotta be prepared for anything.
Conclusion
The concepts of bullish vs. bearish sentiment are pretty straightforward. But there’s more to them than meets the eye. You can be bullish or bearish a market, stock, or indicator. You can be bullish on a stock for the day, but bearish for the long term.
Knowing these details can help you in your trading journey. When you’re ready to take your market know-how to the next level, come join the SteadyTrade Team. It’s where you can find mentorship, a community, and tons of education to help you hone your own strategy, whether it’s bullish or bearish.
Is there a stock you’re bullish or bearish? Will this bull market keep running or is a bear market lurking? Leave a comment below!