
Bull Flags represent one of the most powerful and dynamic patterns in trading, signaling continuation in an uptrend. Recognized by a distinct flagpole and consolidation phase, this pattern offers traders actionable insights and clear entry points.
Read this article because it goes in-depth on trading bull flag setups, providing traders with actionable insights and clear strategies.
I’ll answer the following questions:
- What is a bull flag?
- Is a bull flag bullish or bearish?
- What characterizes a bull flag formation?
- How do descending and wedge bull flags differ?
- What strategies should traders use for bull flag setups?
- How can traders identify a successful bull flag setup?
- What indicates a failed bull flag pattern?
- How should bull flags be interpreted in different markets?
Let’s get to the content!
Table of Contents
- 1 What Is a Bull Flag?
- 2 Anatomy of a Bull Flag
- 3 How to Trade Bull Flag Strategies and Setups
- 4 How to Identify a Failed Bull Flag
- 5 How to Interpret Bull Flags in Different Markets
- 6 Key Takeaways
- 7 Frequently Asked Questions
- 7.1 How Accurate Is a Bull Flag Pattern in Predicting Market Movements?
- 7.2 How Do Traders Differentiate Between a True and a False Bull Flag?
- 7.3 What Are the Best Practices for Trading Bull Flags in Volatile Markets?
- 7.4 How Does Price Analysis Help Identify Bull Flag Patterns?
- 7.5 What Role Does Trading and Momentum Analysis Play in Confirming Bull Flags?
- 7.6 How Can Indicator Analysis Augment the Identification of Bull Flag Patterns?
What Is a Bull Flag?
A Bull Flag is a powerful pattern seen on price charts, indicative of a continuation in an uptrend following a brief period of consolidation. This pattern is easily recognizable by its initial sharp rise in prices, forming the ‘flagpole,’ followed by a more moderate downward or sideways price movement, creating the ‘flag’ itself. This formation is particularly interesting in stocks showing strong upward momentum, as it suggests that after a pause, the bullish trend is likely to resume.
In my teaching experience, I emphasize the importance of this pattern, as it combines elements of price movement analysis, volume analysis, and risk management to pinpoint potential entry points with favorable risk-reward ratios.
Is a Bull Flag Bullish or Bearish?
Without a doubt, the Bull Flag is a bullish pattern. It signals that the market’s bullish momentum is strong enough to take a breather (consolidation phase) before prices move even higher. The Bull Flag becomes a crucial indicator for traders to assess bullish price movements within a bullish market, offering a strategic opportunity to capitalize on the continuation of an uptrend.
However, it’s vital to employ stop-loss orders and conduct thorough support and resistance analysis to safeguard against the inherent risks of trading, as not every Bull Flag formation leads to the expected breakout. Properly analyzing these patterns involves recognizing the consolidation break, understanding the underlying volume and momentum indicators, and, most importantly, knowing that even the most bullish patterns can face bearish market turns. Thus, risk management analysis becomes an indispensable part of trading Bull Flags, ensuring traders are prepared for both bullish continuations and unexpected bearish price movements.
Anatomy of a Bull Flag
The Bull Flag formation is a classic example of a continuation pattern observed in bull markets. It begins with a strong upward movement in price, known as the flagpole, indicating a surge in flagpole strength. This movement is a clear demonstration of bullish momentum.
Following this initial surge, the stock enters a consolidation phase, forming the flag. This phase is characterized by a slight downtrend or sideways movement in price, represented by parallel resistance and support lines that resemble a flag. This consolidation channel is crucial as it reflects a period of pause after a significant price movement, where the price action stabilizes before potentially continuing the initial bull trend. Analysts and traders closely monitor this phase, using tools like trendlines and moving averages for insights into the market behavior and potential price breaks.
Characteristics of a Bullish Flag
Bull Flags feature a sharp price increase (the flagpole), followed by a period of consolidation that forms the flag. This consolidation is characterized by lower volumes, indicating a pause rather than a reversal of the trend.
Moving averages help smooth out price data to provide a clearer view of the trend direction and can be pivotal in identifying the flag and flagpole formation. But with various types of moving averages available, choosing the right one can significantly impact your trading strategy’s effectiveness. To optimize your bull flag trades and enhance your technical analysis skills, understanding which moving average works best for day trading is a step you cannot skip. Learn more about selecting the right moving average for your trading style at best moving average for day trading.
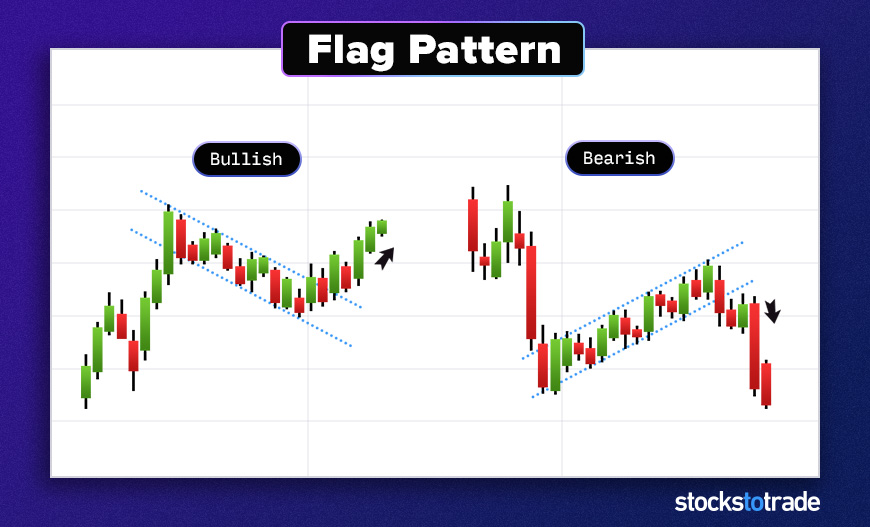
Descending vs. Wedge Bull Flags
The main difference between descending and wedge Bull Flags lies in their consolidation shapes. Descending flags have parallel trend lines that slope down, while wedge flags converge, creating a narrowing pattern. Both indicate potential bullish continuations but may offer slightly different entry and exit points.
How to Trade Bull Flag Strategies and Setups
Trading Bull Flag strategies involves identifying the completion of the flag formation and preparing for a potential breakout. The key is to wait for the price action to break above the resistance level of the flag, signaling a continuation of the initial uptrend.
This breakout point is often accompanied by increased volume, serving as a confirmation of the pattern breakout. Setting a price target based on the flagpole surge height and employing stop-loss orders just below the flag’s support level can help manage risks and secure profits.
Swing trading tactics are often applied here, utilizing candlestick formations and momentum indicators to time the entry and exit points optimally.
Technical analysis, including chart patterns analysis and price trend evaluation, plays a vital role in executing Bull Flag trades successfully.
Here’s a solid strategy: Momentum trading involves identifying stocks moving with strength in one direction and capitalizing on that movement until the momentum starts to fade. This approach complements the bull flag pattern, as both rely on recognizing and acting on strong market trends. To refine your approach to bull flag setups and enhance your overall trading performance, incorporating momentum trading strategies can provide a significant edge. For comprehensive insights into momentum trading, including how to identify opportunities and manage risks, visit our article on momentum trading strategies.
Example of Successful Bull Flag Setups
Successful Bull Flag trades often feature a clear, strong flagpole followed by a well-defined consolidation phase. Entering the trade at the breakout point and setting stop-loss orders just below the lower trend line of the flag can optimize risk-reward ratios.
It’s essential to place the Bull Flag setup within the broader context of trend trading strategies. Trend trading is a fundamental approach that seeks to capitalize on the momentum of market directions, whether up or down. The bull flag is just one piece of the puzzle, fitting into a larger strategy that involves identifying and following the market’s direction over time. To truly excel in day trading, expanding your toolkit to include a variety of trend trading strategies is crucial. For an in-depth exploration of trend trading and how to leverage it for better trading outcomes, check out our article on trend trading strategy.
How to Identify a Failed Bull Flag
Not all Bull Flag formations lead to a successful continuation of the uptrend. A failed Bull Flag occurs when the price breaks down below the flag’s support line instead of breaking out upward. This breakdown may signal a change in market sentiment, possibly indicating the start of a bear trend or a more significant pullback.
Identifying a failed Bull Flag early is crucial for risk management, allowing traders to cut losses and reassess their positions. Key indicators of a failed pattern include a lack of volume support during the supposed breakout, bearish candlestick formations within the flag, and the price moving contrary to the expected direction after breaking the consolidation channel. Risk analysis and management strategies become essential in such scenarios, highlighting the importance of stop-loss orders and the reevaluation of price targets and resistance levels.
How to Interpret Bull Flags in Different Markets
Interpreting Bull Flags requires a nuanced understanding of price patterns and market conditions. In different markets, the Bull Flag tells a story of potential breakouts following a period of consolidation. For instance, in the stock market, a Bull Flag might signal an impending price move upwards if accompanied by increasing volume—a key volume indicator of strength. This pattern suggests that despite recent price consolidation, underlying bullish sentiment remains strong, pushing against price resistance levels.
Risk management is crucial when interpreting Bull Flags, as not all patterns lead to successful breakouts. Traders often use stop-loss orders to protect against potential reversals that breach support levels. Additionally, price chart analysis tools can provide deeper insights into price movements, helping to distinguish between true Bull Flags and false signals. My approach emphasizes careful analysis of price support, resistance levels, and volume indicators to gauge the likelihood of a continuation in the bullish trend, always with a clear risk warning to remind traders of the potential for loss.
What Does a Bull Flag Tell You in Real-Time Trading?
In real-time trading, a Bull Flag can be a critical indicator for traders, signaling an opportune moment for profit-taking or entry into a bullish market. This pattern, characterized by a sharp price breakout from consolidation, often suggests that the market’s momentum is likely to continue in the direction of the initial surge, presenting a favorable risk-reward scenario for bullish traders. However, the strategy involves inherent risks, and the savvy trader will look for additional confirmation through chart analysis, breakout analysis, and other financial analysis tools.
Effective trading on Bull Flag patterns also involves monitoring price levels closely, using indicators and analysis to confirm the breakout’s strength before committing to a trade. Stop-loss orders are strategically placed to manage risks if the market moves against the anticipated direction. The real-time interpretation of Bull Flags, combined with rigorous market analysis, stock analysis, and trend analysis, enables traders to make informed decisions, capitalizing on bullish momentum while guarding against the downside.
Key Takeaways
- Bull Flags are bullish continuation patterns marked by a strong initial rally and a period of consolidation.
- Recognizing and understanding the nuances of Bull Flag patterns can significantly enhance trading strategies.
- Successful trading of Bull Flags involves precise timing for entry and exit, with careful consideration of stop-loss placements to manage risk.
There are a ton of ways to build day trading careers… But all of them start with the basics.
Before you even think about becoming profitable, you’ll need to build a solid foundation. That’s what I help my students do every day — scanning the market, outlining trading plans, and answering any questions that come up.
You can check out the NO-COST webinar here for a closer look at how profitable traders go about preparing for the trading day!
Are bull flag patterns part of your toolkit? Write “I won’t trade without a plan” in the comments if my advice has taken hold!
Frequently Asked Questions
How Accurate Is a Bull Flag Pattern in Predicting Market Movements?
While no pattern can guarantee future market movements, Bull Flags are considered one of the more reliable indicators of trend continuation, especially when confirmed by high trading volumes on the breakout.
How Do Traders Differentiate Between a True and a False Bull Flag?
True Bull Flags follow a strong flagpole and show decreasing volume during consolidation. False flags may lack a clear pole, show erratic consolidation, or have increasing volume in the flag, suggesting a lack of consensus among traders.
What Are the Best Practices for Trading Bull Flags in Volatile Markets?
In volatile markets, it’s crucial to wait for clear breakout signals, use stop-loss orders to manage risk, and adjust profit targets based on current market volatility to maximize the chances of successful trades.
How Does Price Analysis Help Identify Bull Flag Patterns?
Price analysis involves examining historical price moves and patterns to forecast future market behavior. In identifying a bull flag pattern, traders closely analyze the price’s upward movement followed by a consolidation phase, signaling potential continuation of the trend. This analysis is crucial for distinguishing between bullish continuation patterns and risky setups that may appear similar but have different implications, such as bearish patterns.
What Role Does Trading and Momentum Analysis Play in Confirming Bull Flags?
Trading analysis, alongside momentum analysis, plays a pivotal role in confirming bull flag patterns. Traders use trading analysis to evaluate the volume and price action during the formation of the flag, looking for signs of consolidation without significant volume, which suggests that the trend may resume. Momentum analysis further confirms the strength behind the move, ensuring the pattern isn’t weakening and that the initial price move has the backing to continue once the flag is broken.
How Can Indicator Analysis Augment the Identification of Bull Flag Patterns?
Indicator analysis augments the identification of bull flag patterns by providing additional layers of confirmation through technical indicators. Indicators such as moving averages, RSI (Relative Strength Index), and MACD (Moving Average Convergence Divergence) can help traders assess the market’s momentum and the potential for the continuation of the trend after a bull flag pattern. This analysis is essential for distinguishing genuine bull flag opportunities from setups that may appear promising but lack the technical backing to be considered low-risk trading opportunities.