
Smart traders know key patterns — and the bull flag pattern can be a crucial momentum indicator.
One of the great things about trading low-priced stocks is that we often see patterns repeat. I say it all the time: “Look for the pattern.” So today, I’ll break down the bull flag pattern.
It’s been used for ages in forex trading. And now it’s commonly used by all kinds of traders. It’s very common in intraday trading in the penny stock world.
What should you look for to spot these fast movers? Read on to learn what the bull flag pattern is, how to use it, and real-world examples.
Table of Contents
What Is the Bull Flag Pattern?
The bull flag is an easy-to-learn pattern that shows a lull of momentum after a big rally. It consists of a strong rally followed by a small pullback and consolidation. A follow-up rally is likely when combined with other bullish indicators.
And the rally needs high volume. A line connects the peaks of all the rally candles that form the flagpole.
After the initial run, the stock pulls back and consolidates on lower volume. If you draw trend lines on the chart, the consolidation boundaries form a flag. You draw these around the top and bottom of the consolidation.
Don’t worry, we’ll look at some examples in a bit so it’s really clear.
On a heavily shorted stock, the dip is due to longs locking in profits and shorts shorting more.
After the pullback, the stock starts to gain volume and rally for another leg up. When measuring from the bottom of the flag, the size of the follow-up rally is usually the same as the length of the pole. It’s smart to take some profits sooner, especially if the initial rally was strong.
A bull flag can create a bear trap. That’s because shorts think the price will drop. Instead, it squeezes and forces shorts to cover. Longs also jump in when they see the stock rallying further.
That’s the pattern in a nutshell…
There are a few variations on the classic bull flag pattern. They all feature strong momentum followed by a consolidation period. But they’re different enough to have their own categories.
Bear Flag Pattern
The counterpart of a bull flag is a bear flag. This pattern is the inverse of the bull flag. This looks more like a hockey stick than a flag to me…
With a bear flag, there’s a strong drop in price on large volume. That’s followed by a small peak and consolidation on low volume.
Once large volume comes back and starts pushing the stock further down, that could be the time to short sell. Ideally, you pair this with another technical or fundamental indicator — like the first red day after a runup or news of an offering.
Flat Top Breakout Pattern
A flat top breakout is a bull flag that consolidates sideways instead of pulling back.
If you draw trend lines around it, it looks like a rectangle. You can play this setup like a bull flag. The sideways consolidation tends to be more bullish than a bull flag … It doesn’t pull back as much.
Pennant Pattern
The pennant is another variation of the bull flag. It’s similar … but the top and bottom trend lines meet at a point. That forms a triangle flag or pennant.
Pennants can be trickier to play than bull flags as they merge into a point. But as with the bull flag, wait for the volume to spike again with the next leg of the rally.
Note that while we put the bear flag in a separate section, the flat top and pennant patterns can also be flipped to form bearish indicators. Keep reading to see examples of these patterns in action.
Trading Breakouts with Bull Flag Patterns
You can use bull flags to find entry opportunities on high-momentum stocks. But pair them with other technical or fundamental indicators. That could be a multi-month breakout, a new contract, or an FDA approval, earnings, or other strong catalyst…
Ideally, you have multiple indicators lining up.
If you feel like you missed a quick rally or a breakout, a bull flag can open up another entry opportunity. Especially if it pulls back down to the breakout level.
Trading the bull flag after a breakout can be better than buying the breakout itself. Now let’s look at…
Bull Flag Pattern Rules
Here we’ll look at the bull flag as it applies to intraday momentum trading. But you can also apply this pattern to longer time frames like daily charts.
When you’re trading the bull flag, stay disciplined. Let the chart play out into the pattern. Wait for the setup. Don’t jump into a simple pullback. A stock may pull back — but not form a flag and rally. Don’t get FOMO and chase it!
It can be tempting to try to get a headstart on your trade, but make sure you wait for a clear entry signal. Let the pattern form and watch it consolidate into a flag. When it’s clear, you can enter when the volume spikes and the stock looks like it can rally again.
Only trade the first bull flag. This is especially important for newbies. Trading the second and third bull flag can be tricky. Once you find consistency trading the first bull flag rally, you can start branching out. Your experience will guide you.
Wanna practice? Try paper trading the patterns first.
How to Plan a Trade Using Flag Patterns
Sometimes a bull flag won’t work out as you want or expect. You gotta have an exit plan in place. This is so important.
Many traders are convinced their trade has to work — they don’t include an exit in their trading plan. Always prepare to cut losses.
Traders who fail to plan plan to fail.
A common exit plan on a bull flag pattern is to place your stop at the lowest part of the flag after you enter on its volume peak. And when you decide to exit there, make sure to follow through. If that’s tough to do, put a hard stop there.
Your exit target is the length of the flagpole added to the bottom of the flag.
Bull Flag Pattern Chart Examples
Here are a few bull flag patterns. A chart is worth a thousand words, so it’s super helpful to view examples of these setups in action.
Every bull flag pattern will be slightly different. Not all will be successful. But remember, this isn’t an exact science … That’s why you need a solid stop loss in place.
Bull Flag Pattern
Waitr Holdings Inc (NASDAQ: WTRH) was a recent spiker that got knocked back down to its lows. When it started to run again one afternoon, it came back on many traders’ screeners.
Let’s look at the chart:
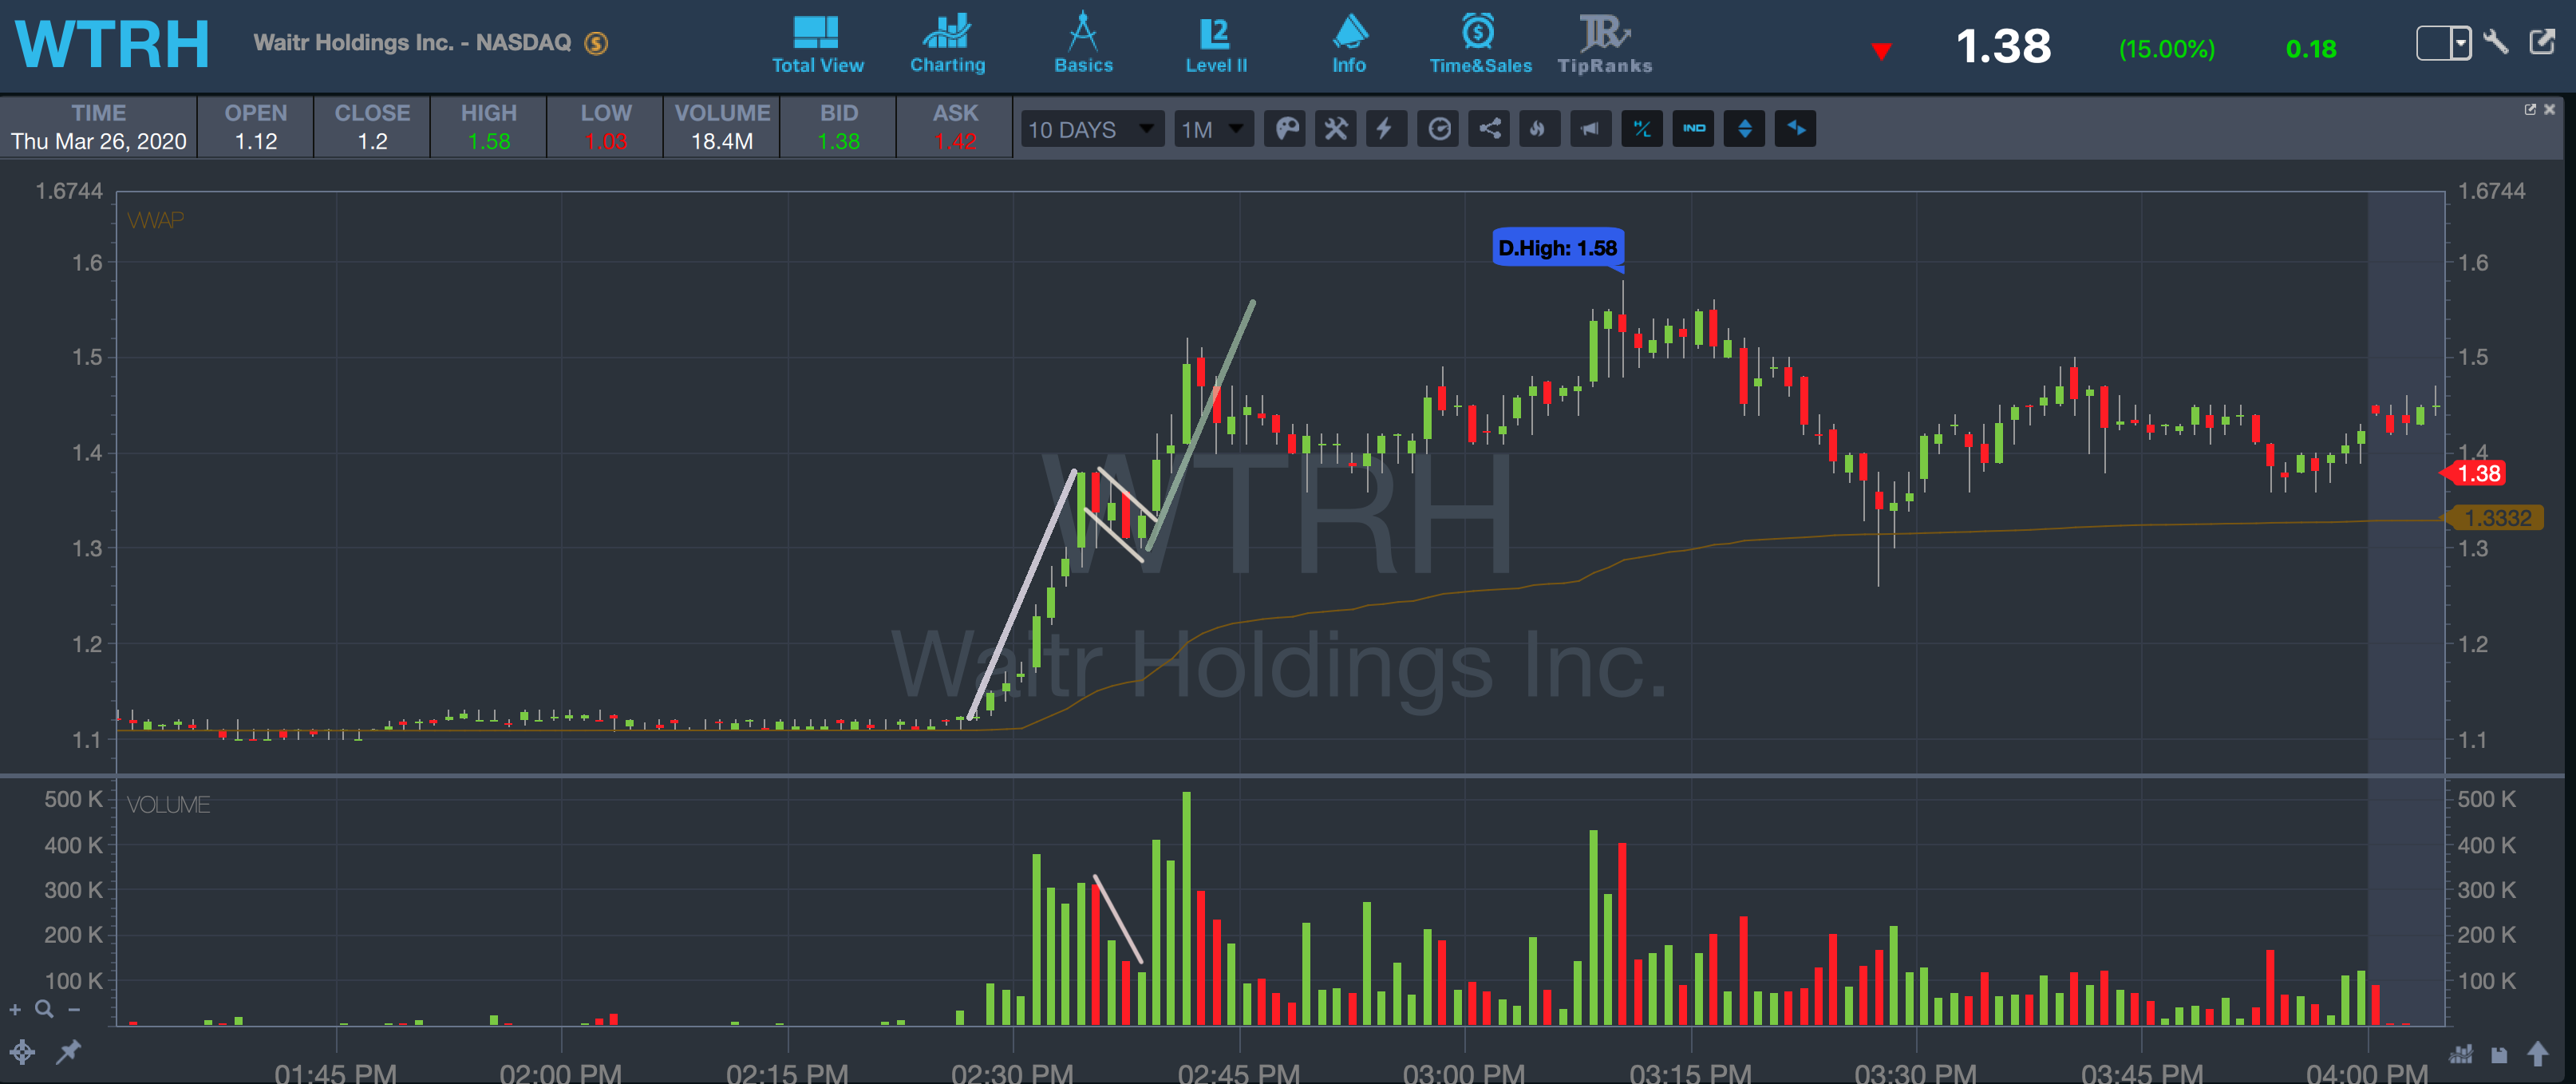
Waitr Holdings Inc. (NASDAQ: WTRH) bull flag pattern chart (Source: StocksToTrade)
Here we see an initial run on increasing volume. That’s followed by a consolidation period where volume drops off substantially and the stock pulls back.
Once we see the first large candle and the stock rise again, we can buy under $1.40, placing our stop loss below $1.30. Then we prepare for another run. We shift the first flagpole to the bottom of our flag to estimate the target. In this case, it’s in the mid $1.50s.
It’s best to trade scared and lock in profits earlier.
The initial run here fails to immediately hit the target. But after some more sideways consolidation, it hits our profit target.
Let’s look at the pattern on the flip side…
Bear Pennant Pattern
Alkido Pharma Inc (NASDAQ: AIKI) was a typical failed spiker. Even on great news, it usually spiked during premarket and the morning but failed to hold its gains into the close. Short-sellers love this type of play. This day was no different.
Check out the action on the chart:
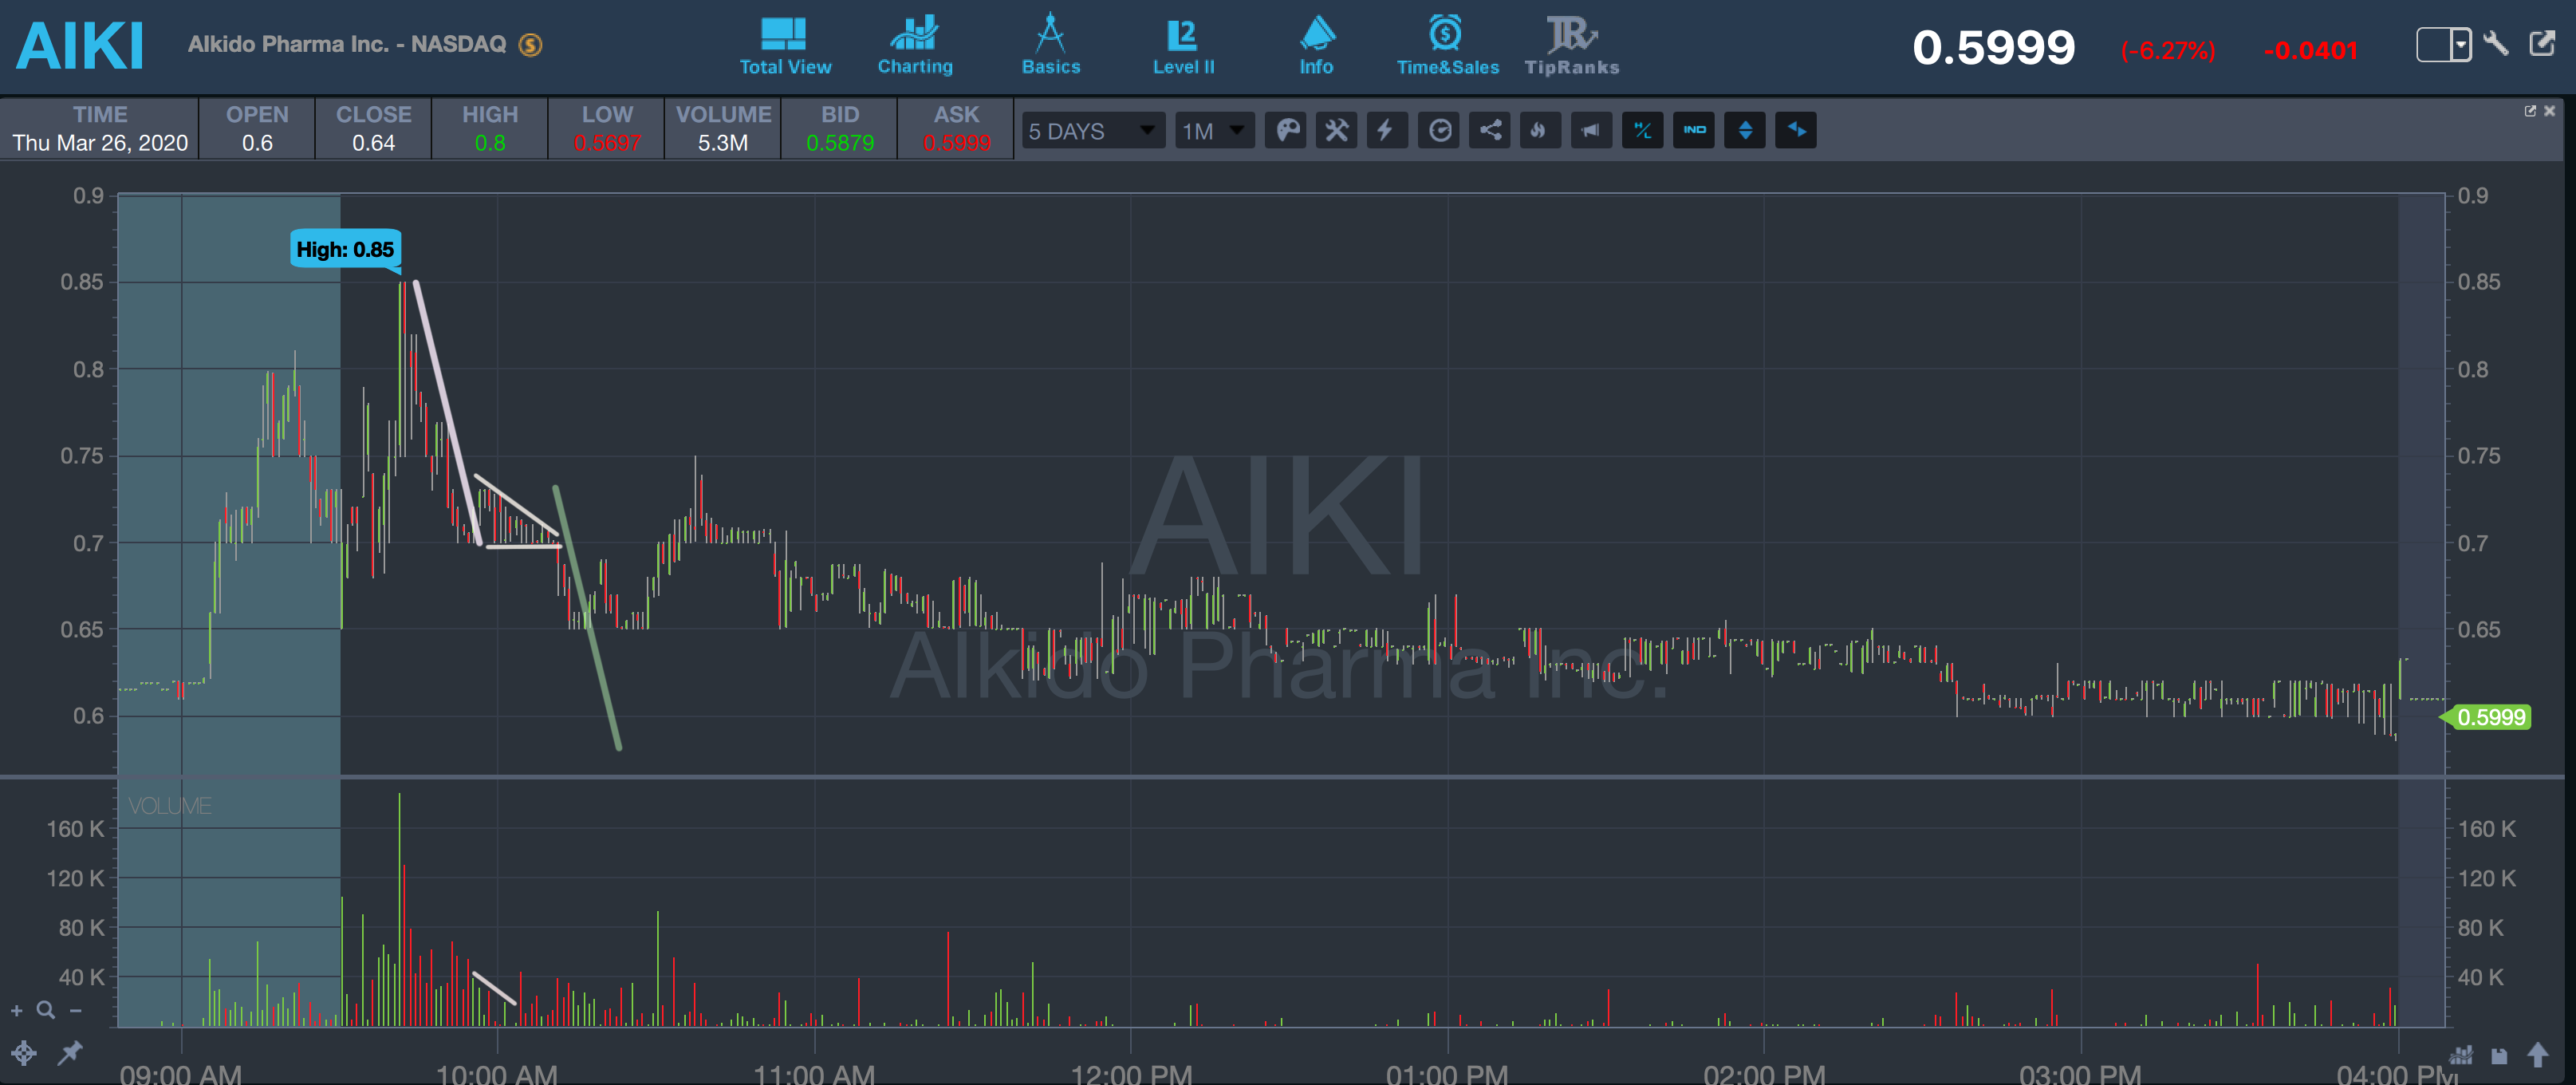
Alkido Pharma Inc. (NASDAQ: AIKI) bear pennant pattern chart (Source: StocksToTrade)
AIKI spiked in the morning but quickly pulled back. It formed a pennant after its low volume consolidation period. Then it was the time to strike.
The short sell entry was around 70 cents when the volume started to come back. The stop would’ve been at 75 cents, just above the pennant.
The flagpole gave a target of under 60 cents, which would have been eventually reached at the end of the day as the stock slowly faded.
We’ve seen two great setups so far … Now, how about a setup that should work, but doesn’t?
Flat Top Breakout Pattern
Astrotech Corporation (NASDAQ: ASTC) was a strong percent gainer in the morning. It’s typically a failed spiker. But the incredible volume in the morning made it very likely to short squeeze.
Check out the chart first, then I’ll break it down:
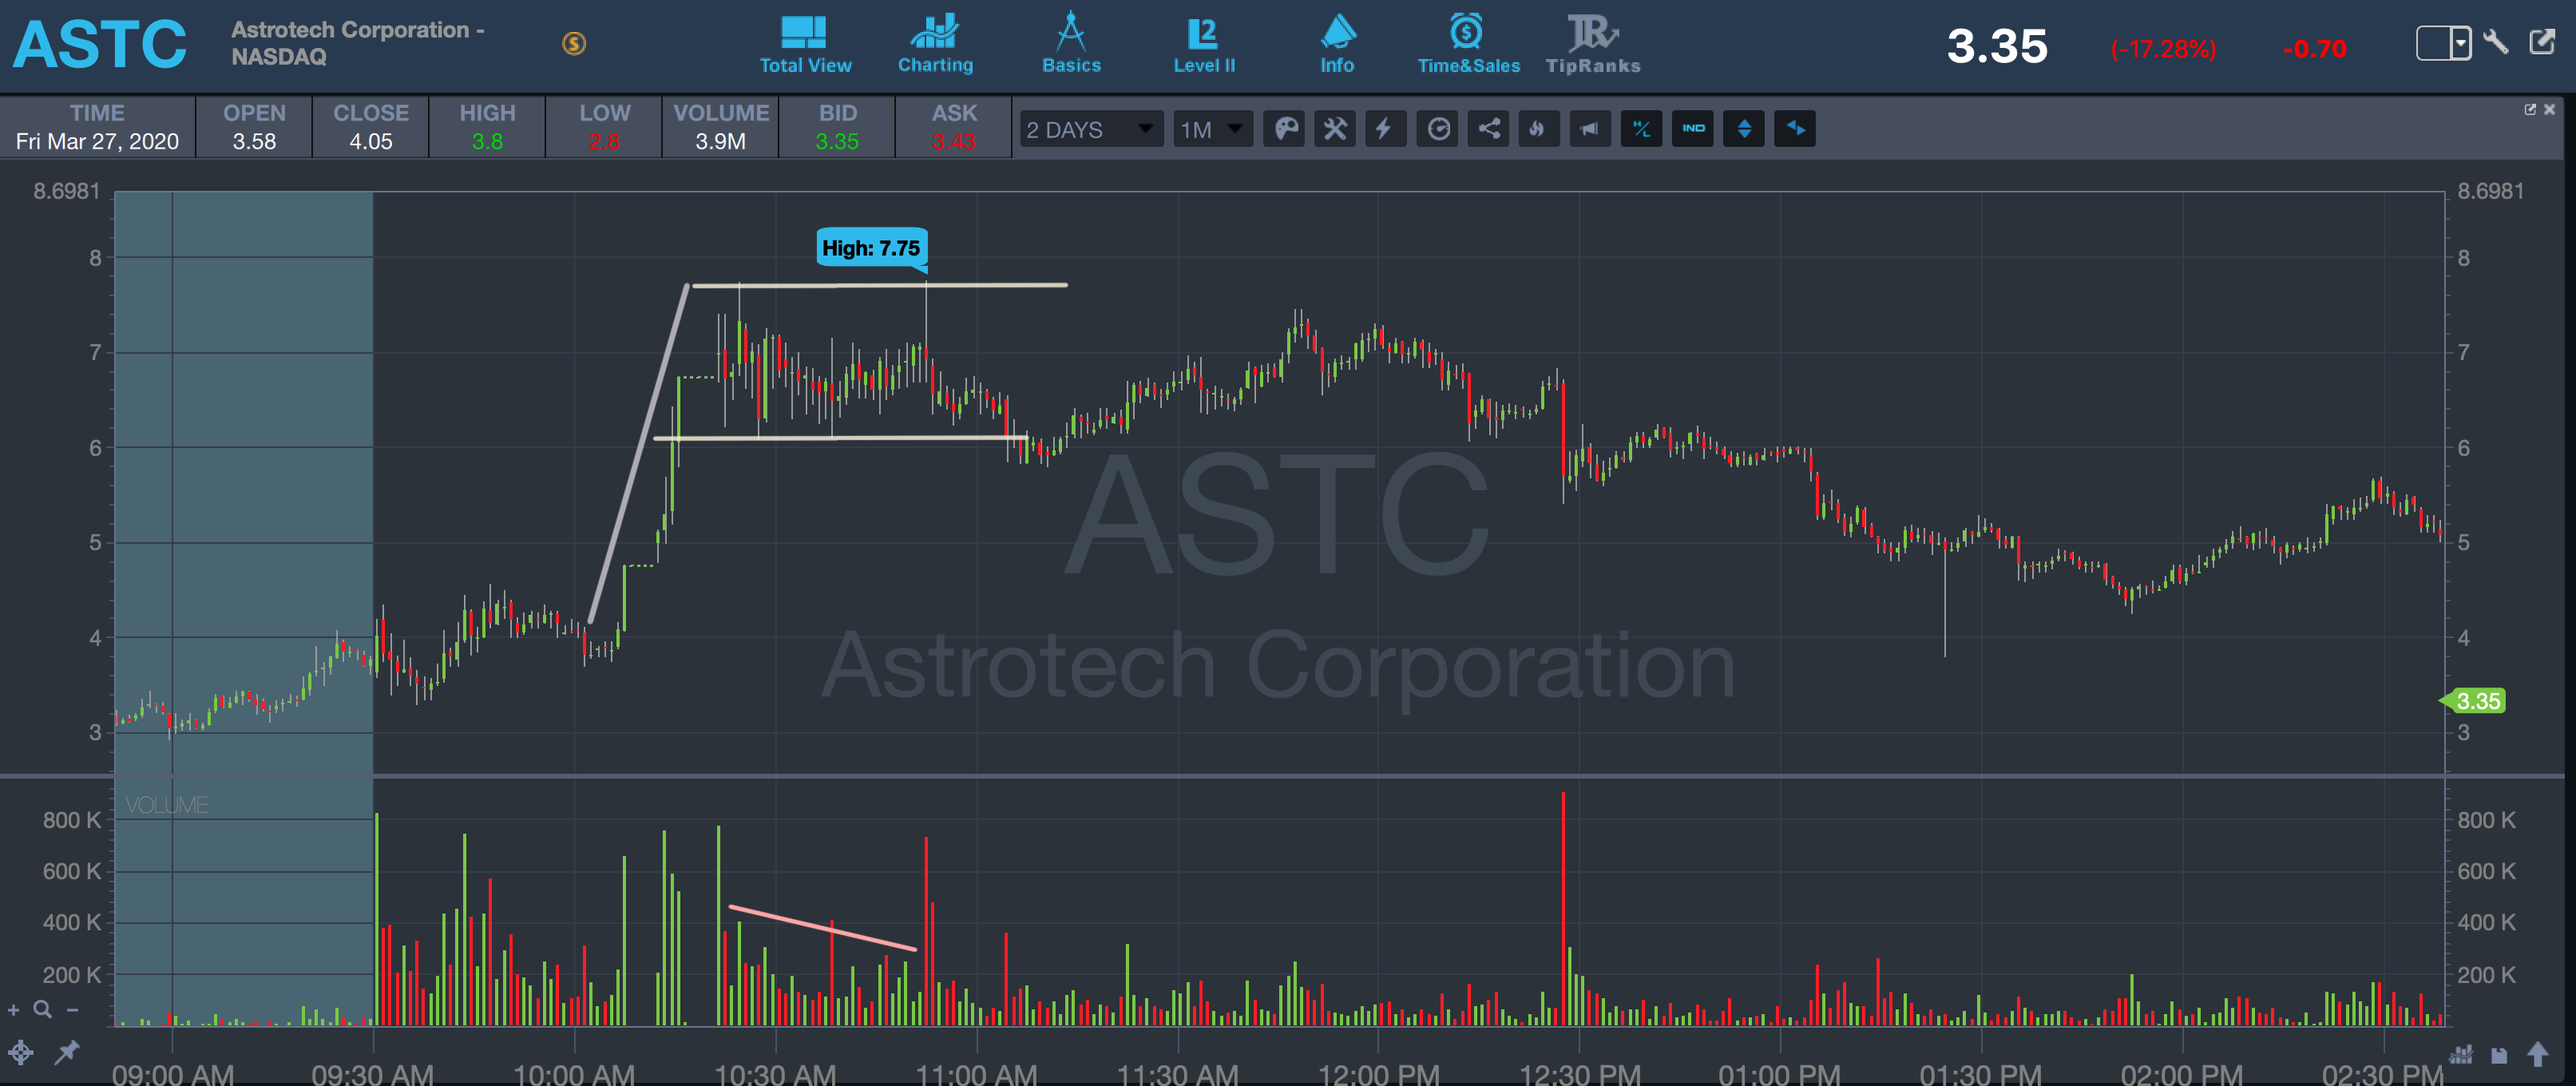
Astrotech Corporation (NASDAQ: ASTC) flat top breakout pattern chart (Source: StocksToTrade)
Here we see ASTC gain massive volume and double its price in under 20 minutes. After a period of sideways consolidation, it seems like it could squeeze for another leg up…
As it picks up volume, the top part of the consolidation would be an ideal entry at around $7.70. The stop would be at the bottom of the consolidation at $6.
This turned into a double top, however. And after the fakeout, it fizzled out and cracked under the stop. All you can do here is cut losses quickly. While conditions weren’t perfect for this setup, we’ve seen similar stocks have massive short squeezes recently.
In a hot market, a flat top breakout is worth a shot … as long as you remember to cut those losses.
Using the bull flag pattern and its variations can help you trade smarter. But remember to use it in combination with other indicators.
Have more trading questions? We have plenty of resources here on the StocksToTrade blog, and we explore all things trading on the SteadyTrade podcast.
Conclusion
The bull flag pattern is a great addition to any trader’s toolbox. It can be a simple way to enter on breakouts with lower risk.
And it’s an awesome way to stay disciplined while trading. If you only want to trade bull flags and there’s no bull flag then … just stay away. It’s OK to not take a trade.
There are slight variations of the pattern — like the flat top breakout and pennant. So it’s important to decide if you want to learn to trade those as well.
You can use the bull flag in both intraday or daily chart analysis. It depends on whether you’re more of a day trader or swing trader. Lots of people can’t day trade, so they prefer to trade part-time…
That’s how I started in the markets years ago. Since then I’ve learned many trading techniques, and today I mentor students who are eager to learn. Check out a free webinar to speed up your learning curve. We’re serious about learning to trade in any market.
The bull flag pattern is an important momentum indicator … Keep an eye out for it when you’re scanning your charts.
Do you use the bull flag pattern for your trades? What’s your go-to chart pattern? Leave a comment below!