
Do you understand how critical it is to research every trade? One way to do this is through technical analysis.
In fact, if you’re trading in the current market, it’s smart to look at a stock’s technicals. These days, a lot of companies’ fundamentals don’t make sense.
There’s a lot of uncertainty with the pandemic lockdown. Some companies aren’t even giving financial guidance with their earnings reports.
So let’s go over the basics of technical analysis and why it’s important for traders.
Let’s jump in!
Table of Contents
- 1 What Is Technical Analysis?
- 2 Technical Analysis vs. Fundamental Analysis
- 3 Top Technical Analysis Tools
- 4 The Benefits of Technical Analysis
- 5 The Disadvantages of Technical Analysis
- 6 The Basics of Technical Analysis
- 7 Key Assumptions of Technical Analysis
- 8 How to Use Technical Analysis — With Examples
- 9 Technical Indicators
- 10 Technical Charts
- 11 What’s the Best Strategy for Technical Analysis?
- 12 How Can I Learn Technical Analysis?
- 13 Does Technical Analysis Work in 2020?
- 14 Conclusion
What Is Technical Analysis?
This is how traders study stock price action.
In short, this is how you look at a stock’s movements, the overall market, and learn to recognize patterns using historical data.
You can use technical analysis to help build the case for trades. Stocks can behave in similar ways to the past. It’s why patterns are so important to so many traders.
For example, a stock’s price may regularly hover at a certain price level. You can look at that as support or resistance. You might create trading plans around those price levels.
Technical analysis can also help you manage trade entries, exits, and position sizes.
Technical Analysis vs. Fundamental Analysis
Both technical and fundamental analysis are important for traders.
These useful tools can help you with this trading essential: managing risk.
Each has its pros and cons. So it’s a good idea to learn both and know when to put them to work.
It’s worth mentioning that in today’s market where fundamentals aren’t stable, technicals are king.
Top Technical Analysis Tools
Different tools can help you hone your tech analysis skills.
Start with good charting software. That will enable you to view data effectively.
Not all charting software is the same, however. Make sure your charting software includes access to indicators, candlesticks, and drawing tools.
StocksToTrade has all these things — and it was built by traders for traders. Try it out today. A 14-day trial is only $7.
You’ll also need knowledge, and that comes with practice and time. Good analysis can help you improve your perception. It’s how you can spot patterns and setups and make smart decisions.
The Benefits of Technical Analysis
Let’s check out the pros of getting technical…
1. The Ability to Look at Data Visually
Technical analysts use charts that display historical data.
Because it’s visual, traders can gain a unique perspective on price action that they wouldn’t get with fundamental analysis.
By looking at the data, traders can make intelligent decisions on what’s likely to happen with the stock … They can even see how investors’ emotions and market psychology play a role in stock movements.
2. Quickly Determine Trends
You can use technicals to quickly determine a stock’s trend over different time frames. That’s in contrast to the extensive research that fundamental data requires.
Technicals can help you identify if a stock is in a strong uptrend, downtrend, or consolidation. You can then use that information to make trading decisions and potentially limit your risk.
3. Create Entry and Exit Strategies
Fundamental analysis is handy for long-term entry and exit points. But it’s not always great for shorter-term strategies.
Technical analysis, on the other hand, can be great for both short- and long-term strategies.
You can look at price behavior in real time. You can analyze to gain better perspective to make smart trading decisions. That can include finding entries and exits that make sense for your strategy.
The Disadvantages of Technical Analysis
Now let’s take a look at a few downsides of going technical.
1. It’s Not Always Right
Even if you’re really great at it, you can still make trading plans that fail.
For example, say historical data shows a stock is likely to go up at a certain price level. Maybe the stock breaks through support … only to drop. That’s just part of the game. It’s also why you have to track and analyze your trades.
2. Mixed Signals
There’s both an art and science to analysis. For the science portion, you can use different technical indicators as signals to buy or sell stocks.
These indicators can be accurate … but even the best indicators will fail at times.
That’s where the art comes in.
With studying and experience, you can work to improve at looking at all the data as a whole. Then, determine where to focus so you can make smarter decisions.
3. It’s Really an Opinion
No two analysts will always completely agree. And some may not always correctly analyze stocks.
There are so many different methods and indicators, so, of course, different traders will see different things. What’s important is finding what works best for you.
The Basics of Technical Analysis
Now you know some advantages and disadvantages. Let’s dig into some basics.
The Dow Theory
Technical analysis began with Charles Dow. He created and used the Dow Jones Industrial Average to show how patterns of highs, lows, and averages explained market events and directions.
Dow believed that the stock market was a dependable measure of economic conditions. He thought that by examining the market as a whole, analysts could more accurately assess conditions and identify market trends … even for individual stocks.
Charles Dow’s work was very influential. And along with the work of others, it’s led to the field as we know it today.
Price Movements Aren’t Random
Not everyone believes in technical analysis.
Some opt for the random walk theory. These people believe stocks take random and unpredictable paths. They think it’s impossible to predict future stock movements by using past movements or trends. Sounds absolutely whacko if you’re a day trader, right?
Well, technical analysts don’t believe stock movements are random. They see patterns that stocks consistently follow.
‘What’ Is More Important Than ‘Why’
To find consistency in trading, you have to know what a stock is doing … and why.
But which is more important?
In general, fundamentals can help you understand why a stock is moving. And technicals can help you understand what a stock is doing.
If you’re a long-term trader, it’s important to know why a stock moves. It’s how you can better determine if it makes sense to hold on for a longer period of time.
But if you’re a short-term trader, you need to know what a stock is doing currently. Technical analysis is more effective for that.
Price Discounts Everything
Technical analysts believe that price is king. That means price action is crucial for trading well.
Many believe that a company’s fundamentals and broad market factors are already priced into the stock … And that price movement is the main component for making smart trading plans.
Key Assumptions of Technical Analysis
Today’s technical analysts typically agree on three assumptions. Let’s break them down.
1. Stock Prices Moves in Trends
Technical analysts don’t believe stock movements are random.
They expect prices to display trends regardless of the time frame they’re observing. So instead of moving erratically, they believe a stock is more likely to continue a trend it’s followed in the past.
2. The Market Discounts Everything
Let’s continue this thought from earlier…
Technical analysts believe everything is priced into a stock. That leaves price action, which is influenced by supply and demand. That’s what technical analysts focus on with full attention.
3. History Often Repeats
Technical analysts believe that when it comes to a stock’s history of price action, it tends to repeat.
So what’s behind this repetitive behavior? Most think it’s market psychology. Yep, the outlook buyers and sellers have toward the market can sway it.
Analysts use chart patterns to determine the emotions of other traders and how that can affect stock movements. It’s part of the cyclical nature of the market.
How to Use Technical Analysis — With Examples
Traders use technical analysis to predict a stock’s future direction so that they can potentially take a profit from the market.
Let’s take a look at a few breakout charts.
Now, it’s easy to make the perfect plan in hindsight. When it happens in real time, it’s a different story. But these are basic examples of how you might plan a trade and keep your risk to a minimum.
Workhorse Group, Inc. (NASDAQ: WKHS)
Check out this chart of Workhorse Group, Inc.
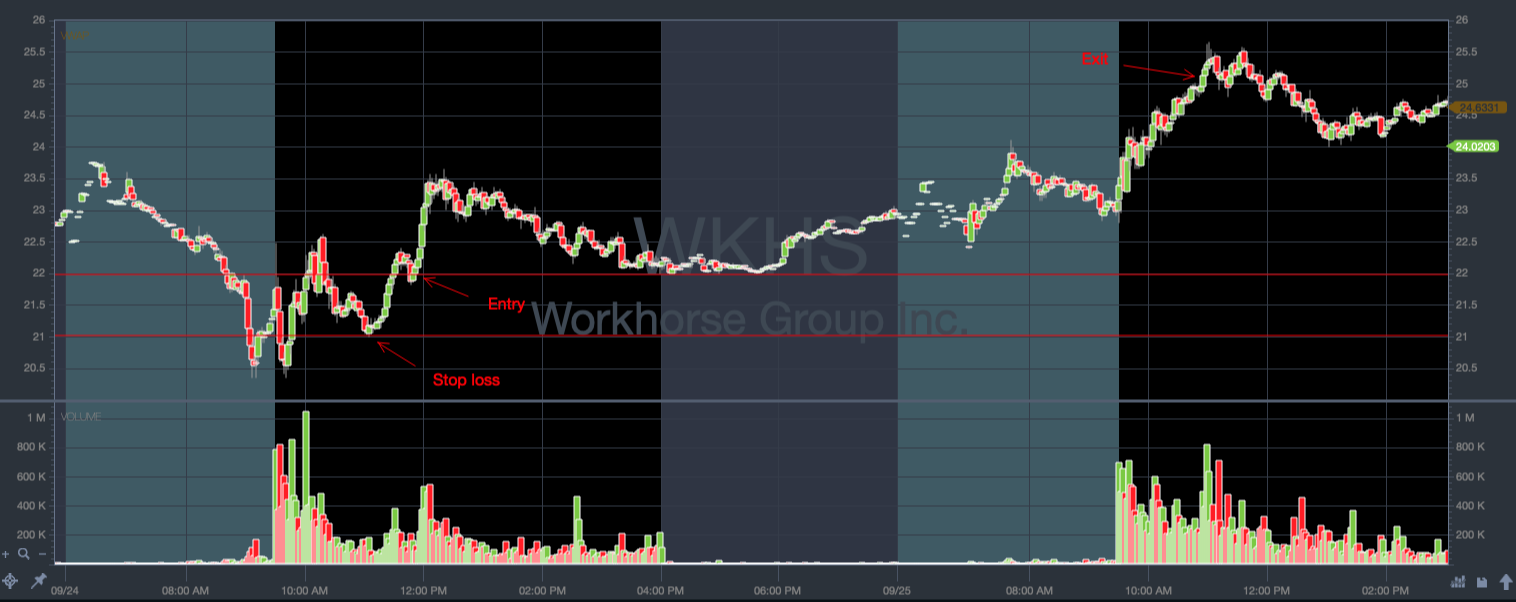
Workhorse Group Inc. (NASDAQ: WKHS) 15-day chart (Source: StocksToTrade)
WKHS had been on a decline in late September … But on the morning of September 24, the company announced that its C-Series all-electric delivery truck had reached an industry-leading 160-mile range for the last-mile delivery sector.
Although this is good news, you don’t want to enter a trade without a plan — so how could you potentially play this?
One possibility would be to enter a swing trade a little above the $22 mark when the price started to rise with volume.
You could have used the bottom of the previous move — around $21 — as a stop loss.
You might have set a price target of $25 as an exit point, which would have been about a 3:1 risk/reward.
As you can see, WKHS ended up going past $25 … but it’s a smart idea to take profits when possible.
Let’s take a look at another example…
Peloton Interactive Inc. (NASDAQ: PTON)
PTON has been on fire … and the combination of a hot sector catalyst with a breakout over a whole dollar number like $100 can provide a great trading opportunity.
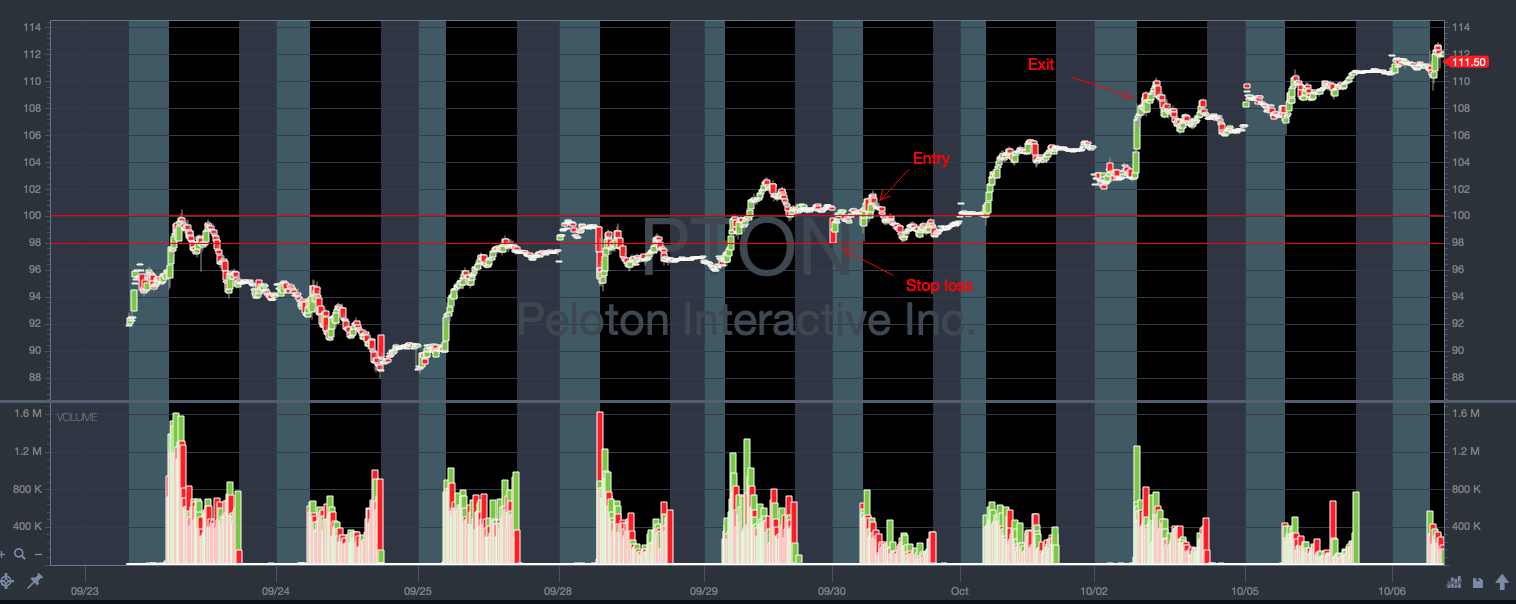
Peloton Interactive Inc. (NASDAQ: PTON) 10-day chart (Source: StocksToTrade)
Let’s say you’ve been waiting for that breakout to happen with PTON. And when it finally happens, you decide to remain patient and let it test the $100 mark before you enter.
You could enter right above the $100 mark after it consolidates and proves itself a bit.
Your stop loss could be the low from after-market hours, which has also shown to be support in previous days.
$108 would have been a good exit, which is a 4:1 risk/reward. You couldn’t ask for better than that, right? That’s all hypothetical, of course.
In this example, PTON dropped and tested your stop loss but didn’t break it … So the plan worked.
Again … these examples are overly simplified. But it gives you a big-picture idea of how you can use technicals to make trading plans.
Technical Indicators
Technical indicators can help you make smarter decisions. They can even signal when to buy or sell a particular stock.
There are many different indicators you can use … Let’s look at a top few.
Price Trends
Price trends are a particular stock’s direction and momentum.
The longer the time frame for the trend, the stronger it is … And once the trend is established, it’s usually more likely to continue than reverse.
This is important to note. Trade with the trend. It’s how you can trade smarter. If you try to trade against a trend, you take on more risks.
Oscillators
Oscillators can signal possible trend changes by gauging a stock’s momentum. They also have upper and lower bands that indicate if a stock is overbought or oversold.
Moving Averages
This is a stock’s average price over a given period of time. The average price changes as newer data and recent activity replace older data.
Traders and analysts use moving averages to help assign meaning to price action by identifying price trends.
Volume and Momentum Indicators
If you want to make solid trades, you want to look for a stock that has the momentum to break out of ranges. No momentum is not good for your risk vs. reward ratio.
Volume and momentum indicators help determine if a stock’s trend is real and has a chance to continue.
Support and Resistance Levels
Support and resistance levels are areas of consolidation where the bulls and bears wage war. Both sides fight to dominate the trend’s control.
They’re important to recognize when planning trades … And when stocks break out of these areas are broken, they often set good levels to establish new positions.
It’s also important to know support and resistance areas when setting stop losses.
Technical Charts
Charts help traders visually analyze price over time. Let’s look at some different chart types.
Candlestick Charts
These are a popular chart type with many traders. They display the most amount of information that’s easy to view at a glance.
Candlesticks display the high, low, open, and closing (HLOC) prices for each designated time period.
The thick bodies and the thinner wicks of the candle form patterns. Skilled chart readers use these patterns to determine market psychology and predict upcoming price movements.
Bar (HLOC) Charts
Similar to candlesticks, bar charts display the HLOC prices for a time period.
These charts can look cleaner but tell you less.
Line Charts
Line charts are the simplest charts. They only display closing prices linked to form a continuous straight line.
It’s clean and easy to follow … but leave out a lot of important information.
What’s the Best Strategy for Technical Analysis?
Every trader’s strategy is different … but let’s look at some key places to start.
1. Develop a Smart Trading System
It takes time to learn to trade consistently … and there are many ways to do it.
You have to develop a system that works for you.
A good system means you focus on the best stocks for your setups. It also means you can create trading plans while managing your risk.
2. Find Strong Areas of Support and Resistance
This is one of the most important concepts you can learn in trading.
These are areas where a stock could possibly reverse or halt. If you can recognize these areas when making your trading plans, you can work to set smarter entries and exits.
3. Look for the Right Brokerage
Some brokers can be better for certain setups.
In the beginning, it may be less important for you to have a specialized broker. But as you get to know what setups fit your particular skills and personality, make sure to pick a broker that fits your trading style.
4. Track and Monitor Trades
Becoming a smarter trader means a lot of failure and repetition.
There’s so happening when you’re trading, it’s easy to forget things you can learn from.
That’s why successful traders track and monitor trades. How else can you correct mistakes and keep improving?
5. Use the Right Tools
Good tools should help you in the markets…
At StocksToTrade, we’ve built a platform to give traders access tons of trading and market information in one place. It’s all so you can make smart decisions fast.
StocksToTrade has beautiful stock charts that are easy to read … with every technical indicator you’ll need to develop your own trading system.
Try it out today. A 14-day trial is just $7. Sign up now!
How Can I Learn Technical Analysis?
You’ve gotta study and work at it. Arm yourself with the right tools. Make sure to track your trades so you know what’s working and what’s not. Not ready for risking your cash in the market? Test your strategies and tools using StocksToTrade’s paper trading feature.
Does Technical Analysis Work in 2020?
Yep. If you do the work. You have to continuously pay attention, learn, and improve.
Never assume you know every tool and every indicator. Be willing to constantly adapt.
Conclusion
Technical analysis is key to trading smarter … The current market makes that super clear.
If you’re sticking to only fundamentals during the pandemic, you’re likely very frustrated.
When companies don’t even know what to project for earnings, it’s hard to make plans through their fundamentals.
Learn to embrace the technicals. Read the charts until your eyes bleed. There’s so much you can learn from a stock’s chart.
The market in 2020 is crazy. But it’s actually a great time to learn. There are so many stocks moving every week. This means you’ll get more time “at bat” to develop a process.
And you don’t have to go it alone. You can join our SteadyTrade Team mentorship program. It’s where you can be part of a community of like-minded traders working to better navigate the market. Every trading day you can access twice-daily webinars and get hands-on guidance. Learn more here.
What do you think about technical analysis? Are you a fan or not? Leave a comment below!