
A Pivot Point is a popular indicator commonly used by technical traders to determine the overall market trends, as well as potential support/resistance levels over different time frames.
Floor traders–the original day traders–are credited with being the first to use Pivot Points to set key levels.
At the beginning of each day, they would look the previous day’s High, Low and Close to calculate support and resistance levels for the current day’s trading.
Download a PDF version of this post as PDF.
Table of Contents
So what exactly IS a Pivot Point?
Essentially, a Pivot Point is the average of the High, Low and Closing prices from a previous trading session.
Pivot Points act as a leading/predictive indicator in that on the subsequent day, trading that goes above the Pivot Point is considered a bullish signal, while trading that goes below it is considered a bearish signal.
In Pivot Trading, the general trend is that if the market opens above or below the pivot, the price action has a strong tendency to remain above/below the pivot for that trading session.
Keeping this in mind, as it allows you to avoid much of the market noise that may show up later in the day.
On the other hand, if the market opens or trades at extreme support or resistance levels, it has a general tendency to trade back to the pivot.
Traders should remember this to avoid buying high or selling low even as the price moves away from the pivot.
The Opening, High, and Closing Prices are used to calculate Pivot Points based on the chart’s timeframe.
Short-term timeframes of less than 15 minutes use data from the previous day; medium-term charts (30-minute and 60-minute) use data from the previous week, while daily charts use data from the previous month.
Meanwhile, weekly and monthly charts use data from the previous year.
Pivot Points for 10-Minute S&P 500 Chart
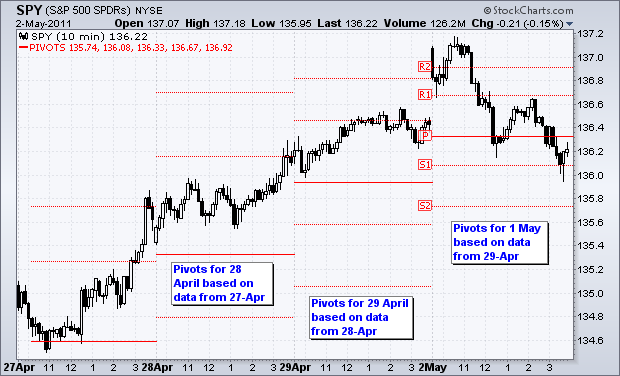 Source: StockCharts
Pivot Points for 60-Minute S&P 500 Chart
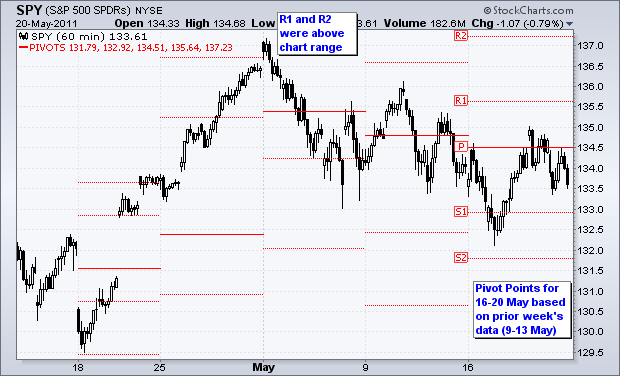 Source: StockCharts
Pivot Points for Daily S&P 500 Chart
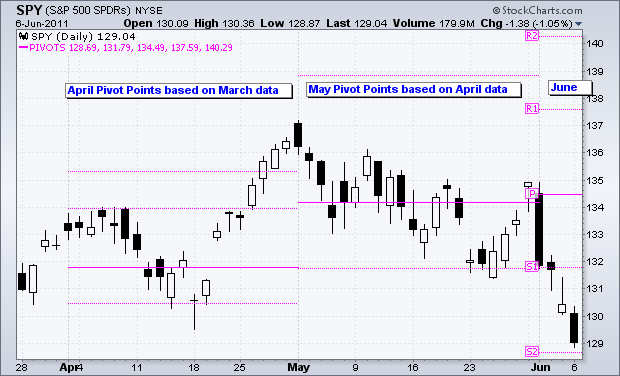 Source: StockCharts
There are several different versions of Pivot Points in use today. Standard Fibonacci and Demark Pivot Points are among the most common.
-
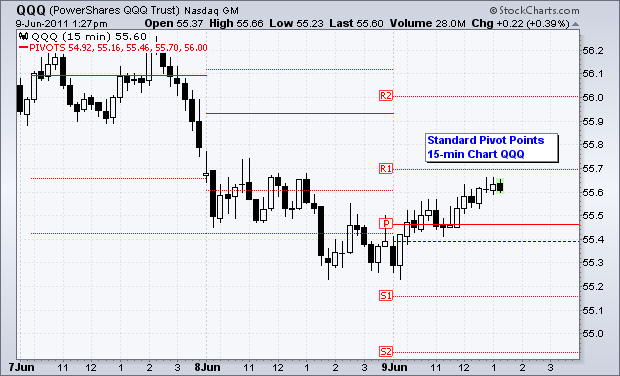
Standard Pivot Points
Standard Pivot Points are the most basic Pivot Points. To calculate Standard Pivot Points, you start with a Base Pivot Point, which is the simple average of High, Low and Close from a prior period. A Middle Pivot Point is represented by a line between the support and resistance levels.
- To calculate the Base Pivot Point: (P) = (High + Low + Close)/3
- To calculate the First Support Level: Support 1 (S1) = (P x 2) – High
- To calculate the Second Support Point: Support 2 (S2) = P – (High – Low)
- To calculate the First Resistance Level: Resistance 1 (R1) = (P x 2) – Low
- To calculate the Second Resistance Level: Resistance 2 (R2) = P + (High – Low)
The chart below shows Standard Pivot Points on a 15-minute chart for the Nasdaq 100 ETF (QQQ) for June 9th. All the levels remained constant throughout the day.
 Source: StockCharts
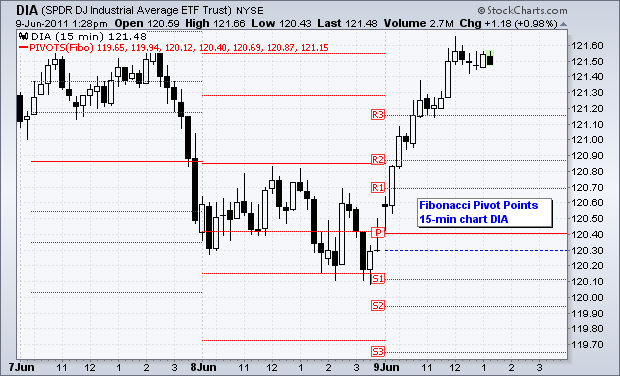
2. Fibonacci Pivot Points
Just like Standard Pivot Points, Fibonacci Pivot Points also start with a Base Pivot Point. The main difference is that they also incorporate Fibonacci levels in their calculations.
Most traders use 38.2%, 61.8% and 100% retracements in their calculations and, therefore, Fibonacci Pivot Points represent three support and three resistance levels.
The main logic behind Fibonacci Pivot Points is that many traders love using Fibonacci Ratios.
Both Pivot Points and Fibonacci Ratios are used to find support and resistance levels.
With so many traders using both tools in their analysis, they can easily become self-fulfilling.
The Base Pivot Point, support and resistance levels for Fibonacci Pivot Points are calculated as follows:
- To calculate the Base Pivot Point: Pivot Point (P) = (High + Low + Close)/3
- To calculate the First Support Level: Support 1 (S1) = P – {.382 * (High – Low)}
- To calculate the Second Support Level: Support 2 (S2) = P – {.618 * (High – Low)}
- To calculate the First Resistance Level: Resistance 1 (R1) = P + {.382 * (High – Low)}
- To calculate the Second Resistance Level: Resistance 2 (R2) = P + {.618 * (High – Low)}
- To calculate the Third Resistance Level: Resistance 3 (R3) = P + {1 * (High – Low)}
The chart below depicts Fibonacci Pivot Points on a 15-minute chart for the Dow Industrials SPDR (DIA).
 Source: StockCharts
StocksToTrade—now better than ever! We ushered in the New Year with some major advancements that include 3 unique features, exclusive to our Platform.
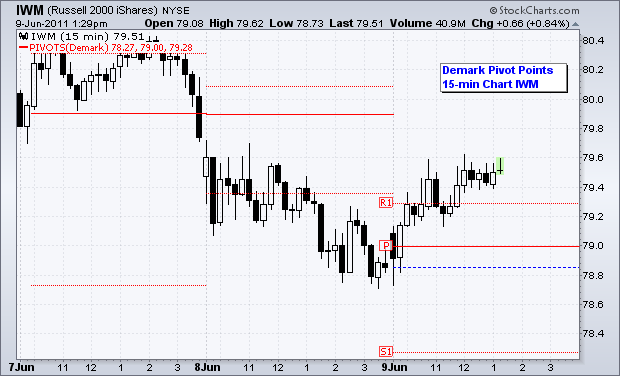
3. Demark Pivot Points
Demark Pivot Points are not actual Pivot Points, in the real sense of the word, but rather are used to show the relationship between the Open and Close.
Unlike the other two types of Pivot Points, Demark Pivot Points only feature a single support and resistance level.
The following set of operations are used to calculate Demark Pivot Points:
- If the Close is less than the Open, then X = High + (2 x Low) + Close
- If the Close is greater than the Open, then X = (2 x High) + Low + Close
- If the Close is equal to the Open, then X = High + Low + (2 x Close)
- To calculate the Pivot Point: Pivot Point (P) = X/4
- To calculate the Support Level: Support 1 (S1) = X/2 – High
- To calculate the Resistance Level: Resistance 1 (R1) = X/2 – Low
The chart below depicts Demark Pivot Points on a 15-minute chart for Russell 2000 ETF (IWM).
Source: StockCharts
Setting the Tone with Pivot Points
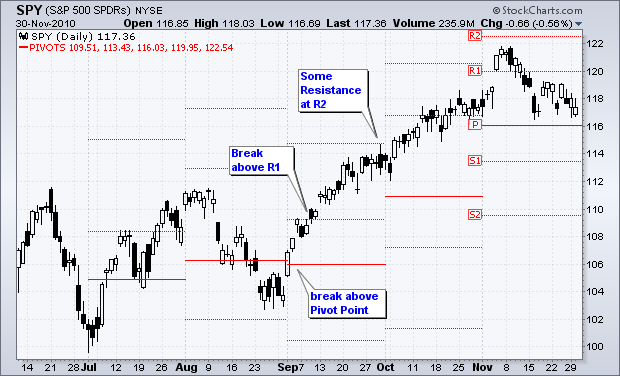
Pivot points are used to set the tone for price action.
A move above the Pivot Point shows strength in the market while one below it shows weakness.
A move above the Pivot Point indicates strength and signals the trader to look at the first resistance as a target.
A break above the first resistance indicates even more strength and the trader should now target the second resistance level.
 Source: StockCharts
The converse also applies. A move below the pivot indicates weakness and the trader should look at the first support level as a target. A break below the first support level indicates even more weakness and the trader should look at the second support level as a target.
The Best Pivot Point to Use?
As with other technical indicators, there is no single best Pivot Point that will work for all traders, all of the time.
The best advice is to use your Pivot Point of choice with other technical analysis tools, including MACD, candlesticks and RSI.
Most charting software uses Standard Pivot Points.
You can choose to chart your own Pivot Points using other methods and try them out to see what works best for you.
Check out STT’s new Twitter Streams! One of our most important new releases of 2017 is the inclusion of Twitter as a source of data for keeping up to date with the latest social discussions on a given stock. Every Stock tab includes a Twitter data feed which focuses only on tweets mentioning the company being tracked.