
Level 2 Quotes: Key Takeaways
- Level 2 quotes don’t predict price, but they can help you understand this essential indicator…
- Knowing the market makers is key for one of my favorite Level 2 strategies…
- What do all those colors mean? I’ve got your decoder ring!
Level 2 is only one piece of a good trade — join the SteadyTrade Team for all the rest!
Level 2 quotes are the lines of colorful text and numbers under a stock’s chart…
They don’t come standard on every trading platform. And they can seem overwhelming for new traders.
Once you understand what they mean, you’ll have a secret weapon. That’s why we’re here today. Let’s get into it!
Table of Contents
What Are Level 2 Quotes?
Level 2 quotes are price quotes for limit buyers and sellers waiting to get their orders filled…
Learning how to read them will tell you who’s buying and who’s selling. It will tell you how many shares they’re looking to buy/sell and at what price.
You need two to tango on a stock order. Level 2 quotes show you who’s just showed up to the dance and is waiting for a partner.
Level 2 can show you how a stock’s direction will change in the near future…
Or at least it can give you a sense of market sentiment. If you see big orders stacking up in the bid column — and they’re close to the current bid — that means the stock is bullish.
If you see a ‘wall of sellers’ lining up to get their orders filled, the price will have a hard time pushing higher.
I know — it looks complex at first glance. But don’t worry. Once you understand what you’re looking at, it can be useful for making more successful trades.
In this post and infographic, I’ll break down Level 2 quotes for you. First, check out the infographic, then read on for more on how to use them to help you make better-informed trading decisions.
Level 2 Quotes and Price Action
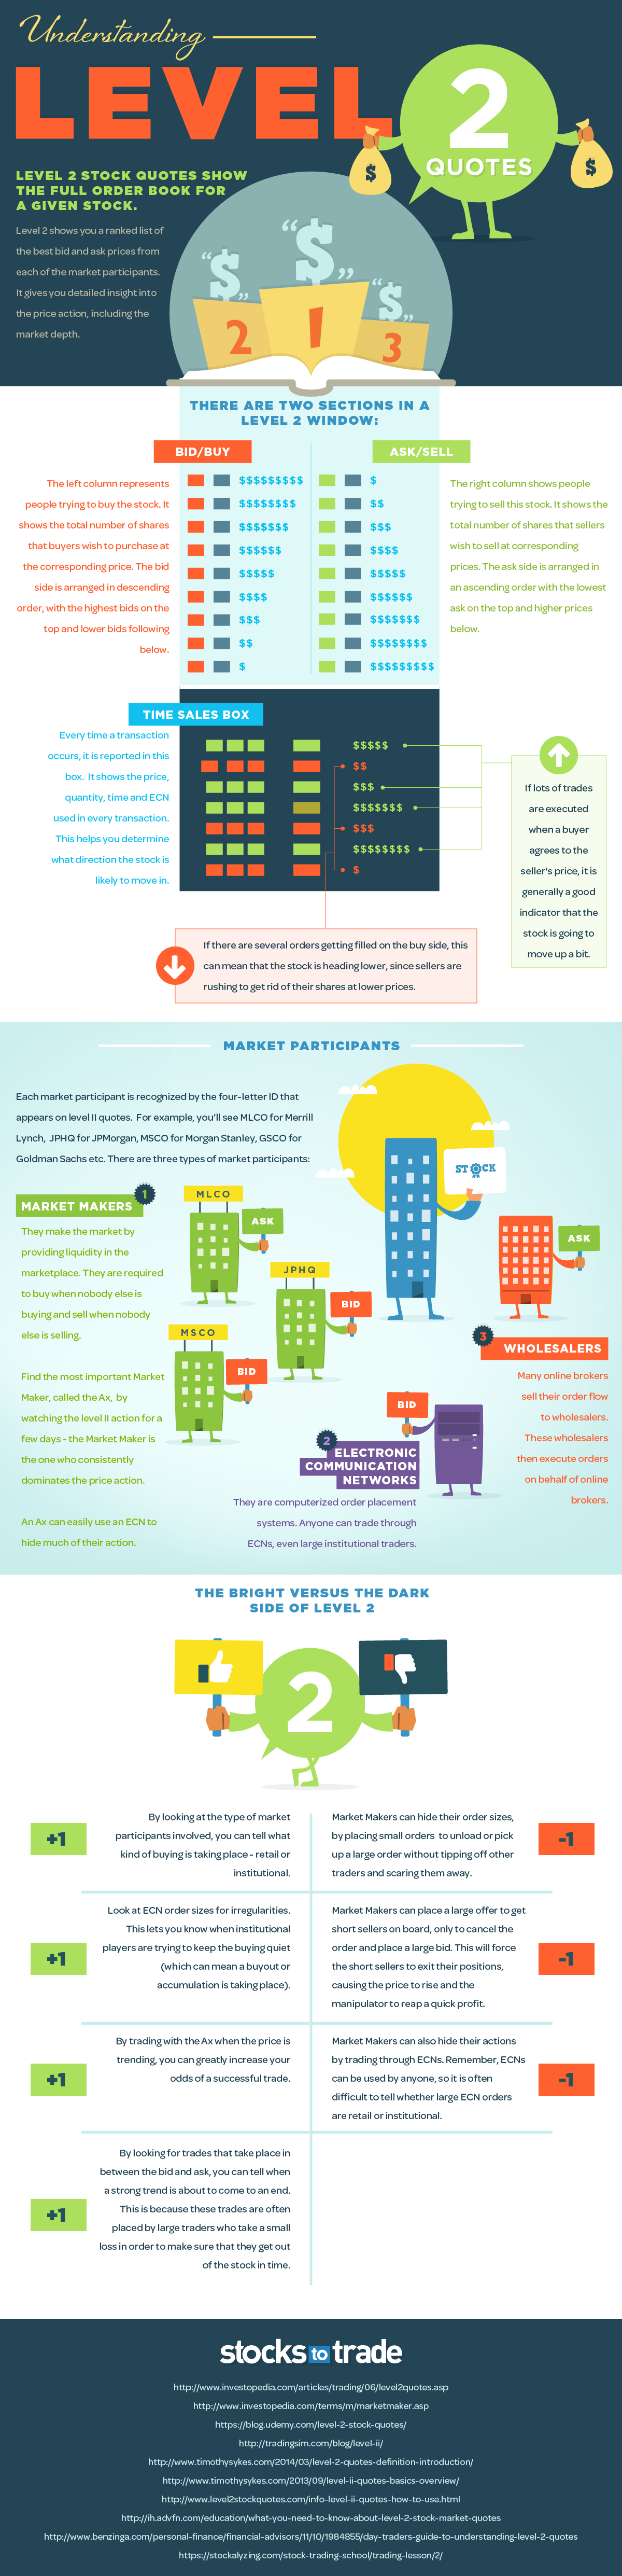
Level 2 stock quotes show the full order book for a given stock. The execution of these orders guides price action.
Think back to when you were a kid and had a baseball card or something that everyone wanted. One kid offered you one peanut butter and jelly sandwich. Another kid offered you two.
When demand outpaces supply, the price goes up. When supply is greater than demand, the price goes down.
Level 2 shows you a stock’s supply and demand in real time. It’s comprised of all of the buyers and sellers with open orders.
It’s also comprised of tricky high-frequency traders and manipulative market makers. More on that later…
It might not be as easy to see Level 2’s relationship to price as the baseball card example. But learning what it means is still a powerful tool that should absolutely be in your arsenal!
Reading a Level 2 Quote
When you look at a Level 2 quote, you’ll see a window with two sides: bid/buy and ask/sell.
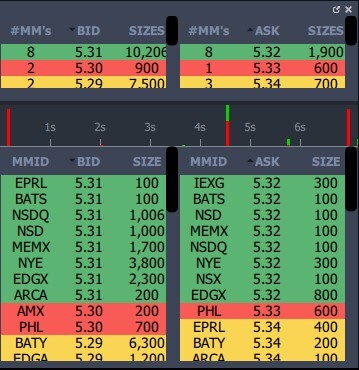
This is the Level 2 window for Bakkt Holdings Inc. (NYSE: BKKT). When this stock made my watchlist in mid-February, it was trading about 10 million shares a day…
The top sections on each side show the total volume of all trades waiting to be executed. The bottom sections are broken down by individual market maker.
In between, you get a volume bar showing the frequency of trading in the last few seconds. The bar height represents the position size.
That’s the basic lay of the land. Now let’s look at what it tells you…
The bid/buy is typically on the left. It’s a descending list of what buyers are willing to pay for the stock.
Every time a trader puts in a new buy limit order, their order will appear in the left column. It gets grouped under the market maker their order’s routed through…
As the stock price ticks down to meet the bid, the highest bids get taken out first. The stock price continues to fall when sellers come down to the next highest bid, and so on.
The right column is usually ask/sell and gives you a mirror image of the bid column. Except here, traders are lining up to sell their stock. The prices at the top are the closest to the current bid, followed by higher prices.
Time Sales Box
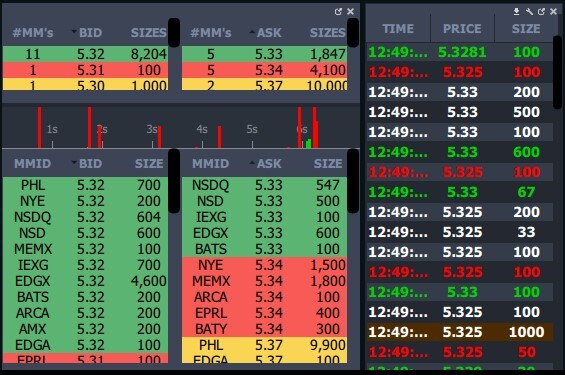
The time sales box is the order log.
It’s often to the right of the Level 2 window.
Every transaction is reported in this box. You see the price, quantity, and time of each trade.
This is ‘the tape’ — also known as the stock ticker. Reading the tape was one of the earliest forms of technical analysis.
Stock tickers have been around since 1867. Jesse Livermore, the first modern day trader, was a pioneer of tape-reading strategy…
If you’ve never read his 1923 classic “Reminiscences of a Stock Operator,” you absolutely should!
(As an Amazon Associate, we earn from qualifying purchases.)
Way before Level 2 — or computers — were a thing, traders used the time sales box. Learning to read tape can still help you determine which direction the stock’s likely to move in.
How can you do that? Look at the colors. Unlike Level 2’s colors, these actually mean something
Every line will be either red, green, or white:
- Red means that the order was on the bid — the lower end of the bid-ask spread.
- Green means that the order was on the ask — the higher end.
- White means that the order fell between the bid and ask. Usually, this indicates a market order.
If the tape is mostly green, it’s an indicator of bullish sentiment. If the tape’s red, the stock’s price could be moving down.
What’s the Difference Between Level 1 and Level 2?
Level 1 quotes are also known as real-time quotes. They show you the current best bid and ask prices on a stock — the national best bid and offer (NBBO). These quotes are the most basic information you need to trade a stock.
Most trading platforms include other indicators in their Level 1 windows, like volume. StocksToTrade lets traders customize their Level 1 windows. Float size is an indicator I always keep in mine.
Level 2 gives you a look into the future of a stock’s price. It might not help you predict a stock’s price movement, but it doesn’t hurt.
Level 2 is a basic tool for all smart traders. If you’re solely relying on Level 1, you’re missing a trick!
What Does Level 2 Actually Tell You?
Now, the bad news … Level 2 won’t help you much for most stocks, especially high-volume stocks that trade on major exchanges.
Modern trading isn’t like the playground example I gave you earlier. If a stock like BKKT is trading 10 million shares a day, tens of thousands of shares are being traded every minute.
Not all of these traders are putting in their limit orders and waiting to get them filled. Some trades are getting filled instantly. The market moves fast for the liquid stocks you want to trade.
That’s without mentioning the millisecond reaction times for high-frequency traders.
There’s also price spoofing, where market makers will list a buy or sell order they don’t intend to execute. This creates the illusion of more supply or demand than the market has to offer.
So when is reading Level 2 helpful?
I use Level 2 for market sentiment. Most of the shares listed in the Level 2 window are people who want to buy or sell a stock.
With practice, you’ll get a sense of Level 2’s relationship to price action. There are also a few tricks you can use, such as trading with the ‘ax.’ That’s the market maker with the greatest control over the stock’s trading.
To get to that level, first, we need to understand the players.
Getting to Know Level 2’s Market Participants
Level 2 quotes don’t only tell you price. If you look to the left of the bid/ask, you’ll see a three- or four-letter market maker ID (MMID).
These are the different broker-dealers involved in a stock’s trading. You’ll recognize some of these names:
- MLCO — Merrill Lynch
- JPHQ — JP Morgan
- MSCO — Morgan Stanley
- GSCO — Goldman Sachs
Some don’t have the same brand recognition, but they’re still important for traders to know!
- ARCA — NYSE Arca
- EDGX — owned by CBOE U.S. Equities
- BATS — Bats Global Markets, also owned by CBOE
Now let’s look at what these symbols represent.
Market Makers
Market makers literally ‘make the market’ by providing liquidity in the marketplace. They’re required to buy when nobody else is buying and sell when nobody else is selling.
Like I said before, you want to get to know the ax. If you watch a stock’s Level 2 action for a few days, you’ll begin to notice one market maker more active than the others. That’s probably the ax.
Electronic Communication Networks (ECNs)
ECNs are computerized order-placement systems.
Anyone — including large institutional traders — can trade through ECNs. This is one place where Level 2 quotes can get tricky.
The ax can use ECNs to hide its actions. That can make it difficult for you to understand where it’s trying to move the market.
Wholesalers
Many online brokers sell their order flow to wholesalers. These wholesalers then execute orders on behalf of online brokers.
Level 2 Strategy: The Good and the Bad
Like any analysis tool, Level 2 strategy has its good and bad points. Let’s look at a few on each side.
The Good
- Retail and institutional trading look different. Different market participants specialize in retail and institutional activity. Once you know the market makers you can tell their biases. Usually, one or the other is dominant.
- ECNs can also reveal activity. Market makers can try to hide their actions behind ECNs, but you can beat them at their own game. If you look closely at order sizes, you can see when institutional players are trying to keep their activity quiet. That can mean a buyout or strategic accumulation is taking place.
- Grind along with the ax. By trading with the ax when the price is trending, you can increase your odds of a successful trade.
- Find the bid/ask sweet spot. You can tell when a strong trend is about to end. Look for the majority of trades in the time sales box to be white. That means that they’re in between the bid and ask. These trades are often placed by large traders who take a small loss to make sure they get out of the stock in time.
The Bad
- Market maker trickery. Market makers can hide their order sizes by placing multiple small orders. They do that to unload or pick up a large order without tipping off other traders.
- Price manipulation. Market makers can place a large offer on the sell side to get short sellers on board. Then they’ll cancel the order and place a large bid. This forces short sellers to exit their positions, causing the price to rise. Guess who reaps a quick profit?
- ECN diversion tactics. Market makers can also hide their actions by trading through ECNs. Remember: Anyone can use ECNs. It’s often difficult to determine if large ECN orders are retail or institutional.
StocksToTrade for Level 2
When you’re using Level 2 strategies, you’re going up against other day traders. You want to have all the advantages you can.
The trading platform I use for Level 2 and everything else I need for day trading is StocksToTrade. StocksToTrade has everything you need for technical analysis, including a robust Level 2 add-on. That’s in addition to awesome charting and a great stock screener.
Grab your trial here today — just $7 for the first 14 days!
Conclusion
Level 2 quotes are one key to price action — and we all know that only price matters.
Like any trading tool, Level 2 is only part of the puzzle. Study it and know how to use it…
But never rely on it alone.
There’s no secret to making successful trades. There are just a lot of smaller components like this. A good trading education consists of as much knowledge as you can get!
Do you use Level 2 quotes? What’s your strategy? Leave me a comment — I love hearing from my readers!