
Relative volume can be a game-changer for day traders tracking stock market momentum and volatility.
There are A TON of trading tools out there to help you become the best trader you can be. Relative volume is one — and we’ll take a deep dive into it today.
Volume’s extremely important in trading .. and so is understanding how a stock is trading compared to its past.
If a stock is trading way more volume than usual, that means something’s up…
When that happens, you want to know about it.
So how can you determine relative volume and use it to your advantage? Let me show you!
Table of Contents
What Is Relative Volume?
Here’s the simple relative volume definition: relative volume is volume compared to average volume.
When it comes to relative volume — or RVol — there are two schools of thought. One is more complex, so we’ll start with the basics.
Averages are built from several factors using a period of time — usually 5, 30, or 60 days. In theory, you could use whatever period you like.
We’ll use the 60-day average volume here. StocksToTrade’s Total View has a Basics box with average volume that defaults to the 60-day period. See it for yourself — try StocksToTrade for 14 days for just $7.
Why Does Relative Volume Matter to Traders?

© StocksToTrade
Every move in the market happens because of supply and demand. Volume is the number of shares traded. Without volume, price doesn’t move much.
Relative volume tells us how many shares have traded in relation to how many shares are usually traded. It can be a great indicator that unusual price action may be coming.
Sure, some low-volume breakouts grind away. Those can be interesting to position traders. But as day traders, we like our stocks volatile.
When you get unusual volume, you get unusual moves. Breakout traders and momentum traders look for big volume moves to inspire a trade. As a day trader, you’re looking for the party.
How to Calculate Relative Volume the Easy Way
The most basic way to calculate relative volume is to divide the day’s volume by the average volume.
What you wind up with is a ratio. Many relative volume scanners express this ratio as a single number.
Relative Volume Example
On March 14, AgriFORCE Growing Systems, Ltd. (NASDAQ: AGRI) traded 113.65 million shares. Its 60-day average trading volume is 5.1 million shares…
So, we take 113.65 million, divide by 5.1 million, and we get 22.29. We can round it off even further. What’s the stock’s relative volume? 22.3.
Why Do Traders Use Relative Volume?

© StocksToTrade
For a stock to be in play, it needs to be liquid. The more liquidity, the better. That gets more eyes on the stock and more players in the game.
When a stock has what I like to call ridiculous volume, that’s when you get monster moves and parabolic runs.
Some traders use relative volume to decide which stocks they’ll watch.
It can be helpful. Let’s say you set your scanners to find stocks that trade one million shares in a day. You run your scan and come up with 1,000 stocks. That won’t help you find a trade.
Many of those stocks might have an average volume of more than a million shares. So if volume is your only criteria, you’ll find a lot of stocks that aren’t trading exceptional volume.
With average volume, you get average moves. So a lot of traders like to use a relative volume indicator to help find potential trades.
What’s a Good Relative Volume Ratio?
During premarket, I look for stocks that have traded at least their average volume. By the time the market opens, I’ve narrowed it down to stocks that have a relative volume ratio of at least 4.
 That means I’m looking for stocks that have traded at least four times their average volume. If they’ve rotated their float already, all the better.
What Is a Low Relative Volume Ratio?
Any stock with a relative volume ratio of less than 1 just isn’t worth my time…
That means if a stock’s average volume is 100,000 shares, I want it to trade at least 100,000 shares in premarket. But I’d still like to see it trade three or four times that — meaning 300,000 to 400,000 shares.
Anything less than that isn’t volatile enough for my taste.
How to Use Relative Volume in Your Trading Strategy
A key part of any trading strategy is finding the right stocks to trade.
While basic relative volume won’t be of much use in taking a trade, it’ll help you find stocks that are in play. Then you can build a strategy around what you find.
A Momentum Trading Strategy Using Relative Volume
Here are some key ingredients for a short squeeze. Now, the presence of all these things doesn’t guarantee a short squeeze. Nothing’s guaranteed in trading. But these factors can increase the odds of a HUGE move.
You’re looking for a stock that…
- Has a high relative volume ratio…
- Is a low float stock…
- Has a history as a former runner…
- Is in a hot sector…
- And has high short interest…
From there, I like to watch for my favorite patterns — the dip and rip, the VWAP-hold, high-of-day break, and the weak open red-to-green.
Building a Relative Volume Scanner Using StocksToTrade
StocksToTrade doesn’t have a built-in RVol scanner, but it does have an easy way to build custom scans. It’s simple to add relative volume to any scan you customize.
Open any scan you’ve built or start a new one. Add the Volume block. Inside the Volume block, set your parameter to Criteria. In the drop-down menu, go to Liquidity, then Average Volume, and select your preferred period.
From there, you can set your scanner to find stocks that have a high volume ratio. Remember to use the % (percent) option and keep in mind that every 100% will equal one.
Here’s an example of a relative volume block that will scan for a relative volume of 10 or more, using the 60-day average volume.
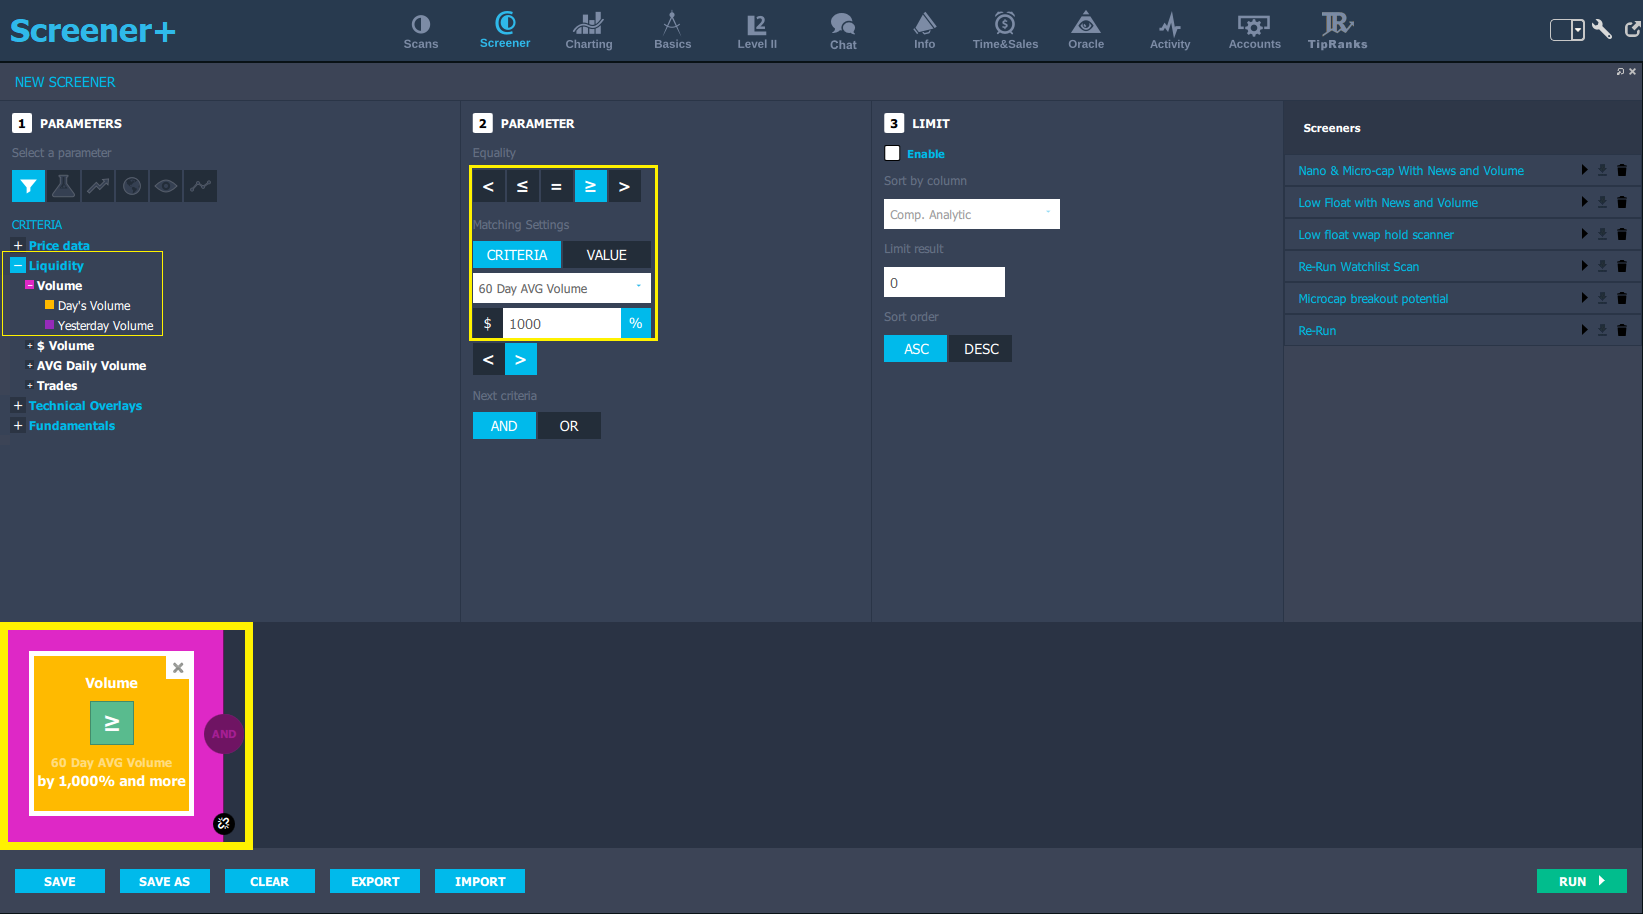
Relative Volume Scanner Code Block, courtesy of StocksToTrade
Relative Volume — The Hard Way
I won’t go too in-depth here, because this is pretty advanced. But there’s a school of thought you should know about. It’s based on the intraday volume distribution curve…
Intraday Volume Distribution Curve
For the most part, stocks tend to follow a volume curve throughout the day. Different time periods see different kinds of action.
The morning is the busiest period, in the first hour of the day. Then there’s a midday lull, followed by an afternoon push.
How to Calculate Relative Volume the Hard Way
Some traders use the intraday volume curve in their relative volume calculations…
You take the volume from a time of day and compare it to the presumed volume based on the average.
I know. That’s a lot. Let’s break it down.
Say on average any stock trades 35% of its volume by 10:30 a.m. In this example, the stock’s 60-day average volume is 100,000 shares. On any given day, at 10:30 a.m., that stock should have traded around 35,000 shares (100,000 x 0.35 = 35,000).
Let’s say this company knows how to play the game. You see it put out a press release at 8:30 a.m., and the stock has some attention. By 10:30 a.m., the stock has traded 350,000 shares.
The relative volume in this example would be 10 at 10:30 a.m. That’s 350,000 at 10:30 a.m. divided by the presumed average volume at 10:30 a.m.
Conclusion
As you can see, you don’t have to be a math genius or a programmer to benefit from relative volume.
In fact, you can often tell at a glance how liquid a stock is. With a few brief calculations, you can decide which stock may have the most eyes on it.
If you like the more calculation-intensive approach, it’s there for you. But if you ask me, it’s better to keep it simple. That’s my top tip for every trader.
Look for ridiculous volume and wait for those breakout patterns…
And if you need extra help, check out the SteadyTrade Team!
Tell me about your scanners! What about your favorite search criteria before you discovered relative volume? Leave a comment below!