
Ascending triangle patterns can be a great pattern to help you find breakouts before they happen.
And it’s pretty simple — it’s a triangle that’s going up on a chart. Who would have thought your preschool teacher was prepping you for day trading?
Technical analysis and patterns are often based on human emotion and self-fulfilling prophecies. Nothing gets buyers excited like a good bullish pattern … And the ascending triangle is one of the more bullish patterns out there.
Even on a bearish chart, an ascending triangle can signal a reversal.
Now, I never recommend trying to buy the bottom of any chart. And if you’re short selling, this could be a good sign that it’s time to cover.
Let’s cover the basics first…
Table of Contents
- 1 What Is an Ascending Triangle Pattern?
- 2 Why Is the Ascending Triangle Pattern Important?
- 3 Why Does an Ascending Triangle Pattern Form?
- 4 How to Identify an Ascending Triangle Pattern on Charts
- 5 Ascending Triangle Pattern: How to Spot Breakouts
- 6 How Do You Trade an Ascending Triangle Pattern?
- 7 Ascending Triangle Measuring Technique
- 8 Ascending Triangle Pattern Trading Limitations
- 9 Triangle Breakouts Like Ascending Triangle Breakouts
- 10 Differences Between Symmetrical, Ascending Triangle, and Descending Triangle Patterns
- 11 StocksToTrade
- 12 Conclusion
What Is an Ascending Triangle Pattern?
An ascending triangle pattern is exactly what it sounds like. It’s a triangle that’s going up on a stock chart.
You have resistance across the top and uptrending price. The price action needs to connect with resistance and the trendline at least twice.
An ascending triangle is often a signal that a breakout is about to continue. Sometimes they form at key resistance levels and signal a breakout.
As a result, buyers get excited. Short sellers get scared. A breakout becomes more likely.
It can be a great pattern for just about any setup. Stick around and we’ll get to some examples. Before we do that, let’s answer a key trading question…
Why Is the Ascending Triangle Pattern Important?
Spotting this pattern in real time on a chart can help you take your trading game to the next level.
If you’re already long a trade or looking to get into a breakout, this pattern is a great indicator of strength.
The trendline tells you which direction the stock price is likely headed. The resistance line gives you a clear breakout level to help you plan your trade.
Why Does an Ascending Triangle Pattern Form?
Ascending triangles often form when a stock has big sellers at a certain level. Someone’s trying to hold the stock down. That could be profit-takers, bag holders, or short sellers.
And investors and traders may be interested in buying the stock. When it hits resistance again and the stock doesn’t come down quite as far, the higher lows are in. That’s where you can draw a trendline.
At this point, savvy traders may see an ascending triangle forming. The pattern becomes more obvious when it bounces between the trendline and resistance.
Then more buyers become interested…
If the shorts are wise, they’ll take note and cover their positions and become buyers themselves. This can force other shorts to cover as the stock price breaks out into a short squeeze.
How to Identify an Ascending Triangle Pattern on Charts
It’s a process. I always say you gotta let trades come to you.
When all you’ve got is a hammer, everything looks like a nail. So don’t go thinking every higher low is a triangle. Let the pattern fully develop.
First, there will be a big run-up, almost like the pole on a bull flag setup. It’s not always perfect. It might slant. Or there might be some pullbacks in the run-up. That’s part of what distinguishes an ascending triangle from a bull flag.
Then, there’s a pullback with a bounce. It’s nice if the pullback is clean, but it’s not always. You can find the bottom when the stock price makes a strong push back toward resistance.
Ideally, it’ll come all the way back up to the same price it fell from before. That gives you the second point, and you can draw an even horizontal line across the top.
Now, if it falls all the way back to the first low, it’s in a channel. You don’t want that. You want it to come back down, but not all the way. Then you can draw your trendline across those higher lows.
After that, you should have a flat line across the top and a diagonal line across the bottom.

Ascending Triangles Turn Bearish
Here’s a classic trading adage: “The trend is your friend.”
As longs are buying up shares, they’re keeping a close eye on that trendline.
If the trend fails, it’s game over. Buyers get skittish and abandon their positions. Short sellers get aggressive. The whole breakout can turn bearish.
We’ll talk about stop losses and how to plan your trade, but first let’s talk about a buyer’s best-case scenario.
Bullish Ascending Triangle Patterns
Ascending triangle patterns are great bullish patterns. The build-up and the breakout can be so obvious once you learn to spot it. With experience and practice, you can spot these breakouts from a mile away.
It’s difficult to build a screener to find intraday ascending triangle patterns. That’s why I look for top percent gainers.
I use StocksToTrade for all my scans. I think it’s the best tool for the job. This platform has over 40 built-in scans, and you can customize your own scans, too. Get a 14-day trial for just $7 to see how powerful scanning with StocksToTrade can be.
Once you find that top percent gainer, find that key resistance level. Watch the advancing support and wait for the price to squeeze up through the top.
Ascending Triangle Pattern Examples
Let’s look at some examples. You can see the pattern on this chart for BioRestorative Therapies, Inc. (OTCPK: BRTXQ).
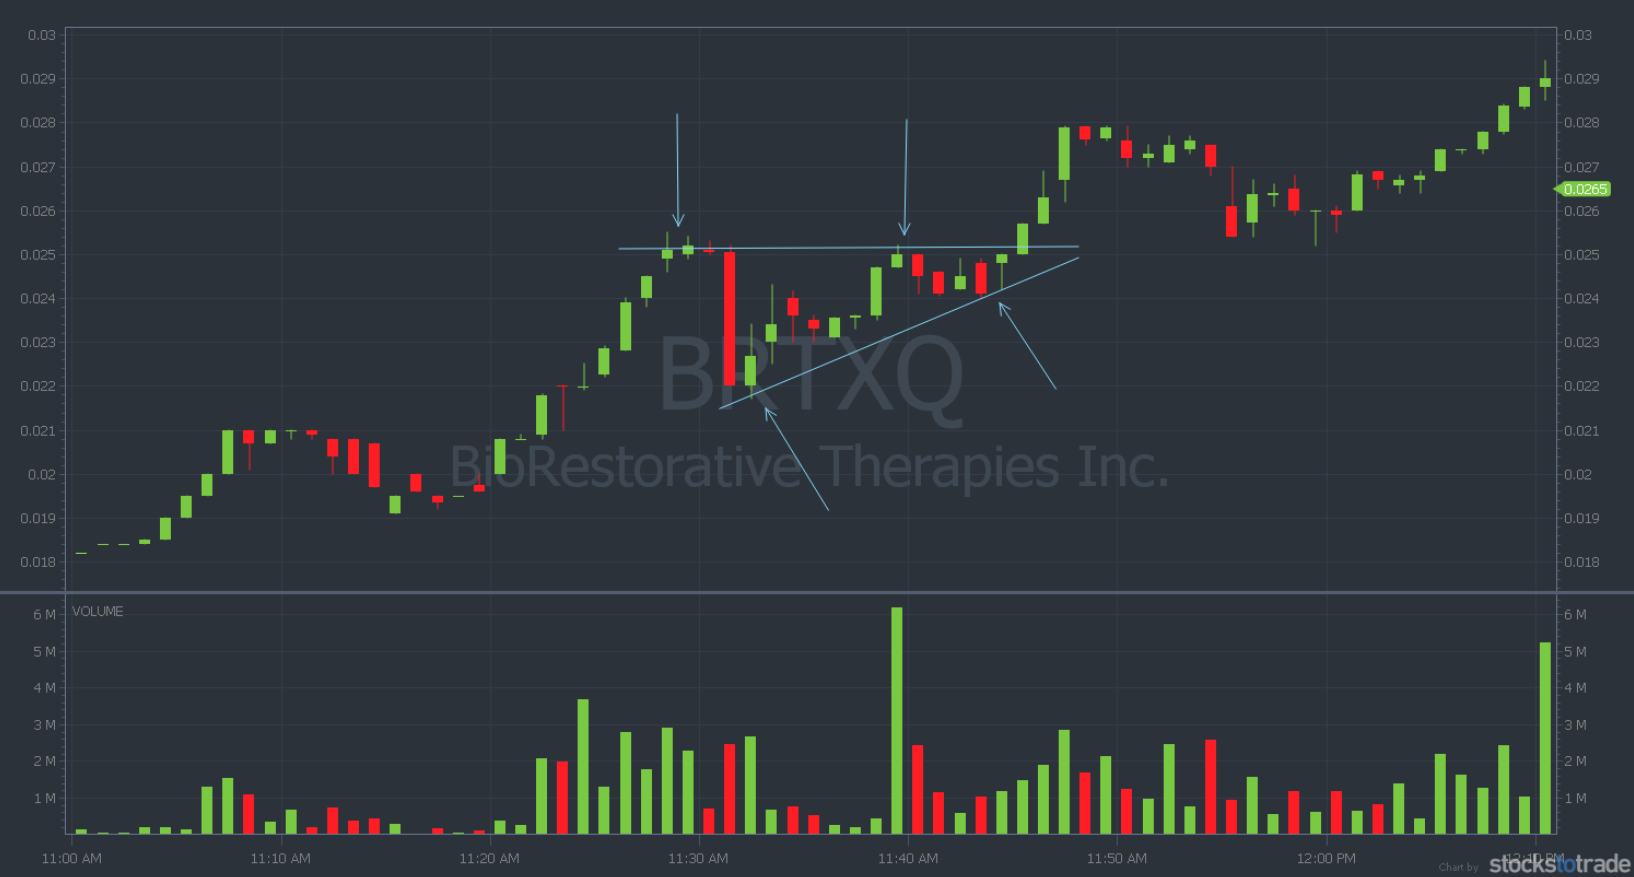
BRTXQ: 1-day, 1-minute chart, ascending triangle breakout (Source: StocksToTrade)
But look at this Tracon Pharmaceuticals, Inc. (NASDAQ: TCON) chart. Here, once the trend breaks, so does the pattern. And the setup turns bearish.
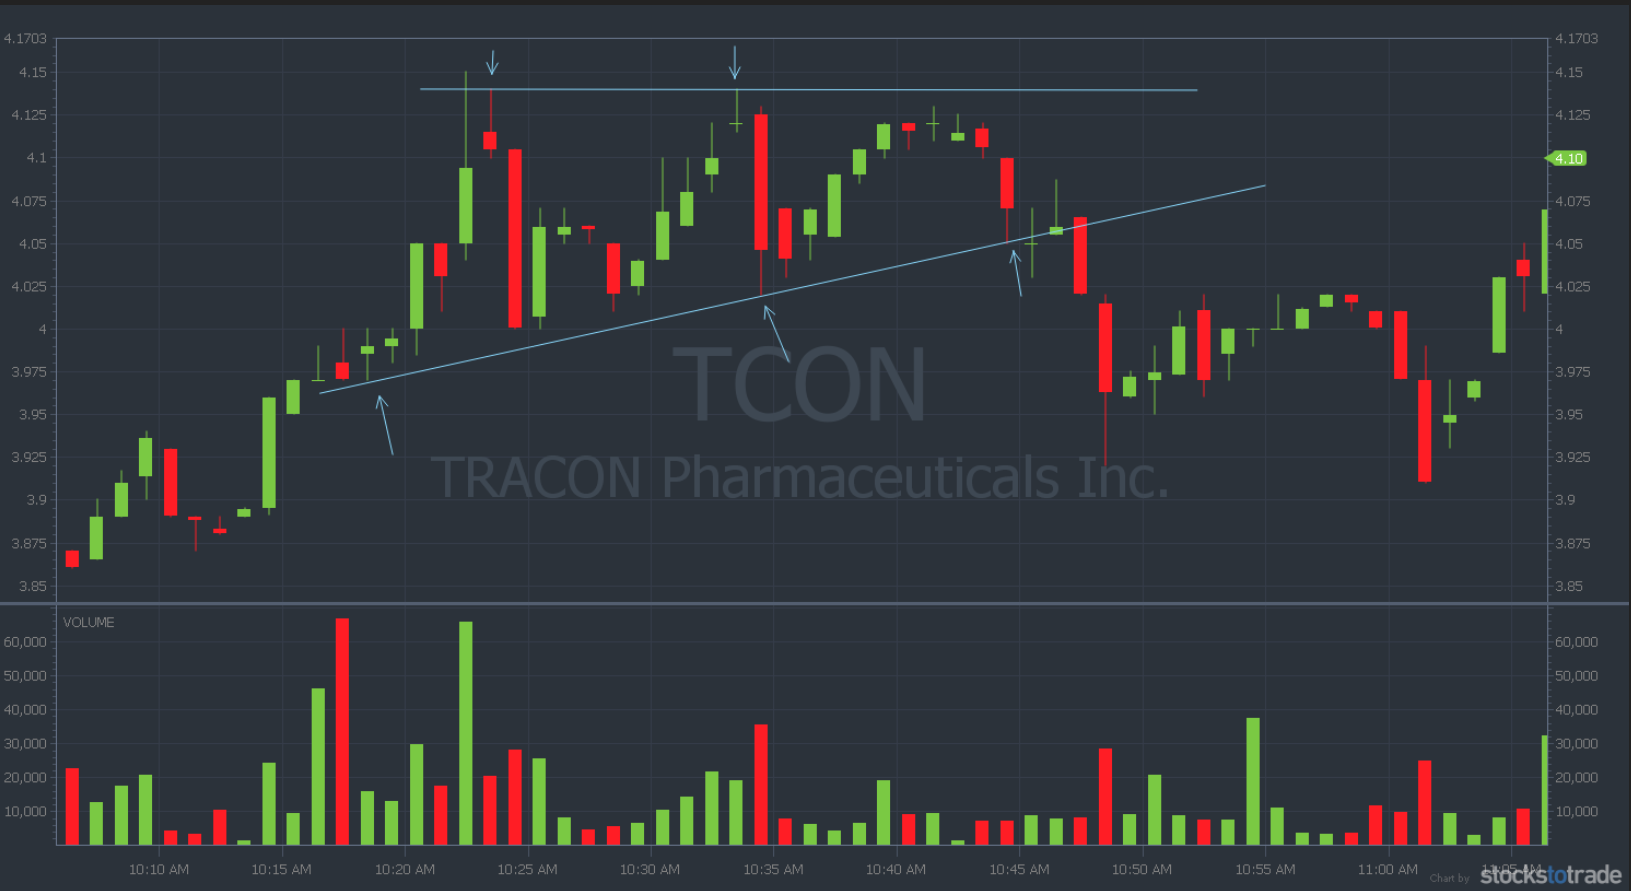
TCON: 1-day, 1-minute chart, ascending triangle bearish (Source: StocksToTrade)
TCON recovered later in the day, but this is important to note. Certain indicators could have clued buyers in before the breakdown. But we’ll save that for another day.
Here’s an example of the ascending triangle pattern playing out on the daily chart for Party City Holdco Inc. (NYSE: PRTY). As you can see, it’s a little rough. That’s common in a volatile market.
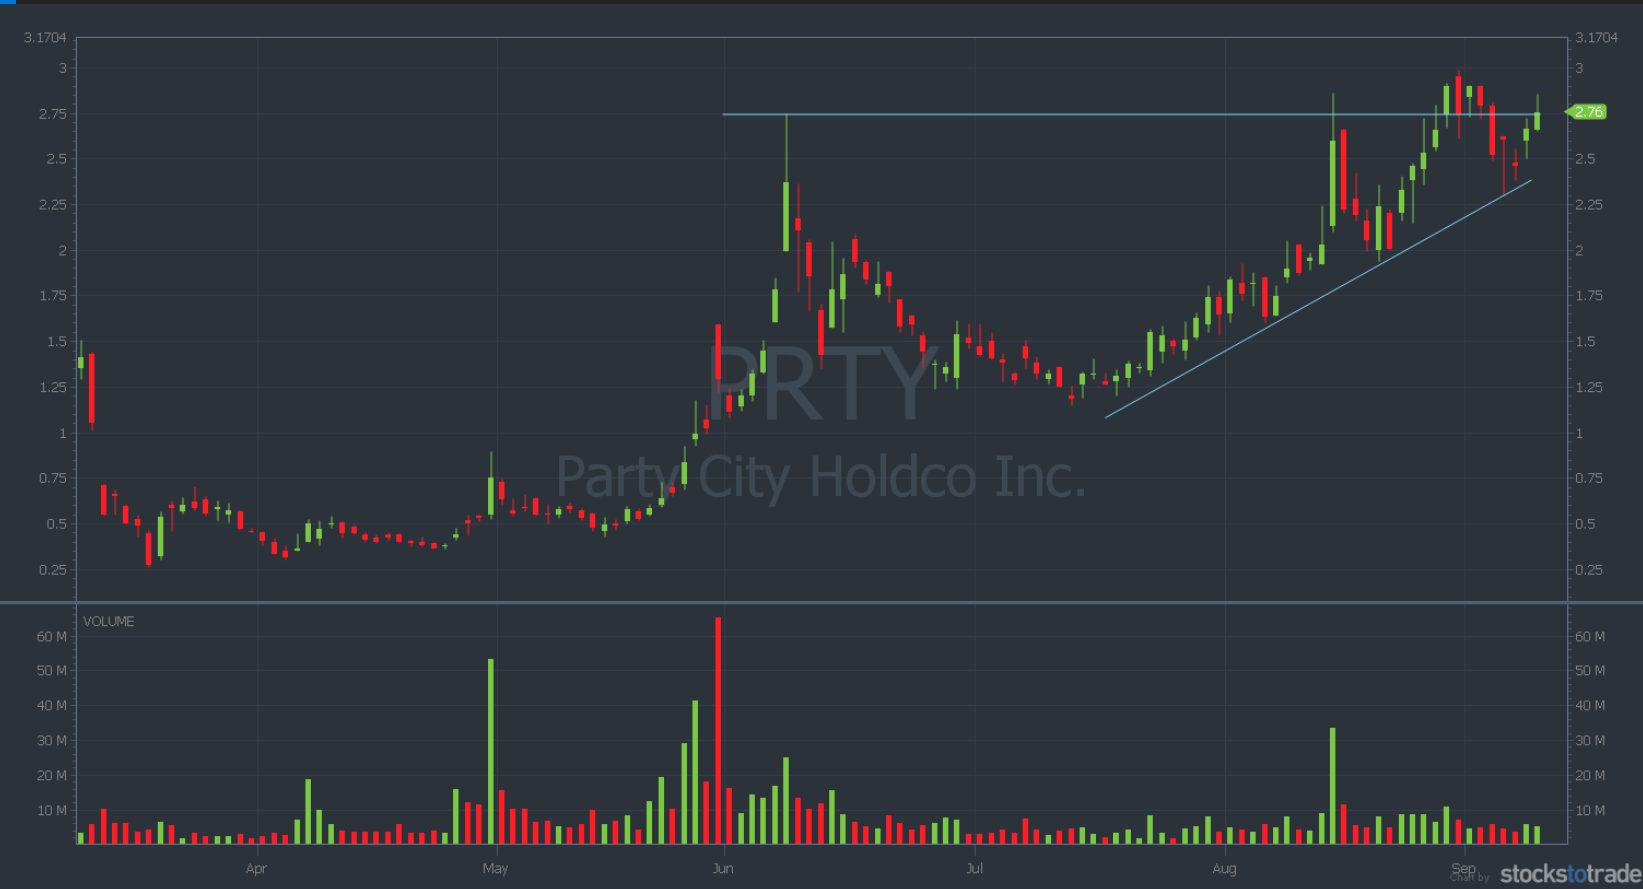
PRTY: 6-month, 1-day, ascending triangle daily (Source: StocksToTrade)
Ascending Triangle Pattern: How to Spot Breakouts
Check out the example of BXRT above. Once it hits resistance and builds that trendline, the price starts to coil in the corner.
If it breaks that key resistance level, it’s a breakout.
How Do You Trade an Ascending Triangle Pattern?
I like certainty and consistency in my trading, so I prefer to wait for the breakout. Watch the pattern develop. You never know for sure if that trendline will crack.
Wait for the stock to prove itself. Then, when it breaks that key level, I might take a long position.
No breakout is perfect, so set a stop loss at that highest low before the breakout. There might be a little pullback after the breakout. As long as the price holds above the last low before the breakout, the pattern is still intact.
Ascending Triangle Measuring Technique
There’s a technique for measuring ascending triangles … It can give you a clear price target for your breakout.
Start with the first pullback. The stock comes up, hits resistance, and pulls back to support.
The distance from resistance to the first low is how far the stock should move after the breakout. If resistance is $1, and it pulled back to 75 cents, $1.25 is a reasonable price target. Here’s how to break that down:
- $1.00 – 75 cents = 25 cents
- $1.00 + 25 cents = $1.25
It’s not exact, so don’t get stuck on setting a perfect exit. Your target is a general guideline.
Ascending Triangle Pattern Trading Limitations
You have to be quick when the breakout happens … But you can’t be too early or you can risk getting faked out. Remember, it’s all about timing.
The key to the ascending triangle breakout is that trendline. The trendline has to hold, or the pattern won’t play out. It might still hold support and break out later, but that’s a different setup.
Triangle Breakouts Like Ascending Triangle Breakouts
Ascending triangle breakouts aren’t the only kind of triangle breakouts.
There are also symmetrical triangles, descending triangles, wedges, and bull flags. These are variations of triangle breakouts.
Triangle Pattern Breakouts: Chart Examples
The problem with a symmetrical triangle breakout is that it’s hard to tell if it will break up or down. Fortunately for longs, Novan, Inc. (NASDAQ: NOVN) broke out on this chart. Check it out:
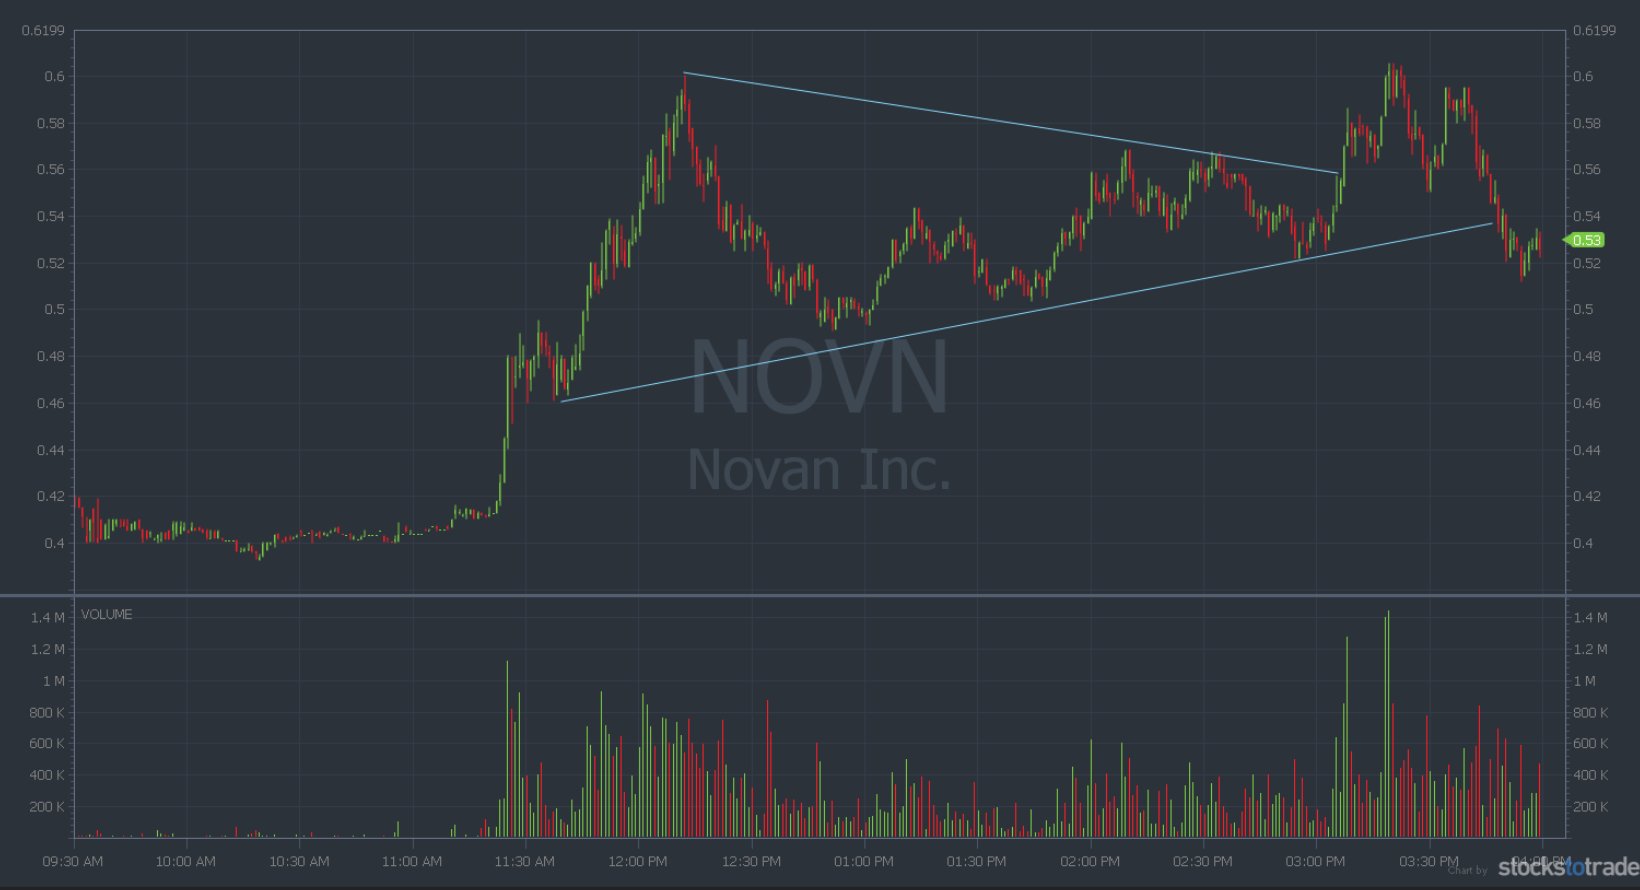
NOVN: 1-day 1-minute, symmetrical triangle pattern breakout (Source: StocksToTrade)
A few months ago, Renren, Inc. (NYSE: RENN) showed the potential of a bull flag in this classic pattern setup. It hasn’t done much but fade since.

RENN: 6-month 1-day, bull flag breakout pattern (Source: StocksToTrade)
But RENN did manage to break out of a descending triangle pattern. There was a brief dip under the support level, so it’s not perfect. But it’s still a good example.
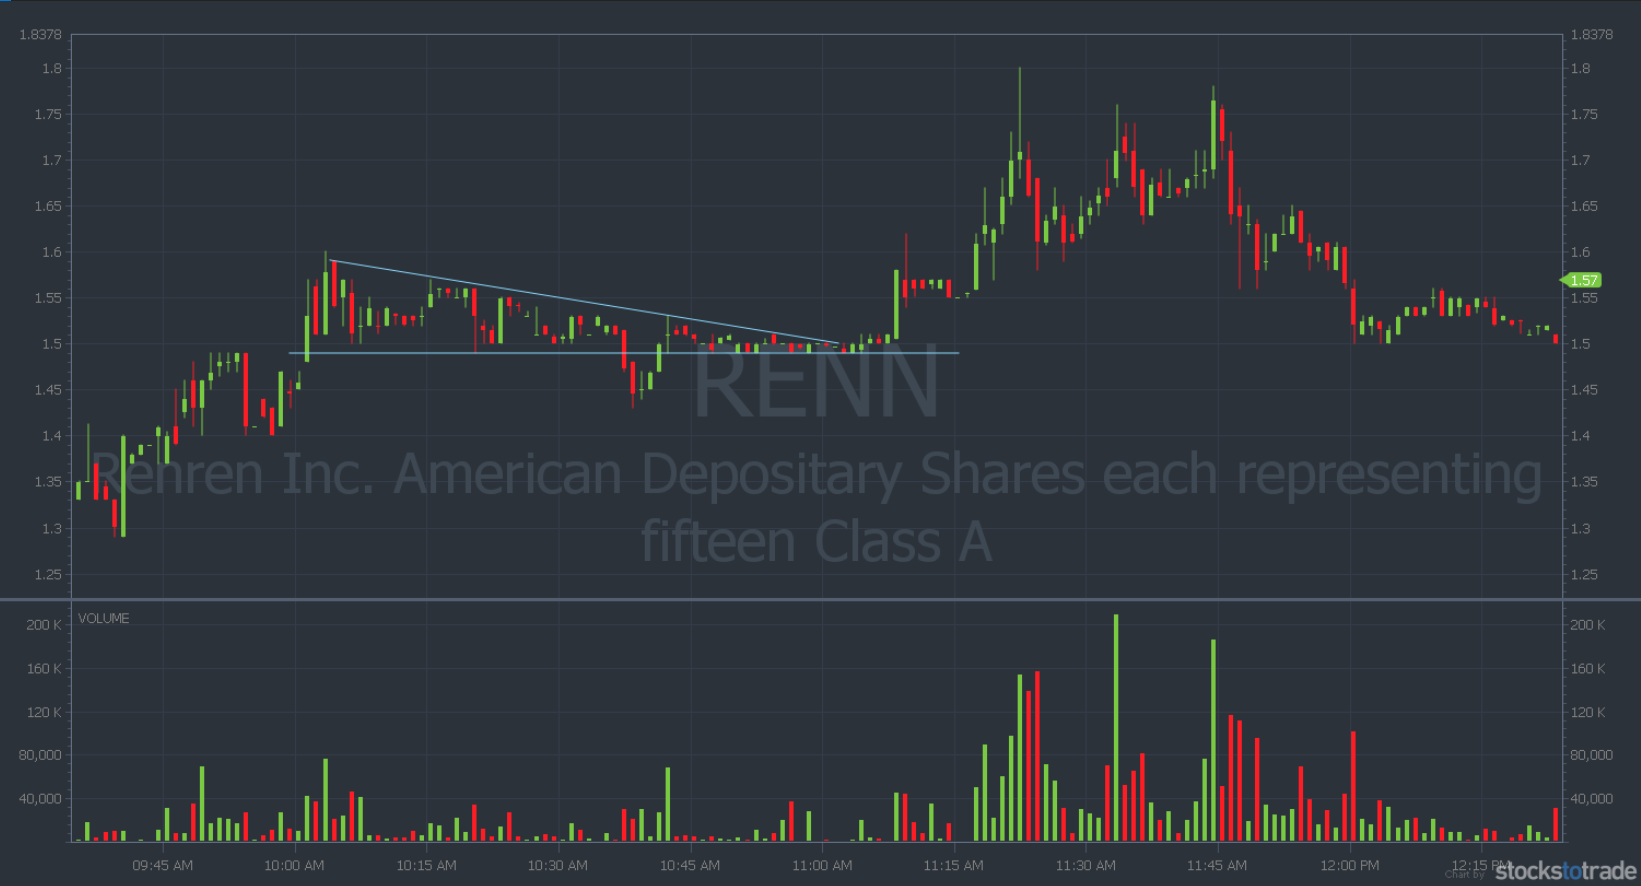
RENN: 1-day 1-minute, descending triangle breakout (source: StocksToTrade)
Differences Between Symmetrical, Ascending Triangle, and Descending Triangle Patterns
With symmetrical triangles, you’ve got an even amount of space on either side. In essence, your baseline is right down the middle.
With a descending triangle, you’ve got a flat line of support across the bottom and a downtrend across the top.
Whether symmetrical and descending triangles are bullish or bearish depends on the context. It’s best to wait for signals to tell you which way the stock is headed.
With an ascending triangle, you’ve got resistance across the top and a rising trendline on the bottom. Ascending triangles are a clear bullish signal.
StocksToTrade
Trading is a business. You have to have the right tools for the job.
I think using StocksToTrade every day is one of the best things that you can do to help your trading. There are tons of features, including beautiful charts, built-in scans, indicators, and so much more. And we’re always working to improve. You can try it here for 14 days — it’s just $7.
That’s two weeks of awesome trading software for less than a combo meal at a fast-food joint.

Conclusion
Triangle patterns — in all their variations — can help you find trading opportunities. Learning to spot ascending triangles is a great tool no matter your level of market experience.
Want more resources for trading? Would you like to learn alongside traders who work to improve day in and day out? Come join the SteadyTrade Team!
We talk stocks, technical analysis, and go over trade plans every single day. I go live twice, sometimes three times per day, to discuss the market, patterns, and setups.
And you can get mentorship from me, Michael “Huddie” Hudson, and Kim Ann Curtin. It’s also where you can be a part of a community of up-and-coming traders.
If you want to find consistency in the markets, it’s smart to start with your education. And it’s good to work with established mentors who know what it’s like to find a stride in the markets. That’s what the SteadyTrade Team is all about.
Looking for even more resources? Check out the SteadyTrade and TWIST podcasts. It’s a completely free resource that can help you dive deeper into the world of trading.
What’s your experience trading ascending triangle patterns? Reach out and leave a comment below. I love hearing from you!