
The ABCD pattern has been around forever.
But what is it really?
Let’s put it this way … Once you know the ABCD, it’s easy as 123.
The ABCD pattern is simple and a great starting point for newer traders. In fact, it’s one of the first patterns I learned to trade. It’s also known as the gun pattern. Let’s get into it…
Table of Contents
- 1 What Is the ABCD Trading Pattern?
- 2 What’s the Importance of the ABCD Trading Pattern?
- 3 How to Start Trading Using the ABCD Trading Pattern
- 4 Examples of ABCD Patterns
- 5 Tips to Trade the ABCD Pattern
- 6 Common Mistakes in ABCD Pattern Trading
- 7 How Do I Find an ABCD Pattern?
- 8 ABCD Pattern: The Bottom Line
What Is the ABCD Trading Pattern?
The ABCD pattern is an intraday chart pattern. It’s when a stock spikes big, pulls back, then grinds ups and breaks out to a new high of the day.
There’s a letter for each price movement:
- A: Morning rally to a new high
- B: Midday pullback and consolidation
- C: Higher low and grind up breaks through the morning high
- D: Rally to a new high of the day
What’s the Importance of the ABCD Trading Pattern?
The ABCD pattern helps give traders a framework for where to risk and enter their trades. This prevents chasing a stock and getting shaken out in the midday pullback.
It’s also the basis for a lot of other long patterns like the VWAP-hold, high-of-day break and the OTSwizzle.
These build on the ABCD pattern, so know it inside and out!
How to Start Trading Using the ABCD Trading Pattern
Let’s break it down, step by step…
Step 1: Look At All Indicators
The ABCD pattern is an intraday pattern. So, you need to consider the multiday chart too.
Ignore the stock if there’s a lot of resistance overhead or if it has one-and-dones.
I know I say this time and time again, but you must have all your ducks in a row before jumping into a trade. Do your research first.
If the stock has broken through multi-year resistance and the multiday chart shows it can hold its gains … it’s likely tradable.
Another key indicator to consider is volume. That’s the second most important indicator after price. The stock has to have a large amount of volume.
It’s also ideal if it’s in a hot sector, has a low float, and has news to boot. Sometimes, a crazy hot sector is all it takes to push a stock through a successful ABCD pattern.
Step 2: Patience Pays
Imagine watching a stock spike and then continue to grind higher and higher without you. Can you feel the frustration and FOMO building?
You have to accept this will happen … and be OK with missing the trade.
Chasing is not a strategy. A stock that keeps grinding higher all day is not an ABCD pattern stock. It won’t have the clear risk you need.

So be patient.
It’s tough missing a play just because it doesn’t meet all your criteria. But remember, the more selective you are — the better your odds.
Step 3: Set Alerts
Alerts can be a great aid if you don’t have time to watch the market all day. Or they can help avoid the temptation to jump in early.
Set an alert for when the stock approaches the top of the A leg in the afternoon. This lets you be ready for breakouts without having to watch every tick.
Then, check back in the afternoon — after 1 p.m. or so — to see if the stock’s grinding back up.
You can easily set price alerts in StocksToTrade. Combine that with beautiful charts and powerful scanners — it’s no wonder so many top traders love it. It’s designed by traders for traders. Start your 14-day trial today for only $7!
Step 4: Enter Trade
This is where you place your trade.
Your entry should typically be your C when the stock breaks the high of day in the afternoon.
Be sure to use proper risk management.
Step 5: Stick to Your Plan
Take the gain … and the loss.
If the stock breaks your risk level, get out immediately. Be prepared for that possibility. No moving your stop, and no holding and hoping. Just cut and move on. There will be another ABCD pattern around the corner.
If the stock makes a leg up through the high of day, aim to sell using at least a 2:1 risk/reward. Sell into strength or when it looks like the stock might reverse.
If the stock looks exceptionally strong, you could sell half at your target and let the rest run.
Keep in mind that if you trade penny stocks, these companies aren’t good companies. To be successful at trading penny stocks, you have to sell into the afternoon rally and not get greedy.
Want to learn more about how the pros trade stocks like these? Join Small Cap Rockets where three top traders send you real-time educational alerts to accelerate your trading knowledge to warp speed. Start your 14-day trial of Small Cap Rockets and StocksToTrade today!
Enough with the theory, let’s look at some charts…
Examples of ABCD Patterns
ABCD Pattern Example #1: Clover Health Investments Corp. (NASDAQ: CLOV)
On June 8, CLOV shot up on incredible volume and aggressive Redditor buyers. It became the meme stock du jour.
Once it squeezed through its all-time high of $17.24 in the morning, it rallied all the way to $24.93. This formed the A leg of the ABCD pattern.
Note the spike in volume at the morning high of the day. Then a sharp pullback to the breakout level formed the B leg.
The C leg was formed after some consolidation through the afternoon.
Usually, I’d wait for an afternoon high-of-day breakout. But this stock had a number of indicators that made an afternoon entry into the C leg ideal as long as it was closing strong:
- Hot sector (meme stock)
- 52-week breakout
- Incredible volume (over $10 billion volume traded by the end of the day)
- Float rotation (over eight times by the end of the day)
Due to all this, buying the C leg in anticipation of an overnight gap-up creating the D leg was a great setup. The risk would be the bottom of the B leg.
Remember, this was a perfect storm setup. Buying the C leg before the high-of-day breakout typically doesn’t work. The stock gapped up over 15% at the market open the following day.
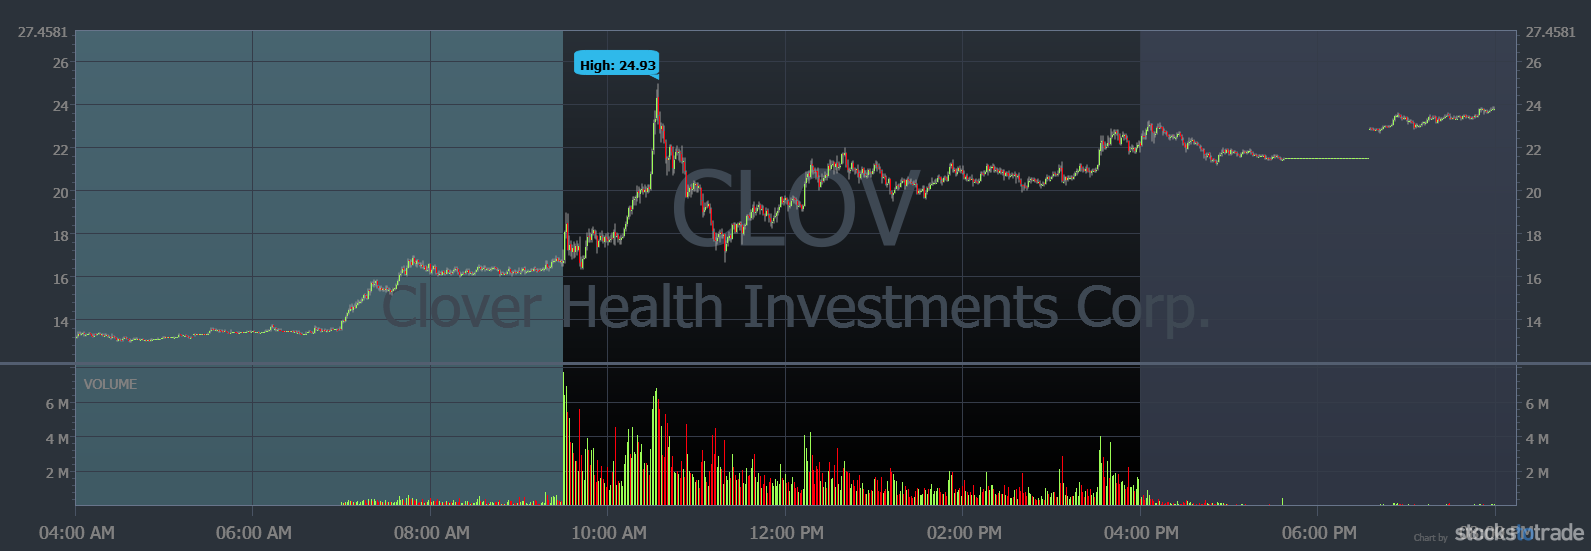
Clovis Health 1-day chart (Source: StocksToTrade)
ABCD Pattern Example #2: Amazon.com, Inc. (NASDAQ: AMZN)
This is a blue-chip stock that’s out of range for a lot of traders … But it recently formed an ABCD pattern.
On July 6, the U.S. Department of Defense canceled a $10 billion contract with Microsoft Corp. (NASDAQ: MSFT). Amazon’s likely to receive the contract … And the news propelled AMZN through a strong resistance around the $3,500 level.
This is one of the strongest resistances I’ve ever seen. It’s been forming since September 2020.
The move to the $3,640s formed the A leg of the ABCD pattern. The midday pullback formed the B leg. And the afternoon grind-up formed the C leg.
Here, the entry was when it broke the high of day. The stock then rallied to $3,680, which formed the D leg.
While this wasn’t a huge move, options traders could have played this with call options.
And since the stock closed fairly strong, traders could have swung this overnight. The stock gapped up the following morning to the $3,730 level.
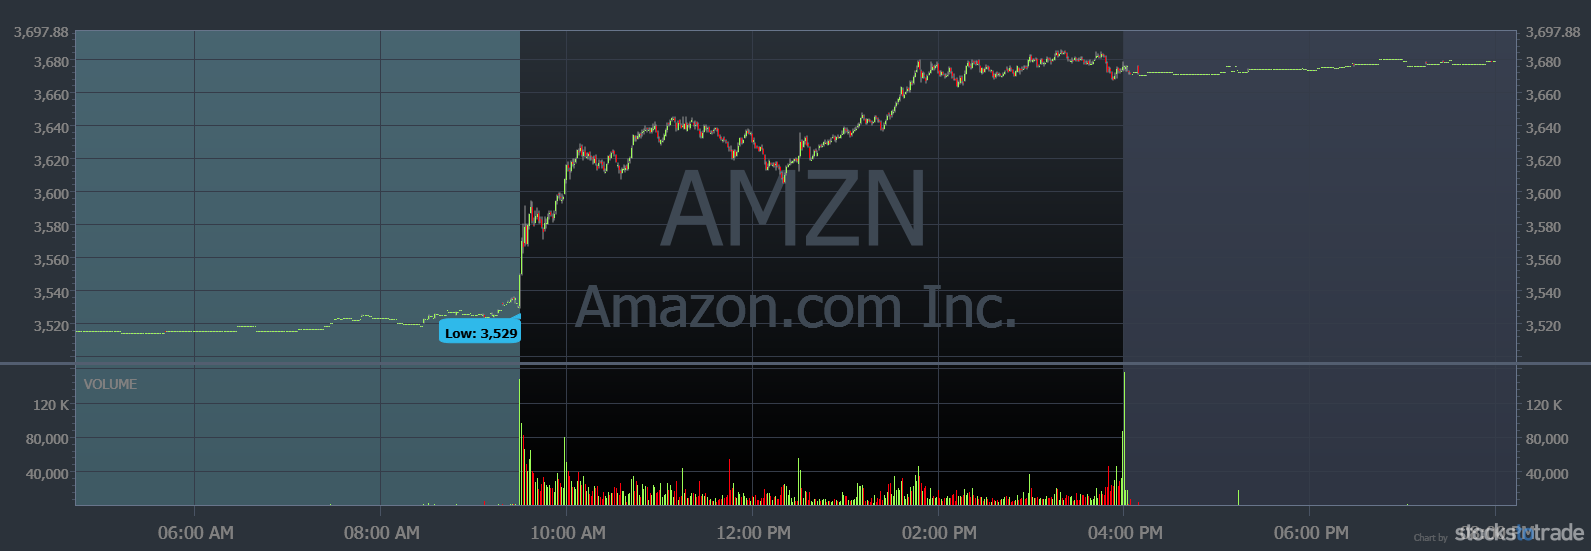
Amazon 1-day chart (Source: StocksToTrade)
ABCD Pattern Example #3: Newegg Commerce Inc. (NASDAQ: NEGG)
On July 6, 2021, Newegg announced it would make rare computer parts available to the public through a lottery system. The company also launched a service to pre-build customers’ computers before they’re shipped.
The following morning, the stock broke out to new multi-year highs. It more than doubled from there!
Look at the chart … The morning rally formed the A leg of the ABCD pattern. The stock then had a pullback, forming the B leg. It then consolidated most of the day and formed the C leg. It broke out late afternoon, which was the entry signal, and rallied 11% from the breakout level.
While this might look like a successful trade on paper, entering at that level had a number of issues:
- Risking the bottom of the B leg would have been poor risk/reward. It was just too far below the breakout.
- The stock was already very overextended. It was on its second green day and up over 300% times from its first green day lows.
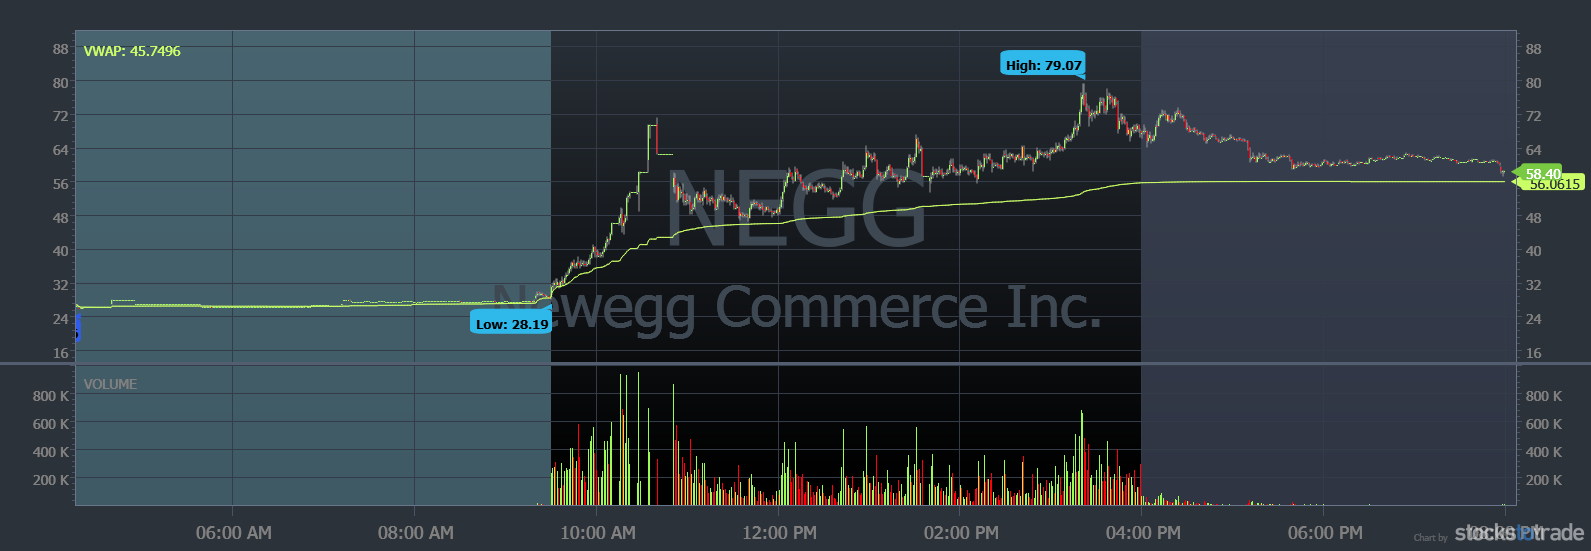
Newegg Commerce 1-day chart (Source: StocksToTrade)
Tips to Trade the ABCD Pattern
The ABCD pattern is simple … but it can be difficult to master. There are a lot of variables to consider compared to other patterns.
Remember, only trade the best setups. You can do that by being exceptionally selective. If the chart’s not perfect enough to print out and put on your wall — ignore it!
It’s one thing to know when to trade, but it’s just as important to know when not to trade. Check off all the boxes of your trading checklist before trading a stock.
I go in-depth on this and more in the SteadyTrade Team. Every day, I host webinars to help mentor traders. My goal is to teach you how to think for yourself and navigate any kind of market. Take your trading to the next level — sign up for the SteadyTrade Team NOW!
For now, let’s look at a few indicators that can help you better understand the ABCD pattern rules…
Entry Point
Traders usually enter an ABCD pattern at the breakout over morning highs. That’s often after 1 p.m. or so.
But remember, you set your risk at the bottom of the B leg. So, if the breakout’s too far away from the bottom of the B leg, it might be best to skip the trade entirely.
In very rare cases, you might buy the C leg before the breakout … like when a stock grinds up and closes strong on massive volume. Go back to the CLOV example from earlier to see that on the chart.
Low Volume on Consolidation
The consolidation should be low volume and a steady grind up. This shows slow and steady buying throughout midday.

If a stock’s very choppy or putting in more volume than the A leg during this period, it’s best to skip it. It might be a sign that there are a lot of short sellers fighting the buyers.
If that’s the case, even if the stock breaks out, it might get stuffed right after.
High Volume on Breakout
The higher the volume on the breakout, the better the odds are of it working.
A low volume breakout shows there isn’t a lot of interest in the stock. It can quickly fake out and form a double top instead of a solid D leg.
Exit Point
Your exit depends on a lot of factors.
If the bottom of the B leg is in a tight range with the morning top of the A leg, you might consider using 3:1 risk/reward as your target.
In other cases, you might consider 2:1. It all depends on what constitutes a reasonable target for that stock.
Some traders try to swing a stock overnight. But more often than not, this can expose you to unexpected downside, so keep that in mind. There might be an overnight offering or just a nasty sell-off…
But if the chart’s great and the market’s really hot — you might consider it. Just take some profits before the close!
VWAP
I love using VWAP so much that I trade a modified ABCD pattern using it — that’s the VWAP-hold, high-of-day break.
With that setup, I’m trading the ABCD pattern, but I also want the stock to hold VWAP all day. If the stock’s under it, I’m not interested. I weed out a lot of undesirable plays this way.
Common Mistakes in ABCD Pattern Trading
Let’s get into some common errors with this pattern…
Getting In a Bad Risk/Reward
You may want to buy every ABCD breakout, but know that if the midday pullback is large, the risk/reward at the breakout level will be poor.
The aim is to make two to three times that risk. So, for every ABCD setup, consider whether that’s a reasonable target. If not, don’t trade it.
Getting in Too Early
When watching an ABCD pattern play out, it’s tempting to jump into the consolidation level of the C leg before the 2 p.m. window.
But this sets traders up for failure. They’re not meeting the key criteria for trading ABCD patterns.
If you can’t resist, try setting price alerts and physically stepping away until the right time of day.
How Do I Find an ABCD Pattern?
First, you need a stock scanner. I scan for ABCD patterns using StocksToTrade. It has 40+ built-in scanners or you can customize your own scans.
Let’s look at some basics for finding an ABCD…
Step 1
Use StocksToTrade’s ‘Top Percent Gainers’ scan in the morning. This should bring a handful of stocks.
Step 2
Next, choose only the most ideal stocks to watch. Think hot sector, news, high volume…
Set price alerts just below the morning highs of each candidate. This will help you catch potential afternoon breakouts.
Step 3
Here you can take a break. Go for a walk, make coffee, study video lessons.
Step 4
Come back after 1 p.m. to prep for the 2 p.m. window I always mention.
Step 5
If one of the stocks on your watchlist breaks the morning high of day, you’ve found an ABCD pattern!
ABCD Pattern: The Bottom Line
The ABCD pattern is one of the most basic patterns to learn. It requires you to be selective when picking a stock, but it offers a clear risk level.
As with any pattern, only trade the best setups and at the right time of day. This setup can work especially well in hot sectors.
To learn more about trading patterns, check out my e-book, “Trading Made Simple: 10 Patterns Traders Need to Know.”
Do you trade the ABCD pattern? Or do you trade a different pattern? Leave a comment below!