
The head and shoulders pattern is a classic.
So if you’re looking for a new chart pattern to add to your arsenal…
Why not learn a classic pattern that traders have used for decades, if not longer?
Bonus: this pattern can potentially be useful for both active trading and investing…
The head and shoulders pattern is a well-known and often-used chart pattern. It’s not hard to find traders discussing stocks with head and shoulders patterns. We often watch for it with our SteadyTrade Team trading mentorship program.
In this post, you’ll learn all about the head and shoulders pattern rules and how to find these setups. Plus, we’ll cover what to do when you locate one, as well as which chart time frame to focus on. This is a big one!
Let’s get to it…
Table of Contents
What Is a Head and Shoulders Pattern?
There are thousands of documented chart patterns … but not all are equal.
The head and shoulders pattern is one of the most well-known patterns. Pick up any book on technical analysis, and this pattern will most likely be one of the first you read about.
On a stock chart, the head and shoulders pattern has three peaks, with the middle peak being the highest.
To understand the pattern name, think of the two outside peaks as the shoulders and the middle peak as the head. Check it out on the chart below:
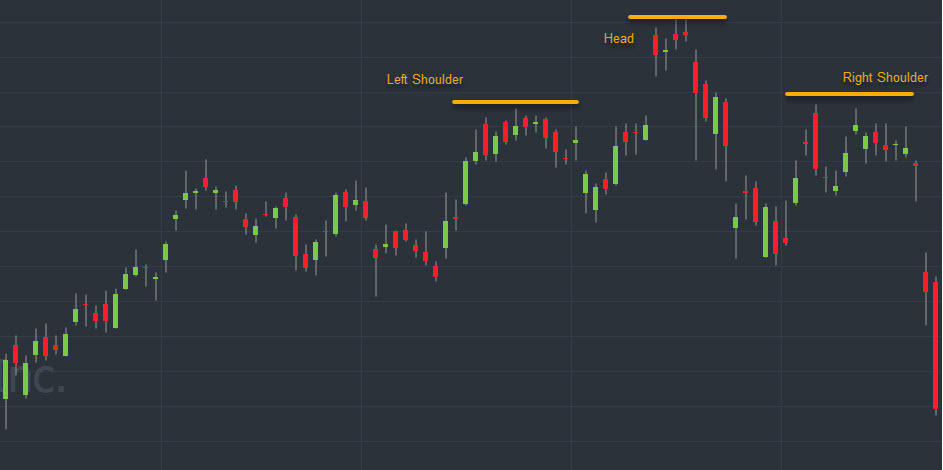
Delta Air Lines Inc. (NYSE: DAL) head and shoulders chart pattern (Source: StocksToTrade)
Traders and investors watch this pattern as it can signal a change in market trend. It can be highly useful for finding trade setups that meet your risk/reward criteria.
What Is the Neckline?
Before we dive into the intricacies of trading this classic pattern, it’s important to understand the related terminology. A term you’ll hear a lot is ‘the neckline.’
The neckline is the swing level that the price returns to after the first shoulder and head portions of the pattern form.
Chartists use the neckline as a point to determine whether they’re looking at a valid head and shoulders pattern. They often base their trade entry around the neckline as well.
Once you understand the idea of the three peaks and the neckline, you’re almost ready to add this pattern to your trading arsenal. Now, let’s go deeper…
Benefits of Trading a Head and Shoulders Pattern
If you’ve been around the markets a while, you’ve probably learned about several chart patterns … You may even wonder which one you should focus on.
First, let me say that the smartest pattern to trade is the one that stands out to you. It’s the pattern your eye is drawn to and that you recognize. It could be a head and shoulders or any other number of patterns.
But there are some benefits that come with the head and shoulders pattern…
First, just about every trader will know what you’re talking about with this pattern. That can make it easier to discuss it with your trading community. Sometimes you need a second opinion — whether that’s in a trading chat room or on social media.
Second, the head and shoulders pattern is found when there’s a change in trend direction. If you know what you’re doing, you can potentially find trade setups that meet solid risk/reward criteria.
The third reason for trading this pattern may be the best … It can help you figure out where place your stop-loss. Many conservative traders place their stops just above the head, while more aggressive traders will use the second shoulder as a stop.
This pattern has a lot going for it. But make sure it sits well with you before trading it with live money. It’s a good idea to back-test your trading strategy. You can even paper trade to develop your trading skills before taking a new strategy to the market.
Examples of a Head and Shoulders Pattern
Let’s take a closer look at the head and shoulders with a few examples of the pattern on real stock charts.
The Traditional Head and Shoulders Pattern
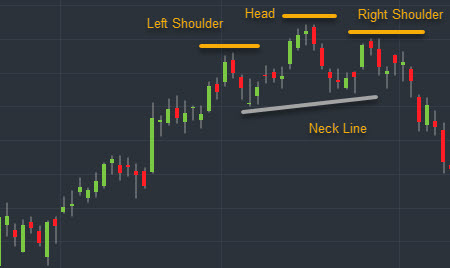
Head and shoulders pattern — uptrend turning into a downtrend (Source: StocksToTrade)
Here we can see that price was in an uptrend before the stock formed a head and shoulders pattern.
As the stock breaks below the neckline, we see heavy selling pressure as traders realize that the uptrend is over.
The Inverse Head and Shoulders Pattern
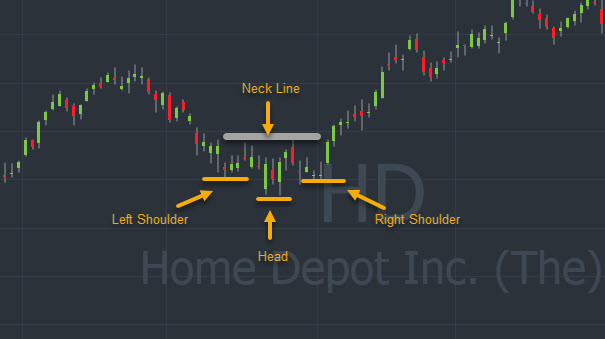
Home Depot Inc. (NYSE: HD) inverse head and shoulders pattern with price bottom (Source: StocksToTrade)
The head and shoulders pattern also works to signal a change from a downtrend to an uptrend. This is called an inverse head and shoulders pattern.
In the chart above, we see a short-term downtrend before the stock swings back into an uptrend after it forms an inverse head and shoulders pattern.
Why the Head and Shoulders Pattern Works
Some traders and investors are skeptical about technical analysis and charting in general.
These uneducated traders like to argue that price is random and charting is a waste of time…
I couldn’t disagree more. Price action isn’t random — it’s the result of the decisions of countless traders and investors buying or selling a stock.
When a stock forms the right shoulder, it indicates that the market buying pressure can’t push the price any higher. Then, when the stock breaks below the neckline, it’s a signal that traders don’t want to buy the stock above recent key swing levels.
You can learn so much from stock charts. Here’s what one top trader has to say about it:
Trading the Head and Shoulders Pattern in 7 steps
Ready to dive in and start hunting for head and shoulders patterns?
While the pattern itself is pretty simple, it’s important to remember that trading is a process. Be smart about it — have a carefully planned process before you start looking for chart patterns.
Here are 7 simple, powerful steps for how a smart trader approaches trading the head and shoulders pattern.
#1 Identify Market Trend
When you first look at a stock chart, you want to determine whether the stock is uptrending, downtrending, or consolidating.
Determining the trend early on can help you develop a game plan more quickly. You’ll know roughly what the stock’s doing, plus it makes it easier to spot the low-risk trade setups.
Some traders won’t buy stocks that aren’t uptrending, and that can generally make things easier.
If you’re more advanced, you can choose to buy downtrending stocks by looking for upward spikes or trend reversals. It’s more complicated but can offer some great risk/reward trades.
Whatever you do, remember to determine the overall trend before anything else.
#2 Plan Your Entry and Stop Losses
If you find a stock in an uptrend, it’s time to buy, right? WRONG!
Smart trading is about research, planning, and strategies. You want to set good entry and exit points.
It’s wiser to enter a trade when the price action confirms your thesis. That could be when the stock breaks out of a key level or shows a price spike on increased volume.
And you should place your stops at prices that make sense … maybe below a previous support level or above a key swing high.
The key lesson is that smart traders are like patient snipers waiting for the best setups — it’s all about the risk/reward potential.
#3 Setting Your Profit Targets
Once you strategically plan your trade and get in, you also want to be strategic setting your profit target and closing out the trade.
There are a lot of ways you can pick intelligent levels to take profits…
You could look for the stock to retest a previous high or test a key round-number level such as $10 or $20. You can also check a stock’s trading range and use it to project the future price movement.
Whatever method you pick, make sure that you’re not just randomly trading on emotions. Try to have a reason for everything you do.
#4 Look at Volume and Volatility
There’s so much information you can learn from the charts, and it’s not just price swings and trend direction.
Two key things are trading volume and price volatility.
Trading volume is how many shares trade in a certain time frame. It’s how you can see whether there are enough buyers and sellers to easily enter or exit a position. It can also help to know whether a price swing is serious or just a random movement.
For example, when a stock breaks out of a key level, if we see heavily increased trading volume at the same time, we often take it more seriously.
Price volatility is how much price moves up or down in a certain amount of time. Some stocks regularly move 5%, 10%, or more in a single day. And others may only move 1% in price in a single trading session.
Generally, more volatile stock movements occur when a stock has a big catalyst — major news, SEC filing, or big investor. It’s anything that attracts lots of excited traders to the stock.
Volatility can help you see how fast a stock is moving, so it can help you set your stops and profit target. Generally, more volatile stocks require wider stop-loss levels, so you don’t get stopped out on random intraday price movement.
Learn more about trading through volatility in this no-cost two-hour guide with Timothy Sykes. I put in an appearance too to help you get the most out StocksToTrade in these wild markets. Get “The Volatility Survival Guide” now!
#5 Stick to Daily and Weekly Time Frames
Some chart patterns work best on intraday charts … some work best on long-term charts. And others seem to work no matter the time frame you’re trading.
The head and shoulders pattern tends to be most useful on long-term charts, like daily or weekly bars.
That’s because you can use this pattern to determine a major change in trend. You want a large number of traders to see the pattern, so they act accordingly and the price pattern plays out.
You may be thinking, but aren’t there short-term trend changes as well on an intraday scale? Of course there are. But short-term and intraday price action tends to be way more volatile and tricky. Many traders find that other patterns such as basic pullbacks or VWAP tests are better for short-term trades.
#6 Look for News Catalysts
How do you find stocks about to make a price move? The simplest way is to look for catalysts.
A catalyst is anything that can move traders or investors to buy or sell a stock.
It can be a news story, company announcement, SEC filing, a big-name investor, or even rumors on social media.
The best traders generally look for powerful news catalysts before the market opens each morning.
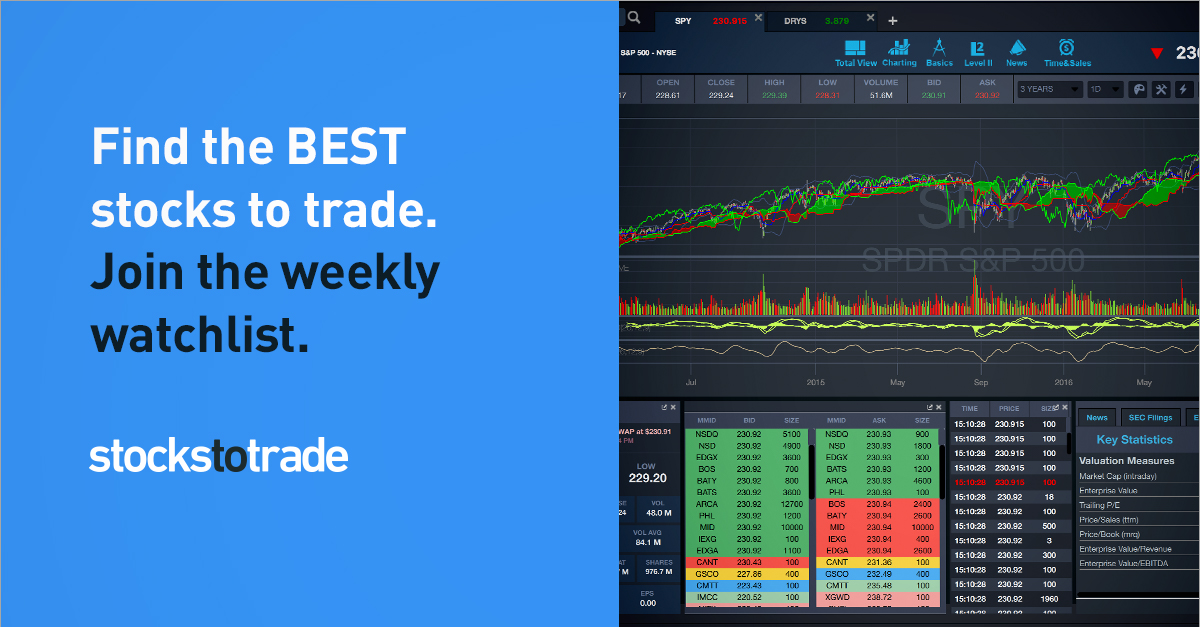
What’s the smartest way to watch for all these catalysts? Use a scanner like StocksToTrade. Here’s how…
#7 Locate the Best Opportunities with StocksToTrade
Over the past six steps, I’ve shared tips for analyzing charts, checking trading volume, watching for catalysts, and more.
Seems like a lot of work, right? Honestly, not that long ago it WAS a lot of work. But thanks to technology it’s so much easier these days.
Today, you can get StocksToTrade. Each morning you can start up your platform, scan the markets for the hottest trading opportunities, and analyze your stocks with a few mouse clicks. Boom — you’re armed and ready to do battle with the markets.
StocksToTrade is a premium trading platform, designed by a team of veteran stock traders to be the ultimate toolset that every stock trader requires.
Scanning, charting, news feeds, algorithms — our platform has it all and more, in one program. Come and check out how powerful StocksToTrade is with a 14-day trial for just $7.
Ready to Get Serious? Join the SteadyTrade Team!
Trading can be lonely, complicated, and painful when you’re just starting out.
Think about it … How many people have a friend or family member who can teach them to trade and chat with them about the markets each day? Not many.
But now you can build a network of serious traders and learn best practices from people who are already making their living trading stocks…
That’s just part of what we do with the SteadyTrade Team, our elite trading mentorship and community.
As a SteadyTrade Team student, you’ll have access to my daily market webinars, regular trader training sessions, access to our amazing chat room, and so much help you to get up to speed in the markets with a trading strategy that suits YOU.
I think of the SteadyTrade Team community like an elite team of driven, ambitious traders. We all want to do our best, and we all strive to help other members do their best as well. Sound like something you want to be a part of? Come join the SteadyTrade Team today.
(Psst … connect with me every trading day premarket! Get the full details here.)
The Bottom Line
The head and shoulders is an all-time classic chart pattern, and most traders are familiar with it.
The pattern can alert you to some good risk/reward trading setups, but there’s a lot more to trading smart than just finding a certain chart pattern.
Whatever chart pattern works for you — head and shoulders, bull flag, pennant, supernova, or anything else — it’s important to have a process for every trading setup.
The above tips will get on track when building a trading plan around the head and shoulders pattern. And if you put in the work in, you can gain a lot of confidence from those tips. Remember to practice!
Serious about honing your trading skills with an awesome team? Check out our mentorship program, the SteadyTrade Team — join us today!
Everyone has a favorite chart pattern — right now I love the dip and rip. What’s your favorite chart pattern? Tell me below in the comments!