
Navigating the world of stock trading can be daunting for beginners, but understanding how to read stock charts is a fundamental skill that can demystify the process and enhance your trading decisions. Stock charts provide a visual representation of a stock’s performance over time, offering critical insights into its price history, trading volume, and potential future movements.
Read this article because it gives the 50,000-foot view on reading stock charts, a fundamental skill for enhancing your trading decisions in the stock market.
I’ll answer the following questions:
- What is a stock chart?
- How does a stock chart work?
- How do investors use stock charts?
- What are the benefits of reading stock charts?
- What types of charts are there?
- How can understanding demand and supply influence chart reading?
Let’s get to the content!
Table of Contents
- 1 What Is a Stock Chart?
- 2 Benefits of Reading Stock Charts
- 3 Types of Charts
- 4 Stock Chart Patterns to Analyze
- 5 A Guide To Reading Stock Charts
- 6 Fundamental Analysis vs Technical Analysis
- 7 Stock Market Trends: How To Identify Trends on Charts
- 8 Key Takeaways
- 9 Frequently Asked Questions
- 9.1 What Do Chart Patterns Mean?
- 9.2 What Are the Different Graph Patterns?
- 9.3 What Is the Strongest Chart Pattern?
- 9.4 How Do Brokers and Brokerage Services Support Chart Analysis for Traders?
- 9.5 What Are Key Examples of Chart Patterns Beginners Should Know?
- 9.6 How Can Understanding Demand and Supply Influence Chart Reading?
- 9.7 Why Is It Important to Diversify Investments According to Chart Signals?
- 9.8 How Do Loans and Credit Cards Affect Investment Strategies Based on Chart Analysis?
- 9.9 How Can HELOCs, CDs, and Understanding Market Purposes Benefit Your Trading Strategy?
What Is a Stock Chart?
A stock chart is a graphical representation of a stock’s price movements and trading volume over a specified period. By analyzing these charts, investors can identify trends, patterns, and potential entry and exit points for trades. This visual tool condenses vast amounts of data into an accessible format, making it easier to assess a stock’s historical performance and current state.
How Does a Stock Chart Work?
Stock charts plot price movements against time, with various chart types providing different perspectives on a stock’s performance. Prices are typically shown on the vertical axis, while time is represented on the horizontal axis. These charts can reveal not just the direction of stock prices but also the intensity of movements, through volume indicators and price change.
How Do Investors Use Stock Charts?
Investors use stock charts to make informed decisions by analyzing price patterns, trends, and volumes. This analysis helps in predicting future price movements and in making strategic trading decisions. Whether for short-term trading or long-term investing, mastering stock charts is crucial for navigating the stock market effectively.
When it comes to charting platforms, StocksToTrade is first on my list. It’s a powerful trading platform that integrates with most major brokers.
I use StocksToTrade to scan for news, tweets, earning reports, and more — all covered in its powerful news scanner. It has the trading indicators, dynamic charts, and stock screening capabilities that traders like me look for in a platform. It also has a selection of add-on alerts services, so you can stay ahead of the curve.
Grab your 14-day StocksToTrade trial today — it’s only $7!
Benefits of Reading Stock Charts
Reading stock charts is more than a skill—it’s an essential tool for anyone looking to invest in the stock market effectively. By interpreting chart patterns and trends, traders gain invaluable insights into market sentiment, price movements, and potential future directions of stocks. For example, understanding how investments react to earnings reports or market news can guide investors in making more informed decisions, potentially leading to significant profits.
My experience in teaching has shown that those who invest time in learning chart analysis often have a better sense of market timing, enhancing their ability to capitalize on buying and selling opportunities. This knowledge not only helps in maximizing returns but also in managing investment risks more efficiently.
Enhanced Market Trend Analysis
Stock charts are indispensable tools for identifying market trends. By observing patterns in price movements and volumes, traders can discern the overall direction of the market or individual stocks, helping to align their trading strategies with market dynamics.
Improved Timing for Buying and Selling
Charts offer insights into the best times to buy or sell stocks based on technical indicators and historical price movements. Recognizing patterns like support and resistance levels can significantly enhance the timing of trades, potentially leading to better returns.
Identification of Support and Resistance Levels
Support and resistance levels are key concepts in stock chart analysis, indicating price points where a stock repeatedly stops falling or rising, respectively. These levels help traders understand potential barriers to a stock’s price movement, informing decisions on when to enter or exit positions.
Better Understanding of Stock Volatility
Volatility, a measure of the price fluctuations of a stock, is clearly depicted in stock charts. Understanding volatility is essential for risk management, allowing traders to tailor their strategies to match their risk tolerance.
Recognition of Patterns and Indicators
Stock charts feature a variety of patterns and technical indicators that signal potential price movements. Mastering these patterns and indicators can significantly improve trading outcomes by highlighting opportunities and risks.
Types of Charts
In trading and investing, the choice of chart can significantly impact how data is interpreted and decisions are made. Candlestick charts, for example, offer detailed information on price movements within a specific period, making them invaluable for spotting trend reversals and continuation patterns. Line charts, by contrast, provide a simplified view, ideal for identifying long-term trends.
I’m big on exploring various chart types, including bar, point and figure, and Renko charts, each offering unique perspectives on market data. Understanding these different charts allows traders to adapt their analysis to different trading strategies and market conditions, enhancing their ability to spot profitable opportunities in mega-cap companies like Apple (NASDAQ: AAPL) or monitor broader market trends such as shifts in mortgage rates or the money market.
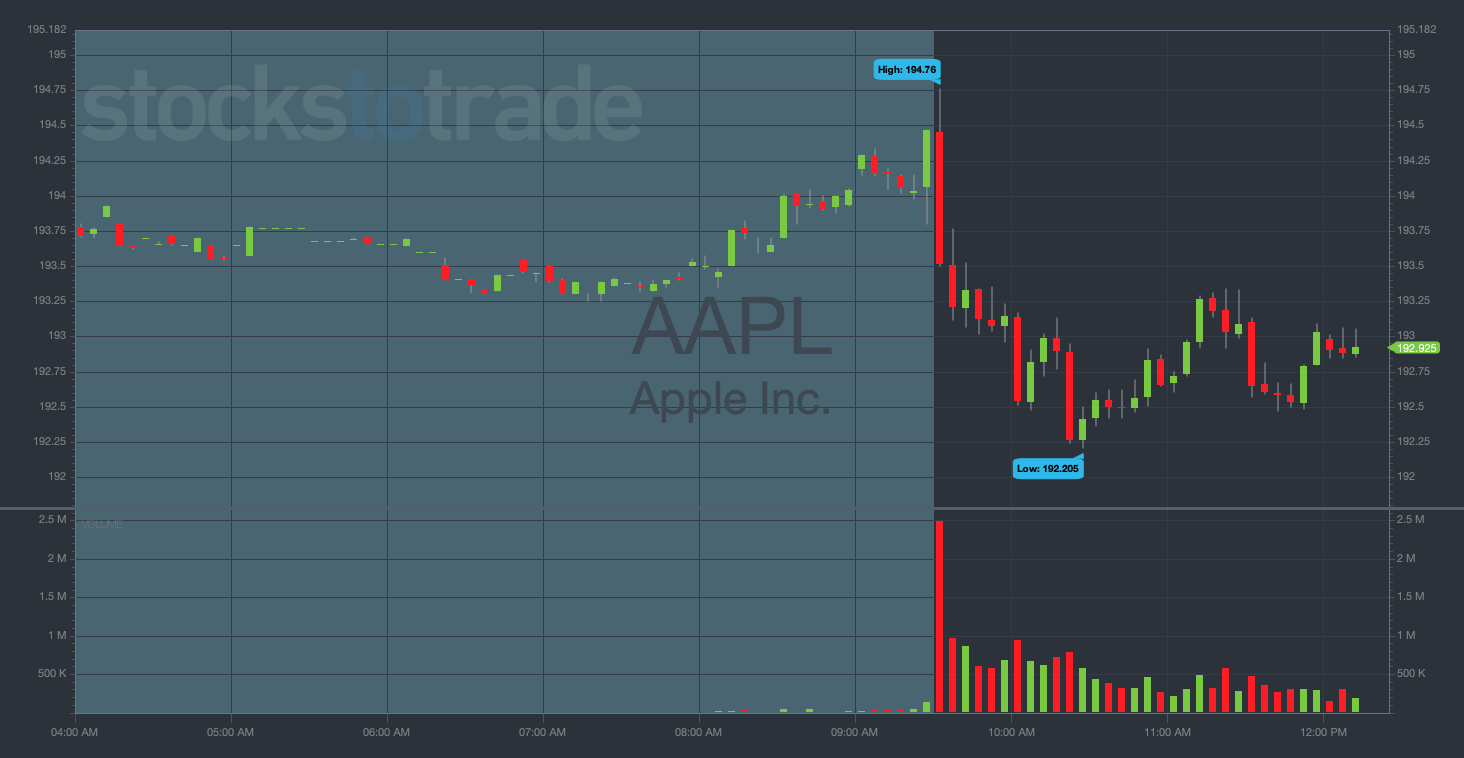
Candlestick Charts
Candlestick charts provide detailed information about price movements within a specific timeframe, including opening, closing, high, and low prices. Their visual format makes it easier to spot trends and reversals.
Here’s why I like using candlestick charts the best:
Candlestick charts are a trader’s best friend for a reason: they pack a wealth of information into a single view, showing open, high, low, and close prices within a specific timeframe. This detailed insight is invaluable for spotting trend reversals and continuation patterns, making them a cornerstone of technical analysis. Whether you’re a novice getting to grips with the basics or an experienced trader refining your strategy, understanding the nuances of candlestick patterns can significantly enhance your market analysis. For an in-depth exploration of chart candles and how to interpret them, enhance your skills with this guide on mastering chart candles.
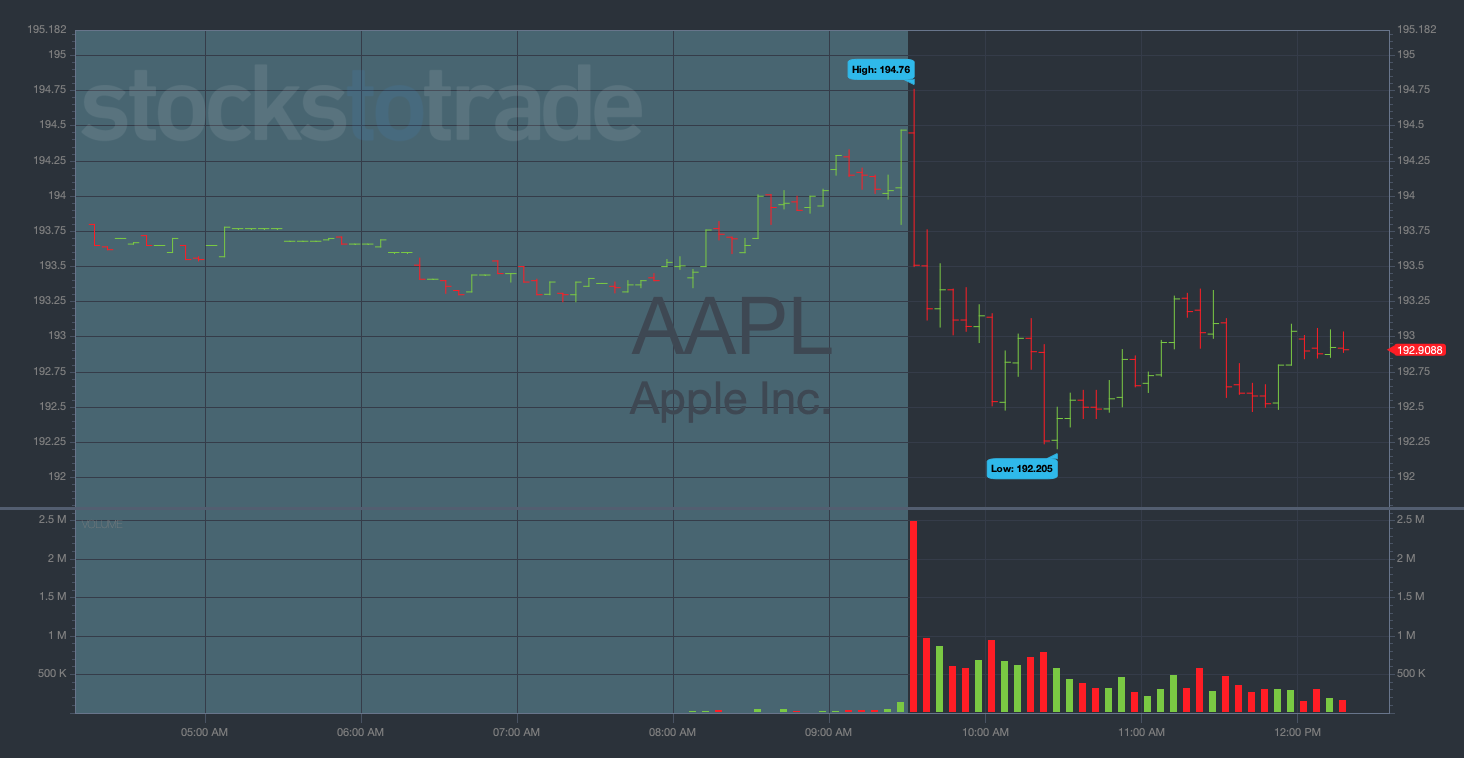
 Bar Charts
Bar charts offer a straightforward representation of price movements, showing the opening, closing, high, and low prices for each period with a simple vertical line and horizontal ticks.
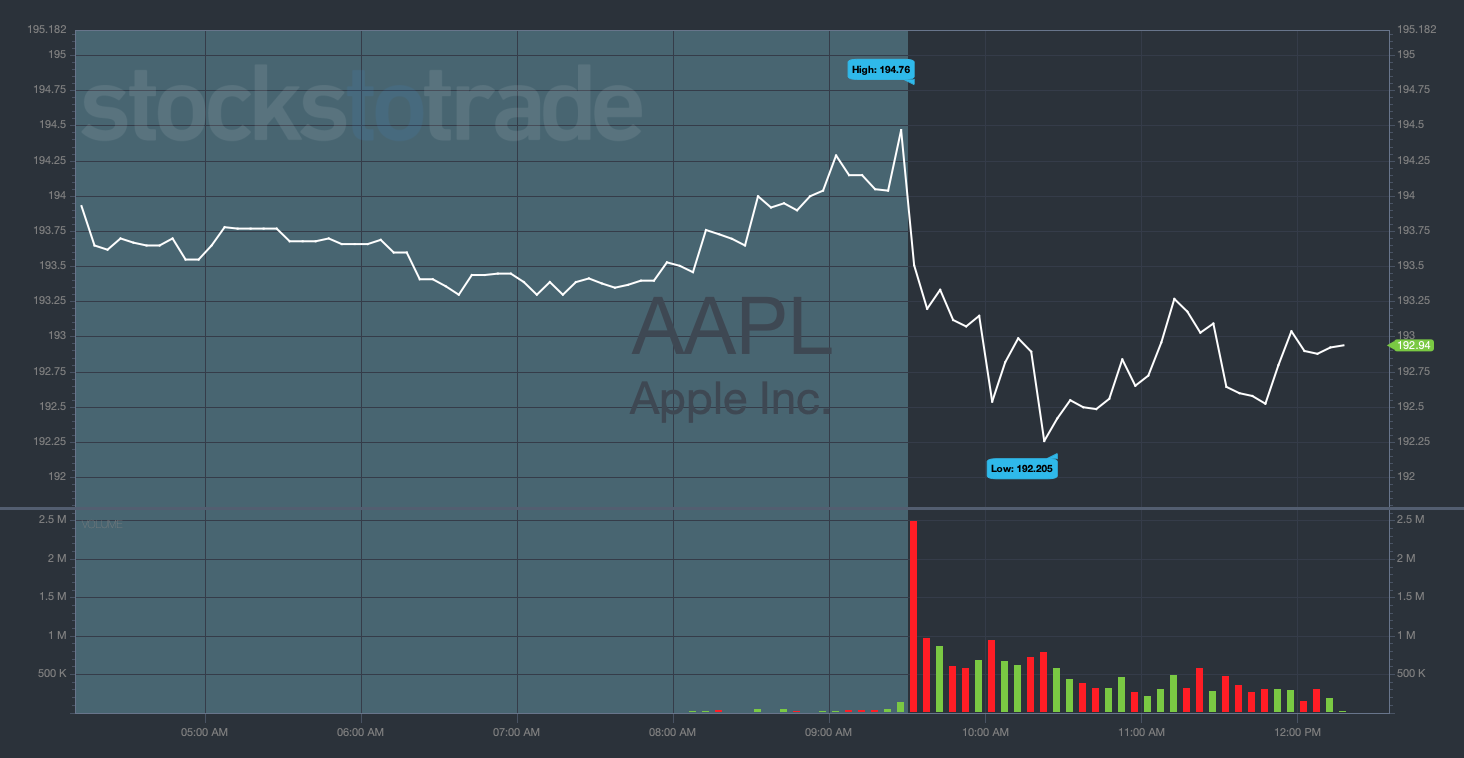
 Line Charts
Line charts track the closing prices of stocks over time, offering a clear view of the overall trend direction. This simplicity makes line charts particularly useful for identifying long-term trends.
 Point and Figure Charts
Point and Figure charts focus on significant price movements, ignoring minor fluctuations. This type of chart is useful for identifying breakout patterns and major trends without the noise of short-term volatility.
Renko Charts
Renko charts are built using price movement rather than time intervals, highlighting trends more clearly by eliminating minor price changes. This makes them effective for smoothing out market noise and identifying trend directions.
Stock Chart Patterns to Analyze
Analyzing stock chart patterns is critical for anticipating future price movements. Continuation patterns, such as triangles or flags, signal that a current trend is likely to proceed, while reversal patterns like head and shoulders or double tops suggest a potential shift in direction. These patterns, observed in the context of companies across various sectors, from tech giants to traditional manufacturing businesses, provide traders with actionable insights.
Drawing on my trading and teaching experience, I emphasize the importance of pattern recognition not just for predicting stock moves but also for understanding broader market dynamics, helping traders refine their investment strategies for better results.
Chart patterns are the market’s language, offering clues about future price movements. From continuation patterns signaling the persistence of a trend to reversal patterns hinting at a change in direction, each pattern tells a part of the stock’s story. Recognizing these patterns can be the difference between a successful trade and a missed opportunity. To navigate this complex aspect of trading, it’s crucial to have a solid understanding of various chart patterns and their implications. Dive deeper into this topic and refine your pattern recognition skills with essential chart patterns for traders.
Continuation Patterns
Continuation patterns, such as triangles and flags, suggest that an existing trend is likely to continue after a brief pause. Recognizing these patterns helps traders to anticipate and capitalize on the resumption of trends.
Reversal Patterns
Reversal patterns indicate a potential change in the direction of a trend. Head and shoulders, double tops, and bottoms are common reversal patterns that signal the end of a current trend and the beginning of a new one.
Understanding Technical Analysis
Technical analysis is a fundamental aspect of trading that involves examining stock charts to forecast future price movements based on past patterns and trends. This analysis includes a detailed study of support and resistance levels, chart patterns, and various indicators such as moving averages. By applying these techniques, traders can make more informed decisions, whether they’re investing in high-volatility penny stocks or looking for stable returns from blue-chip companies.
My approach to teaching technical analysis focuses on empowering traders with the knowledge to decipher complex charts, enabling them to identify high-probability trading opportunities and manage risks effectively.
Support and Resistance Levels
Identifying support and resistance levels helps traders find strategic entry and exit points, based on where the stock price is likely to bounce back or break through.
Chart Patterns
Chart patterns, such as head and shoulders or cup and handle, provide visual cues about the stock’s future direction, offering traders opportunities to enter or exit trades based on expected price movements.
Indicators
Technical indicators, including moving averages and Relative Strength Index (RSI), assist in analyzing market conditions and predicting future price movements. These tools are essential for making informed trading decisions.
Knowing which indicators to use and how to interpret them can be overwhelming. Focusing on the best indicators for day trading can deliver more practical insights, helping you to identify profitable trading opportunities more efficiently. To get started, check out this essential guide on leveraging day trading indicators.
Moving Averages
Moving averages smooth out price data to identify trends. The crossover of short-term and long-term moving averages can signal entry and exit points for traders.
A Guide To Reading Stock Charts
Reading stock charts proficiently is akin to understanding a company’s story through its price movements and trading volumes. Identifying the trendline gives insight into the stock’s general direction, while recognizing support and resistance levels helps traders anticipate potential turning points. Awareness of dividends, stock splits, and historical trading volumes can further refine trading strategies, offering clues about future moves.
In my experience, guiding beginners through the nuances of charting, from analyzing a stock’s price action to understanding the implications of mortgage rates on financial stocks, lays a solid foundation for success in trading. This knowledge not only aids in making tactical trades but also in building a diversified investment portfolio, navigating the complexities of the finance world with confidence.
Identify the Trendline
The trendline is a straight line that connects a series of price points, indicating the general direction of the stock’s price movement. Identifying the trendline helps traders understand whether the stock is in an uptrend, downtrend, or moving sideways.
Look for Lines of Support and Resistance
Support and resistance lines are drawn to mark the levels where the stock price has historically failed to move lower or higher, respectively. These lines are pivotal for predicting future price movements and planning trades.
Know When Dividends and Stock Splits Occur
Understanding the timing of dividends and stock splits is important, as these events can significantly impact stock prices. Charts often include markers for these events, helping investors consider these factors in their analysis.
Understand Historic Trading Volumes
Volume, represented at the bottom of stock charts, indicates the number of shares traded over a specific period. High volume during price movements suggests strong interest and validates the trend.
Fundamental Analysis vs Technical Analysis
The main difference between fundamental and technical analysis lies in their approach. Fundamental analysis evaluates a company’s intrinsic value based on financial and economic indicators, while technical analysis focuses on price movements and patterns on stock charts. Both methods offer valuable insights but cater to different trading styles and timeframes.
Stock Market Trends: How To Identify Trends on Charts
Identifying trends in the stock market involves analyzing chart patterns, trendlines, and technical indicators. Trends can be upward, downward, or sideways, and recognizing these patterns early can give traders a significant advantage in planning their trades.
Key Takeaways
- Reading stock charts is a fundamental skill for traders, offering insights into market trends, volatility, and potential trading opportunities.
- Different types of charts and patterns provide various perspectives on stock performance, aiding in comprehensive market analysis.
- Technical analysis, through the study of support and resistance levels, chart patterns, and indicators, is crucial for predicting future price movements.
- Combining technical analysis with fundamental analysis can offer a more rounded approach to making informed trading decisions.
There are a ton of ways to build day trading careers… But all of them start with the basics.
Before you even think about becoming profitable, you’ll need to build a solid foundation. That’s what I help my students do every day — scanning the market, outlining trading plans, and answering any questions that come up.
You can check out the NO-COST webinar here for a closer look at how profitable traders go about preparing for the trading day!
How are your charting skills? Write “I will use candlesticks” in the comments if my advice has taken hold!
Frequently Asked Questions
What Do Chart Patterns Mean?
Chart patterns represent the psychological and trading behavior of the market participants, indicating potential future movements based on historical trends.
What Are the Different Graph Patterns?
Graph patterns include continuation and reversal patterns, each signaling either the continuation of an existing trend or the beginning of a new trend.
What Is the Strongest Chart Pattern?
The strongest chart patterns are subjective and depend on the trader’s strategy and market conditions. However, patterns like the head and shoulders or double bottoms are widely regarded for their reliability in signaling trend reversals.
How Do Brokers and Brokerage Services Support Chart Analysis for Traders?
Brokers and brokerage services support chart analysis by providing traders with advanced charting tools and real-time data, essential for making informed trading decisions. These platforms often include features like technical indicators, historical data analysis, and customizable chart views, enabling traders to analyze trends, identify demand levels, and predict future movements. Understanding how to leverage these tools can significantly enhance a trader’s ability to interpret stock charts effectively.
What Are Key Examples of Chart Patterns Beginners Should Know?
For beginners, learning key examples of chart patterns is crucial for successful stock chart analysis. Patterns such as head and shoulders, double tops and bottoms, and candlestick formations offer insights into market sentiment, potential reversals, and continuation of trends. Recognizing these patterns helps traders anticipate market movements and align their strategies with observed demand and supply dynamics.
How Can Understanding Demand and Supply Influence Chart Reading?
Understanding demand and supply is fundamental to reading stock charts accurately. Chart indicators like volume, moving averages, and support and resistance levels reflect the balance between buyers and sellers in the market. High demand areas can lead to price increases, while high supply may cause prices to fall. Traders who can identify these zones on charts can better predict entry and exit points, optimizing their trading outcomes.
Why Is It Important to Diversify Investments According to Chart Signals?
Diversifying investments according to chart signals is important because it helps manage risk and capitalize on different market opportunities. Chart analysis provides signals that can indicate the right time to enter or exit positions across various asset classes, including stocks, bonds, and commodities. By spreading investments based on these signals, traders can reduce the impact of volatility on their portfolio, balancing potential risks with the pursuit of returns.
How Do Loans and Credit Cards Affect Investment Strategies Based on Chart Analysis?
Loans and credit cards can affect investment strategies by providing additional capital for trading but also introduce financial risk. While access to extra funds can allow traders to capitalize on opportunities identified through chart analysis, it’s essential to use debt judiciously to avoid overexposure. Effective money management, including the strategic use of loans and credit, should complement chart-based trading decisions, ensuring traders maintain a balanced approach to leveraging and risk.
How Can HELOCs, CDs, and Understanding Market Purposes Benefit Your Trading Strategy?
Using a Home Equity Line of Credit (HELOC) allows traders to tap into their house equity for additional trading capital, offering a way to finance potentially profitable trades identified through chart analysis. However, it’s crucial to manage this risk carefully to avoid jeopardizing personal assets. Certificates of Deposit (CDs) can serve as a lower-risk investment, providing a stable return that can balance some things in a trading portfolio. Understanding the purposes behind different market movements and the roles various financial instruments play can guide traders in allocating their capital effectively.