Technical Indicators: Key Takeaways
- What you must understand about technical indicators…
- Indicators don’t prove anything, they’re just one more sign of a decent trade…
- How a simple acronym can help you stay focused…
Check out how I use technical indicators daily on the SteadyTrade Team!
Here’s a trading riddle for you: What can help your trading edge yet sometimes leave you completely confused? Technical indicators!
Hey, I tried. I’m a trading mentor, not a comedian.
But seriously — how do you trade without a math Ph.D.? It’s totally possible, even if you only have basic math skills. You just need to understand what these indicators can actually do for you.
So let’s dive in with our no-nonsense take on the best technical indicators for the real world.
Table of Contents
What Are Technical Indicators?
Technical indicators are math calculations on certain parts of a stock’s performance.
They can be simple, like the simple moving average (SMA) indicator. This indicator takes a stock’s price over several periods and divides it.
It gives you a smoothed-down version of a price chart, showing cleaner price trends. Here’s an example on the chart for Biofrontera Inc. (NASDAQ: BFRI).
Biofrontera Inc. (NASDAQ: BFRI) 15-day chart with 20-period SMA indicator — Courtesy of StocksToTrade
Technical indicators can get complicated too. Bollinger Bands® takes the SMA and adds in variance. These upper and lower ranges show how far from the SMA a stock typically ranges…
This is an important clue for seeing when a stock is overextended.
BFRI one-day chart with Bollinger Bands indicator (Source: StocksToTrade)
Does technical analysis work? I use it every day.
Technical indicators are great for day trading, as long as you don’t get carried away.
SteadyTrade Team members hear me talking about VWAP regularly. That isn’t because I think it’s some magic bullet…
It’s because other traders pay attention to it.
Technical indicators can give you insight that can help your trading. But, like the great Brian Shannon says, “Only price pays.”
How Do Technical Indicators Work?
Technical indicators start at price, volume, and open interest in a stock. Some do a lot of math on top of these numbers. Some do very little.
Some even take other technical indicators as a starting point!
The important thing to realize is this: Everything technical indicators tell you is already in the chart.
Leading Indicators
Though they draw on the past, leading indicators show a stock’s future direction.
Take the relative strength index (RSI) indicator, for example. This technical indicator covers momentum, plotted beneath the volume graph on the chart.
BFRI one-day chart with RSI indicator (Source: StocksToTrade.com)
It’s an oscillator — one of the types of indicators in trading we’ll cover in the next section. It shows when a stock is overbought or oversold.
It’s a clue to buying and selling frenzies running out of steam…
Like all technical indicators for stocks, it’s looking at past data. It can’t predict anything on its own.
Used properly, it tips traders to the possibility of a trend reversal.
Lagging Indicators
Lagging indicators look at a stock’s historical data and can help traders see trends more easily.
SMAs are an easy example of this. Since they’re an average of historical price, they’ll always be slower to the punch.
There are tweaks to the formula like the exponential moving average (EMA). This indicator weighs recent prices more heavily than older prices.
Let’s look at a day trading application of these two technical indicators.
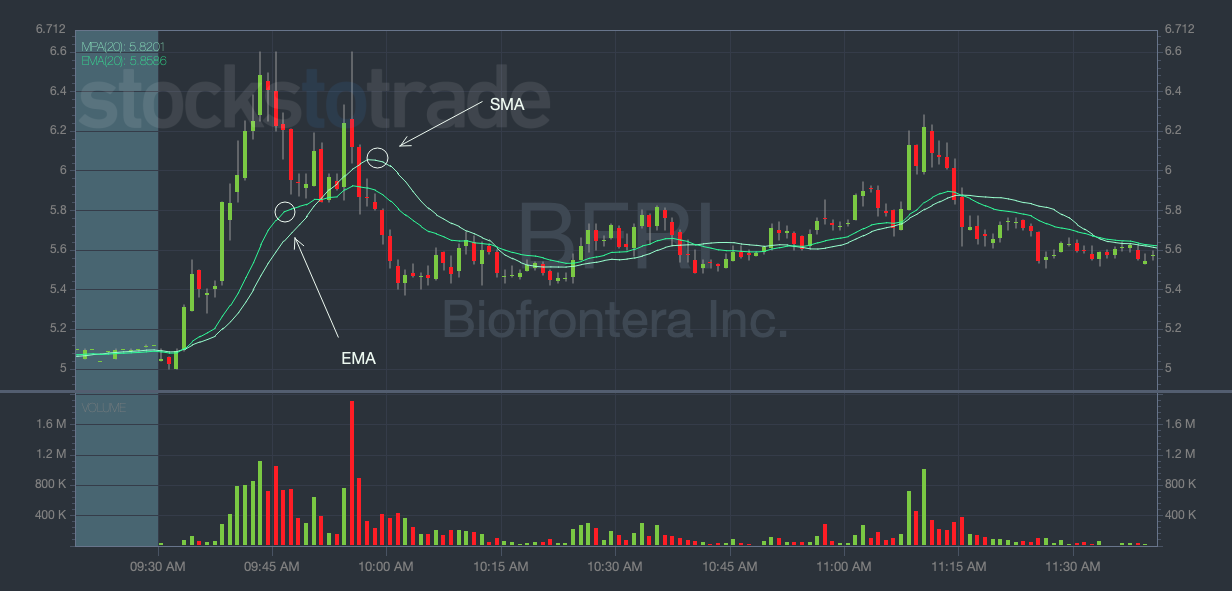
BFRI two-hour chart with EMA and SMA indicators (Source: StocksToTrade)
The EMA gets closer to the present. But it’s always going to lag what’s happening right now.
Types of Technical Indicators
Don’t get hung up on learning to use every technical indicator. This section will give you a broad overview so you can better find what works for you.
Overlays
Overlay indicators are mapped over price on the chart. Examples include moving averages and the MACD.
Because they use historical prices, overlays are mostly lagging indicators. But some traders use overlays to predict trend reversals.
Take the MACD for instance. It’s called a ‘positive divergence’ when the price hits a new low, but the MACD’s line doesn’t. This is a bullish sign — aka, one that’s leading.
Oscillators
Oscillators like RSI appear on the bottom of the stock chart, in their own dedicated window. Their range is limited to 0%–100%.
Oscillators measure momentum in things like the speed of price change or volume. They’re considered leading indicators because they can anticipate price shifts.
The rate of change (ROC) indicator measures the speed of price change. It’s often compared with a price chart…
Consider a stock’s price making a higher high while the ROC hits a lower high. Traders often take this as a sign that the price will start falling.
Volatility
Want to see an easy illustration of a stock’s range? The best technical analysis is done through indicators like Bollinger Bands.
When a stock’s price jumps above or below the bands, it’s outside of the standard volatility. That means it could be due for a price correction.
Bollinger Bands can also be used as a dynamic support and resistance indicator. In a choppy chart, often a stock’s price will bounce off the upper or lower bands. This is called the Bollinger bounce.
Volume
First off, volume is the second-most important indicator.
Only price pays, but you also need partners to trade with. That’s where volume comes in!
This category is more for advanced volume indicators. Take on-balance volume (OBV) for instance…
It compares volume and price — just like we do on basic charts. When volume increases or decreases, it predicts a similar effect on price.
Technical Indicators Examples
Seeing is believing! The best way to understand technical indicators is to see them in action…
Here are three videos that show you my favorite indicators to use in a variety of situations.
If you’re looking for the best technical indicators for swing trading, check out this video…
How about the best technical indicators for day trading? Knowing when a stock will bounce is key:
Last is the part every trader needs — how to know when to get out!
Technical Indicators List
The list of technical indicators can be endless…
I can’t give you the best technical indicators for your style of stock trading. That can only come from you.
But I can give you some of my favorites to try on for size. Read on.
VWAP
When I recorded this video in 2017, VWAP was working:
It’s still working. I often use VWAP as my risk. Other traders do too.
Check out BFRI’s VWAP chart on what is nearly a first red day…
The price only dipped significantly below VWAP twice. The morning panic dip might have made a good entry. The dip at the end of the day was a clear exit.
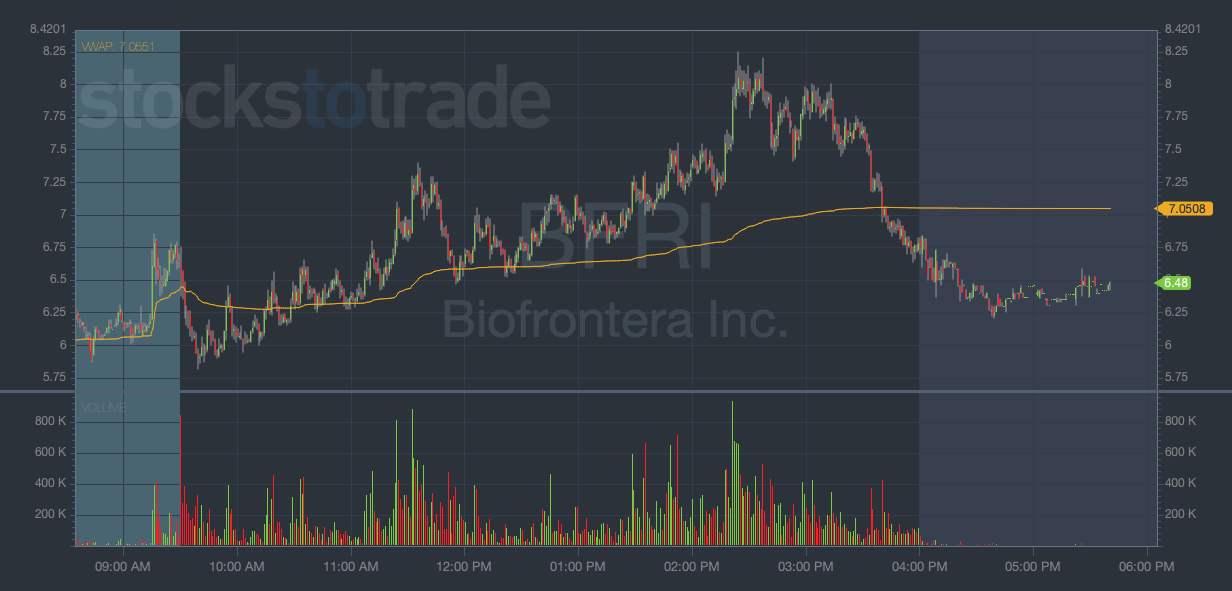
BFRI one-day chart with VWAP indicator (Source: StocksToTrade)
Moving Averages
Moving averages are one of the biggest classes of indicators…
They range from the simple, like SMAs, to the complex. MACDs and Bollinger Bands are based on them. Traders use oscillators like RSI to complement them.
There are flaws to moving averages, such as their lag. But they get the biggest thing right — they’re easy to understand and use in trades.
Oracle S&R Levels
StocksToTrade’s Oracle algorithm does most of the technical analysis for you.
Most of what it does is under the hood. But it does have a fun indicator to use with StocksToTrade.
The Oracle S&R Levels trace support and resistance. They give you a clear picture of a chart’s structure.
Here’s a chart from when BFRI jumped levels in its afternoon surge.
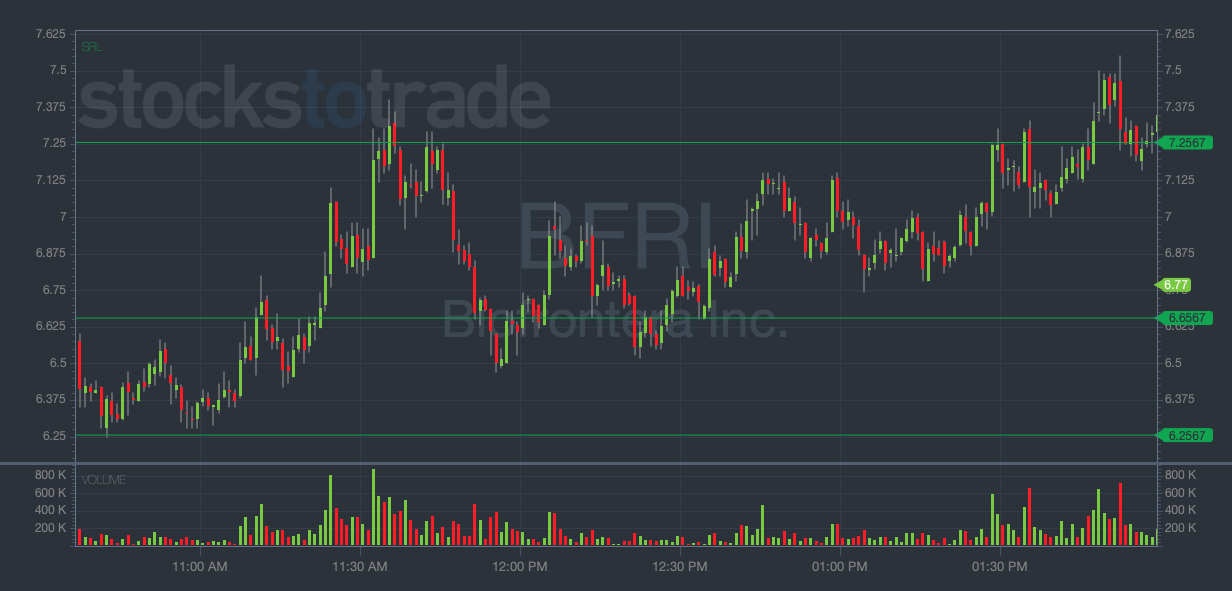
BFRI two-hour chart with Oracle S&R Levels indicator (Source: StocksToTrade)
Tips on How to Use Technical Indicators
Like I said before, the best technical indicators are the ones you use.
Some traders get way into indicators. And it works for some.
If you get really skilled at using indicators, they can make a good trading edge. I just don’t want you using indicators because you think you need to.
After all…
The Best Indicators Are Right in Front of You
Price and volume will tell you everything you need to know.
There are a million ways to slice them up…
But it all comes back to these two basics.
KISS
Keep it simple, stupid!
No, I’m not calling you names. KISS is one of my favorite sayings in the market.
Treat it as your mantra. Remind yourself about it whenever you get in too deep…
Good trading is simple … It’s supply and demand. Any indicator you use should help you see these things more clearly.
Use the Right Software
The key to using indicators effectively is clean charting…
You never want your overlays to obscure the most important indicator — price!
At the end of the day, you want to make the right trades. That’s why the charts I trust are made on StocksToTrade.
StocksToTrade is a pro-level trading platform. It has the technical indicators that short-term traders like me actually use. It’s wildly customizable with real-time data and awesome alerts.
Try StocksToTrade today — it’s only $7 for the first 14 days!
The Bottom Line on Technical Indicators
I hope I’ve cleared up some of the mystery about technical indicators…
There’s no such thing as the ‘best indicators.’ If there were foolproof indicators, we’d all be on our own private islands.
There are a million different ways to make money in the market. And chances are, there are indicators that will help you do it.
You have to learn what works for you the hard way — through experience.
Do you agree with my KISS philosophy? Which indicators do you use? Let me know in the comments!