
Bollinger Bands® are an extremely helpful tool that should be part of every trader’s technical analysis toolbox. They can help you identify and confirm price trends in the market, and they’re extremely intuitive and easy to use.
You can use Bollinger Bands® as part of your stock research to help you determine whether a stock meets your criteria for making a trade. And guess what that means? That’s right, you can make more intelligent and knowledge-based trading plans.
In this post, we’ll cover the basics of Bollinger Bands®: what they are, how to use them, and how they can help you make more informed trades.
Table of Contents
What Are Bollinger Bands®? A Brief History
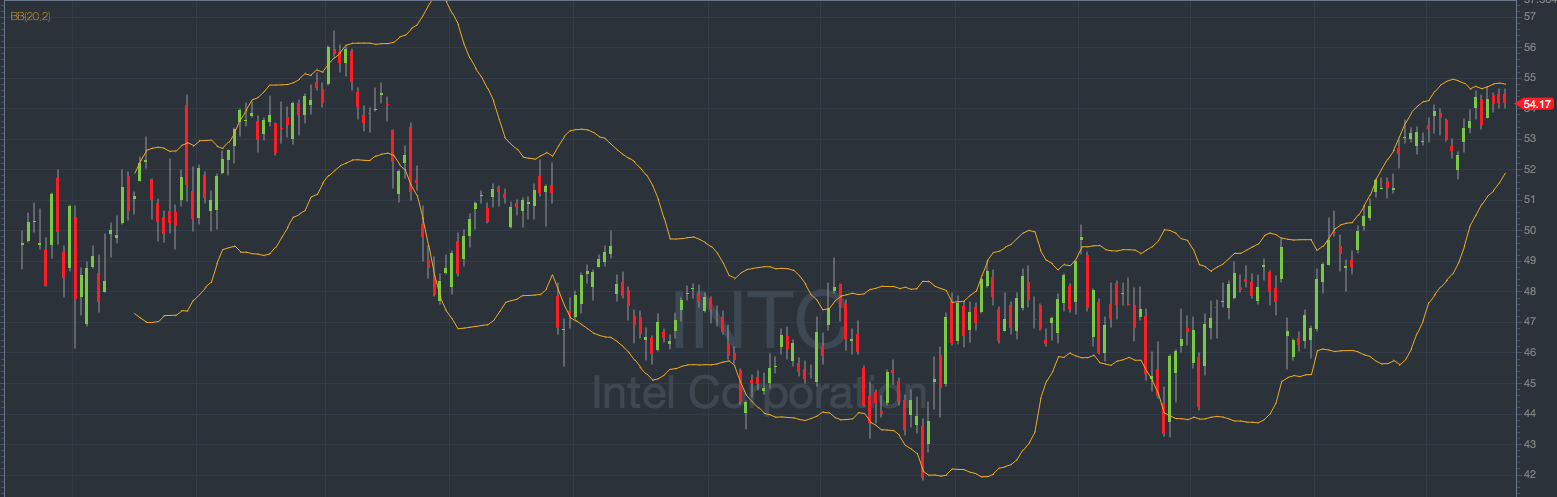
The lines around the candlesticks are Bollinger Bands
So what exactly are Bollinger Bands®?
To understand them, let’s first get acquainted with their creator John Bollinger. He’s a figure in the financial world and has spent years developing knowledge as a chartered financial analyst (CFA) and a chartered market technician (CMT).
In the early 1980s, Bollinger created these bands that now bear his name. His goal was to create a method for making sense of the volatility that’s constantly at hand with stock price movement.
They quickly became a popular method to confirm and make sense of trend directions. In today’s parlance, you might even say they went viral. Now, in the present day, traders consider this standard indicator as part of their technical research.
How to Use Bollinger Bands
So … how do Bollinger Bands® work? Don’t worry, it’s not too confusing.
Reading Bollinger Bands
Bollinger Bands® are a pair of lines that respectively represent a positive and negative deviation from the SMA (simple moving average) of a stock’s price. Typically, each band is positioned two deviations away from the respective positive and negative SMA positions.
Why do traders use Bollinger Bands®? Here are just a few reasons:
- User-friendly. Bollinger Bands are super easy to understand. They just kinda make sense when you look at them. With their positions over and under the SMA, they can help you easily read a chart and see when the stock’s price might be trending higher or lower.
- Adjustable. Usually, Bollinger Bands® are positioned two set deviations away from the SMA. It’s usually easier at first to stick with standard settings. But as your trading knowledge increases, you can adjust them as desired. You can set the bands to deviations that work with your favorite setup or trading style.
- Confirm trends. Perhaps the most commonly cited benefit of using Bollinger Bands® is that they can help you confirm trends.
A strong trend in either direction comes with increased volatility, which forces the bands to move farther apart from one another. It also causes the lower band to move in the opposite direction of the trend. However, if a trend is weakening or waning, the same lower band will contract upward, which can be a sign of a slow-down.
Bollinger bands can help you figure out whether a trend is waxing or waning, which can help you better determine a trading strategy.
- Overbought or oversold conditions. Bollinger Bands® can also help you figure out if the market is overbought or oversold. When the stock price moves closer to the upper band, the likelihood that the security is overbought increases. On the other hand, when the stock price creeps closer to the lower band, it can be a sign that the security is oversold. Nope, it’s not an exact science — hence the term indicator. The bands give you an indication of the condition. That’s your cue to dive deeper into your research.
- Versatile. Some indicators are most popular with one or two types of trading. Not so with Bollinger Bands®. They’re used by all sorts of traders, from day traders to swing traders and long-term investors. Even forex traders can use the bands to spot trends in currencies volatility. Additionally, their use isn’t restricted to either small-cap or large-cap stocks. They can be helpful with both lower- and higher-priced stocks.
- Support and guidelines. Bollinger didn’t just make up the bands — he created an infrastructure around them. He also created a series of rules and guidelines that traders can follow for tips on how to make the most of the bands. This is especially helpful for new traders.
Bollinger Bands and the Stock Market
Here are some basic guidelines on how to understand what the Bollinger Bands® can tell you about the stock market:
Upper band = uptrends. If a trend has a strong upward direction, the SMA will look like it’s flirting with the upper band. It won’t stay there continually. It might move down toward the middle of the bands, but it won’t dip toward the lower one. This can be a good sign that the activity and price trend is strong.
Lower band = downtrends. The same logic follows in the opposite direction. If the trend is in a strong downward direction, the SMA will look like it’s more interested in the lower band. If it’s frequently bumping against it, there’s a good chance that the selling activity is high and traders are exiting their positions.
If the stock’s price is below the middle of the bands, it can be an indicator of a downtrend. However, if this changes and it starts reaching for the upper band, it might be a sign of a trend reversal.
Types of Bollinger Bands Strategies
There are many strategies for using Bollinger Bands® in your trading. Here are two good ones to start with:
W-Bottoms
The W-bottom pattern features a reversal where a downtrend is turning into an uptrend.
To identify this pattern, look for an initial wave in price that’s trending low, where the SMA moves close to or even slightly below the lower band. But then the price pulls back toward the middle or even higher. When it dips again, it’s not to the same low point as before. Then begins creeping upward again. When it makes this move above the earlier pullback in price, it’s said to be a W-bottom.
With the W-bottom, the general strategy is to go long on the trade and to place a stop just below the most recent lows to help minimize potential losses.
This strategy gets its name from the shape that this pattern creates on the chart, which has two lows and resembles a basic w shape.
M-Tops
As you might guess from the reversed shape, the M-tops pattern is a trend reversal. An uptrend is turning into a downtrend. What you’ll see here is an initial higher wave in price, which is close to or even slightly above the upper band.
Then, the price has a pullback, moving toward the middle or even the lower band. Then it comes back up with a price that’s higher than the prior high but doesn’t break out of the bounds of the upper band. Then, the price begins to dip lower.
When the price then moves lower than the previous pullback, it’s said to be an M-top pattern. Here, the strategy is generally to go short, with a stop above the most recent highs.
Advanced Methods of Using Bollinger Bands
How can you take your Bollinger Bands® practice to the next level? Here are some ways:
Relative Strength Index
The relative strength index, aka the RSI, is an indicator that can help you see how a security’s gains and losses stack up. You can use the RSI to see whether the stock is gaining or losing more.
Start by setting a time period, for instance, 14 days. It may look like the stock has uneven losses and gains. And that’s why you calculate the RSI — it can help you figure out which is more dominant.
The RSI is expressed on a scale from 0 to 100. Generally, 30 and 70 are the respective numbers that traders use to determine underbought or overbought conditions. Often, these levels can be used as a sign of a breakout or breakdown.
By using the RSI in combination with the Bollinger Bands®, you can get an even better idea of a trend’s strength.
Use with Other Indicators
Bollinger Bands® are an invaluable indicator in terms of determining stock price trends.
However — and this goes across the board — you should never rely on one single indicator to make a final decision about whether to make a trade.
You want to make the most of every trade, right? That means you have to take look at a number of factors. So to really make the most of Bollinger Bands®, be sure to back them up with other technical indicators to make the strongest case for your trade.
By combining Bollinger Bands® with other indicators, you can get a better idea of what the bands are telling you as well as the strength of a trend and which direction it’s headed.
Knowledge is power, especially when it comes to trading. Make use of all the tools you have at hand!
Take Advantage of StocksToTrade Features
The more informed you are, the better primed you to make smarter trading decisions. StocksToTrade is stocked with plenty of features to help you make the most of your technical analysis.
When you open up a tab for a new security on StocksToTrade, you have the option to customize the page with a variety of indicators. That means that you can apply the Bollinger Bands® indicator in addition to the RSI, MACD, and a variety of other popular indicators.
By looking at a stock’s chart and applying various indicators, you can start to get a sense of whether a trade is a good fit for you and your favorite setup.
The platform also offers news links so that you can get a head start on your fundamental research, as well as broker integration so that you can trade right from the platform!
Conclusion
Bollinger Bands® are a super-handy way to help inform your trades. Apply this indicator to a stock’s chart for a better idea of a trend’s price-movement trajectory, which can help you make more educated guesses about how the stock might perform in the future.
Armed with this information, you can then make more informed decisions about whether you want to enter a trade and better determine your entry and exit points.
Of course, like any other indicator, you shouldn’t solely rely on the bands for any trade. They should play one part in your detailed research. You need to look at a variety of indicators and also perform detailed fundamental research.
When you trade, you want to build a strong case for each and every trade. Focus on crafting more intelligent trading plans and improving your overall trading knowledge!
How do you use Bollinger Bands® in your technical analysis? What’s your favorite feature of this indicator? Leave a comment and let us know how you use them!