
Volume Weighted Average Price (VWAP) is a top trading indicator that blends price with volume to provide a more comprehensive view of market trends. Its significance lies in its ability to offer a snapshot of both trading momentum and value, making it an indispensable tool for traders and analysts alike.
Read this article because it provides a deep dive into how VWAP (Volume Weighted Average Price) can significantly enhance day trading strategies by integrating price and volume data for better market trend analysis.
I’ll answer the following questions:
- Is VWAP a good indicator for day trading?
- How does VWAP combine price and volume data?
- What technical indicators work well with VWAP?
- Can VWAP be used to set entry and exit levels in trading?
- How do institutional investors use VWAP?
- Is trading based on VWAP profitable?
- Can VWAP be used on a daily chart?
- How does VWAP act as a dynamic level of support and resistance?
Let’s get to the content!
Table of Contents
- 1 What Is VWAP?
- 2 Technical Indicators to Use with Volume Weighted Average Price
- 3 VWAP Trade Examples
- 4
- 5 Tips for Using VWAP
- 6 Why Is VWAP Important?
- 7 How To Trade With VWAP
- 8 Volume Weighted Average Price Day Trading Strategies
- 9 Take Advantage of StocksToTrade Features
- 10 How to Leverage VWAP Forex Strategy
- 11 How Accurate Is VWAP?
- 12 Is Volume Weighted Average Price (VWAP) Reliable?
- 13 Conclusion
- 14 FAQs
What Is VWAP?
Volume-weighted average price (VWAP) is a technical indicator that shows where the majority of volume trades in a stock.
The indicator is a basic line on the chart. When the price is above the line, it’s above VWAP. And when it’s below, the price is below VWAP.
VWAP is one of the more useful indicators for day traders, as it can give a good view of whether traders who recently entered positions are profitable or losing money on their trades.
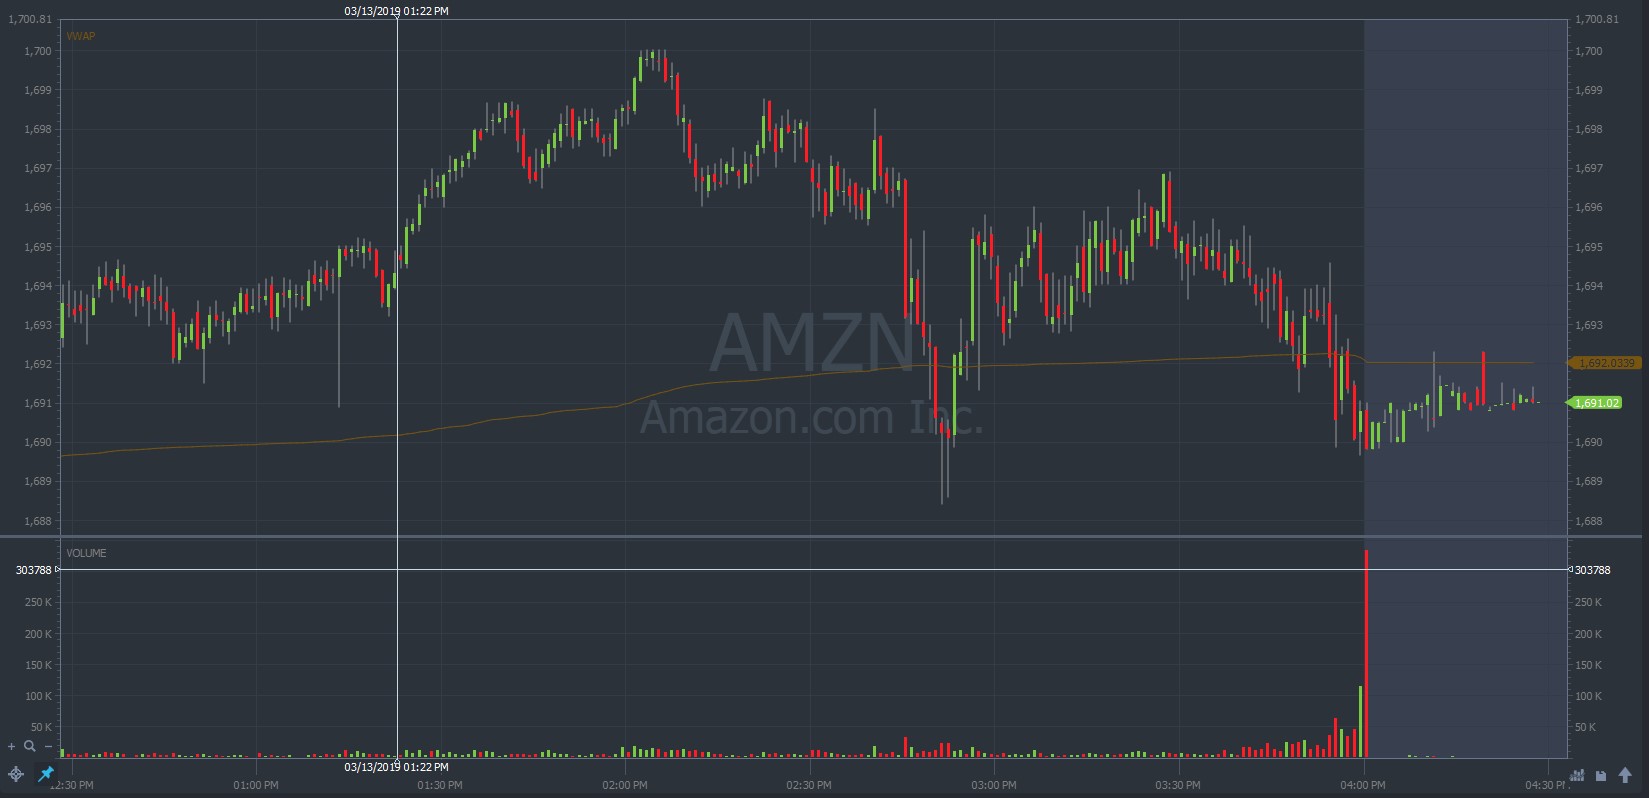
Amazon (NASDAQ:AMZN) chart with the VWAP indicator (Source:StocksToTrade.com)
With this information, a savvy trader can then look to trade with those who are closing losing positions or ride a larger wave of momentum. There are other ways to put this number to use. More on that in a bit.
Step 1: Calculating the Typical Price (TP)
Understanding VWAP begins with the Typical Price (TP), which is the average of the high, low, and closing prices of an asset for a specific period. This calculation acts as a foundation, offering a simplified view of market activity that balances the extremes of the trading day.
Step 2: Calculating the TPV
The next step involves multiplying this figure by the volume for the period, resulting in the Typical Price Volume (TPV). This step marries price action with trading volume, emphasizing the weight of trading activity behind price movements. This is a key component in my trading strategy, as it offers insights into the strength behind price trends, distinguishing between price shifts on light volume and those supported by substantial trading volume.
Step 3: Calculating the VWAP for the First Candle
To calculate the VWAP for the first candle, one must divide the TPV by the total volume of the period. This initial calculation sets the stage for the continuous computation of VWAP throughout the trading session, providing a dynamic, volume-weighted price average. In my experience, the VWAP’s evolution over the course of a trading day offers critical clues to intraday price direction and potential areas of support and resistance.
Technical Indicators to Use with Volume Weighted Average Price
Pairing the Volume Weighted Average Price (VWAP) with other technical indicators can significantly enhance a trader’s analysis and decision-making process. From my personal trading experience, integrating VWAP with indicators like Moving Averages for trend identification, and the Stochastic oscillator for momentum, provides a multifaceted view of the market. This combination allows for spotting not just the volume-weighted price level but also the potential momentum behind price movements.
It’s crucial, especially when considering entry or exit points in trades, to look for confirmation across different indicators. This practice, solidified through reviewing countless charts and trades, underscores the value of a diversified analytical approach, leveraging the strengths of various indicators to bolster the robustness of trading signals.
Pivot Points
Pivot points and VWAP share a complementary relationship, with pivot points offering defined levels of potential support and resistance. When used together, they can highlight significant price levels that are crucial for making informed trading decisions. My application of this combination has often revealed confluence areas where price action is likely to stall or reverse, enhancing the precision of entry and exit points.
The Relative Strength Index (RSI) is another critical indicator for day traders, offering insights into overbought or oversold conditions in the market. Like pivot points, RSI can help VWAP traders pinpoint optimal entry and exit points by highlighting potential reversals based on market sentiment. For those looking to enhance their trading toolkit with effective strategies that incorporate volume and price momentum, understanding how to leverage RSI for day trading can significantly improve decision-making processes and trading outcomes.
VWAP and Trend Lines
Incorporating trend lines with VWAP adds another layer to market analysis, allowing traders to visualize the trajectory of price trends in relation to volume-weighted price averages. This method has been instrumental in my strategy, aiding in the identification of breakout points and trend continuations, especially when the price action deviates significantly from the VWAP.
The Moving Average Convergence Divergence (MACD) is a powerful tool that, when used in conjunction with VWAP, can significantly enhance your trading strategy. This indicator helps identify trend direction, momentum, and potential reversals, providing a comprehensive view of market dynamics. For traders looking to refine their approach to day trading with a focus on technical analysis, mastering MACD for day trading can provide the edge needed to make more informed decisions and identify high-probability trading opportunities.
Why the VWAP Matters
VWAP sounds great, right? Or maybe you think it sounds like all the other indicators. Let’s break down what’s so special about this one …
Here are a few reasons why so many top day traders love VWAP …
- VWAP is dead simple: the price is either above it or below it. When it comes to day trading, simplicity often rules.
- It’s an easy gauge on whether a stock is cheap or expensive on the day.
- You can use it to help you pinpoint intelligent entry and exit points for your day trades.
- It can help you determine trend changes, often quicker than moving averages.
There are plenty of reasons that day traders love the VWAP. Ready to learn more? Practice, practice, practice. Load up a few charts with a VWAP and see what kind of patterns pop out at you.
Don’t have your charting set up with VWAP capabilities? Check it out on the StocksToTrade platform. A 14-day trial is just $7. Try today and see how you can use the VWAP indicator in your trades.
How to Calculate VWAP
Calculating the VWAP is pretty simple.
First, take the dollar amount traded for the entire trading volume that day (the share price multiplied by how the number of shares traded). Next, divide that number by the number of shares traded during that day.
The result is the average price compared to volume. This tells traders at which price levels the majority of volume traded. Simple, right?
VWAP Trade Examples
Now that you’re up to speed on what the VWAP is and how it’s calculated, it’s time to dive into some trading setups you can start watching for.
Here are two of our favorites:
Breakout Example
Before we examine the VWAP breakout setup, let’s be clear about what a breakout is.
A breakout is when a stock’s price moves above a previously strongly held resistance level, often with higher trading volume. This can signal that traders are excited about this move and the stock may go on an extended price run.
When it comes to a VWAP breakout, look for when a stock price drops below the VWAP. This can often signal that buyers are exiting their long positions, which lowers the price compared to the VWAP.
This can potentially be a good situation to look for a long trade, with the expectation that the stock will soon bounce back and continue its upward movement.
Pullback Example
What’s a pullback?
A pullback is where a stock that’s on an extended move upward or downward makes a small movement in the opposite direction. Hence, pullback.
Pullbacks are a common price movement. You can see them all over stock charts, especially in heavy trends. To trade a VWAP pullback setup, imagine you’re watching a stock that’s in a clear uptrend, consistently making higher highs and higher lows …
The stock price makes a pullback to the downside, returning to the VWAP level on the chart. This is a chance to purchase the stock at the daily average price, sort of like buying something at a one-day-only clearance sale.
After you enter your long, you’re looking for price to continue its uptrend, gradually pulling the VWAP up along with it. Everyone loves a bargain!

Tips for Using VWAP
The VWAP itself is a simple indicator. But that doesn’t mean you can just plug and play, then expect killer results.
We’ve compiled a list of some best-practice tips to help you properly use VWAP to find, enter, and manage trading opportunities:
Never Use It Longer Than 24 Hours
In fitting with the StocksToTrade trading philosophy, it’s generally best to calculate the VWAP using price data from the previous 24 hours maximum.
That means that the VWAP will only average the price and volume from recent market action.
Why? When it comes to the VWAP, less is more. You want the data for the VWAP to be finely tuned to the most recent actions of other traders in the market.
Since the VWAP is mainly a day trading tool, it’s more important to know if traders who bought today are in a profit or a loss. How traders fared the week before is less relevant here.
Use Short-Term Charts
When trading stocks, you’ll probably notice that the trading volume fluctuates throughout the day. You’ll often find the bulk of the volume just after the open and just before the close.
You might also see that a stock can be quiet for an hour, then see massive trading volume in just a minute or two. That may be due to a news catalyst or exciting price action.
Here’s what that means: If you use longer-term charts, such as the 30-minute or 60-minute, your VWAP data will greatly lag behind a shorter-term chart (think 1-minute or 5-minute here).
On a longer-term chart, the speed at which the VWAP generates a signal could mean that you completely miss the move. So, if you use VWAP, opt for the shorter-term charts.
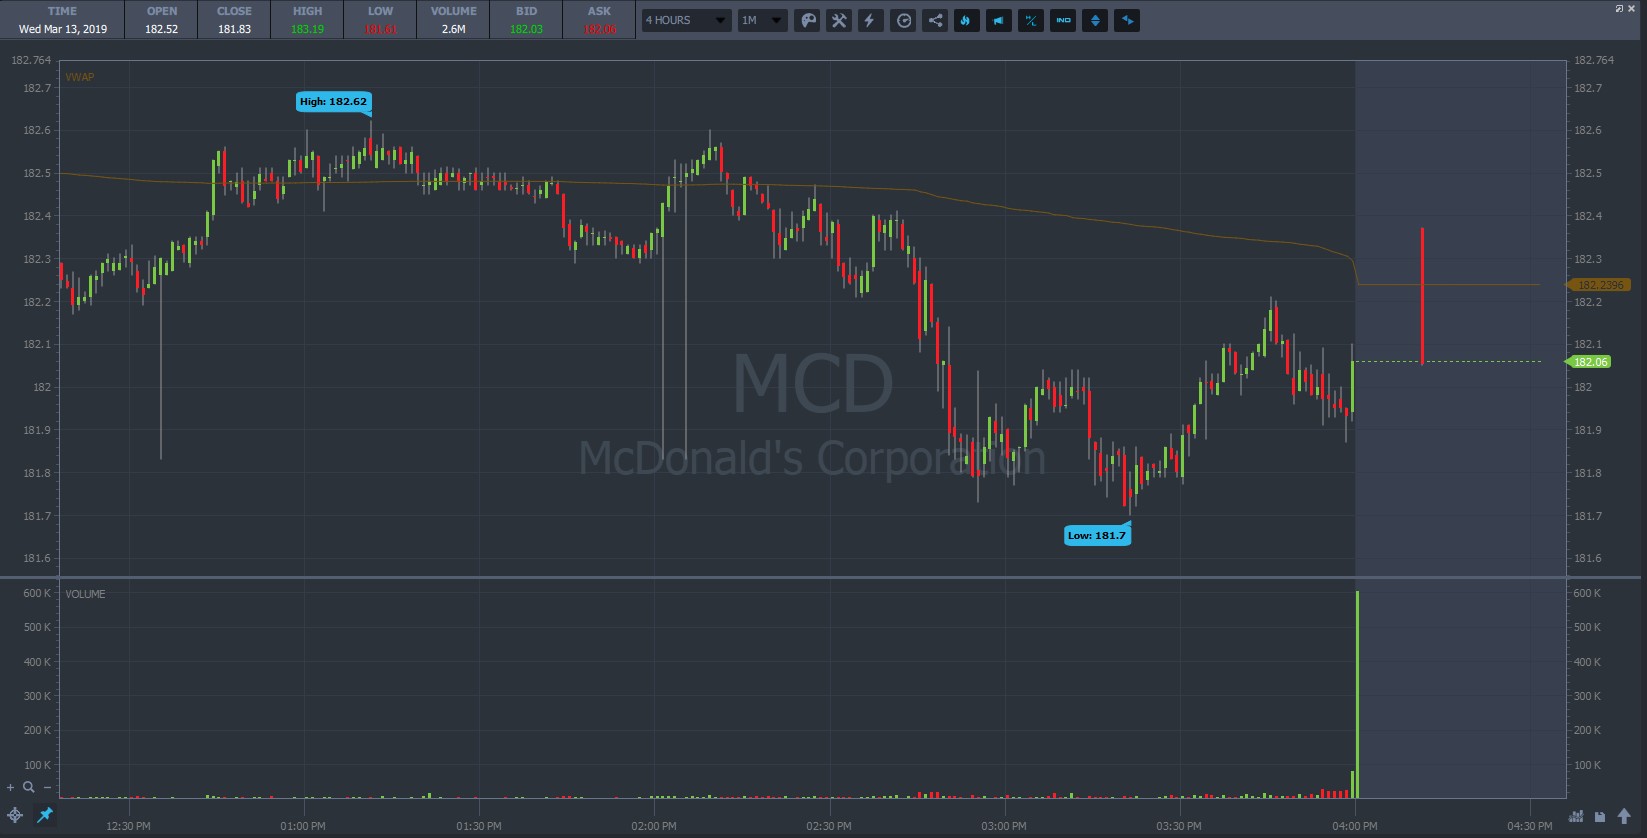
McDonald’s (NYSE:MCD) 1-minute chart with VWAP indicator (Source:StocksToTrade.com)
Be Smart with Where You Place Your Stop-Loss
Any trade can be a losing trade, so you always need to know when it’s time to exit a loser.
Normally, traders place stops on the other side of a key level or the price at which their chart pattern is invalidated. But, with VWAP, it’s not so simple — VWAP can move all day. You can’t just keep your stop loss on the other side of VWAP.
Instead, here are a few ideas for setting stop-losses with VWAP:
For instance, if you take a VWAP pullback trade, you should look to place your stop-loss on the other side of a key chart level. That level may be a morning gap or previous strong support level. That way, you can use the VWAP to try to keep trading in the right direction but maintain a stop-loss at a logical level.
Alternatively, if there’s no major level, you can also look to keep your stock on the other side of a recent swing point. Imagine you’re long a stock that’s making higher highs and higher lows. You can place your stop-loss just below the previous swing low. If that low is broken, the uptrend is invalidated anyway.
You can be creative with your stop-loss placement, but make sure you test it. It should make sense for your trading plan. Backtest it before you take it live.
Why Is VWAP Important?
VWAP holds significant importance in trading for several reasons, a fact I’ve reiterated through articles and reviews alike. Its popularity stems from its dual ability to offer a benchmark price that is both volume-weighted and reflective of the entire trading day. For brokers and institutional investors, VWAP serves as a standard against which they can measure the efficiency of their trades.
In my case, understanding that VWAP is closely watched by these market participants has been crucial. It offers insights into potential price movements and areas where significant trades might occur, highlighting the strategic advantage of incorporating VWAP into one’s trading toolkit.
Popular Indicator
VWAP’s popularity among traders and analysts is no accident. Its utility in providing a volume-weighted perspective on price trends makes it a go-to indicator for assessing market sentiment. Its widespread use by institutions and retail traders makes for a self-fulfilling destiny, where VWAP levels become focal points that can influence market behavior.
VWAP is especially important in the world of penny stocks, where market sentiment is the biggest factor in price action. For those interested in diving deeper into the conversation and discovering what penny stocks are capturing the attention of traders, exploring penny stocks on Reddit can offer a unique angle on market trends and trader sentiment.
Used by Institutions
Institutional investors often use VWAP to guide order execution, seeking to minimize market impact by aligning their trades with the average market price. This practice underscores VWAP’s importance, as it can signal significant buying or selling activity, offering retail traders insights into potential market movements driven by institutional orders.
How To Trade With VWAP
Trading with VWAP involves a series of strategic considerations, from identifying support and resistance levels to setting precise entry and exit points. My approach has often involved using VWAP as a benchmark for identifying the market’s direction and then employing other indicators for confirmation. For instance, trading VWAP price crosses — where price moves sharply across the VWAP line — is effective in signaling shifts in market momentum.
Support/Resistance
VWAP acts as a dynamic level of support and resistance throughout the trading day. My students’ trading plans will often use VWAP as the risk level for their exits.
Entry and Exit Levels
The VWAP can also guide the setting of entry and exit points for trades, particularly in trend-following strategies. A move away from the VWAP, accompanied by increasing volume, can signal a strong trend, offering a basis for entry. Conversely, a return towards the VWAP can be used to identify exit points or take-profit levels.
Gauge Relative Strength
Utilizing VWAP can help traders gauge the relative strength or weakness of a stock compared to the broader market. When a stock’s price consistently remains above the VWAP, it suggests strength, indicating that the stock is performing well on a volume-weighted basis. Conversely, if the price habitually stays below the VWAP, it may signify weakness. This perspective has been invaluable in my analysis, allowing for more nuanced decisions based on the underlying strength of price movements.
Trade VWAP Price Crosses
Price crossings over the VWAP line are pivotal moments that can signal shifts in market momentum. A price moving from below to above the VWAP may indicate a bullish shift, offering a potential entry point for long positions. Similarly, a price drop below the VWAP can signal bearish momentum, possibly marking an opportune moment to short. Through trial and error, I’ve refined my approach to these signals, ensuring that additional confirmation is sought to increase trade reliability.
Volume Weighted Average Price Day Trading Strategies
Day trading strategies that leverage VWAP can vary in complexity, from simple price crosses to more elaborate setups involving VWAP bands and channels.
If you’re a devoted reader, you already know my favorite — the Afternoon VWAP-Hold High-of-Day Break.
I think this is the top pattern for part-time traders.
You have to let a stock prove itself. You can’t go chasing spikes hoping they’ll keep going. The great thing about this pattern is that it gives the stock an opportunity to fail without you.
This pattern can be great for traders who miss the morning rush.
The ideal stock for this pattern runs up in premarket and it hits the top gainer lists. More often than not, it comes back down before the market opens.
Throughout the course of the day, you want it to establish a support level no lower than 2% below VWAP.
Then, going into the 2 p.m. window (Eastern), you’re going to look for a volume push into the high of the day. It doesn’t always happen at exactly 2 p.m.
Wait for the high-of-day break. That can indicate the stock is ready for the next leg up.
If you want some other suggestions, here are some of the market’s favorites!
Trading Strategy 1: The Retracement Trade
One effective strategy involves entering trades on retracements to the VWAP. In a strong uptrend or downtrend, prices will often pull back to the VWAP before resuming the prevailing trend. These retracement points can provide high-probability entry opportunities. Some traders adapt this strategy to focus on confirming the trend’s continuation through additional indicators like moving averages or momentum oscillators, enhancing the trade’s likelihood of success.
Trading Strategy 2: VWAP Bands and Channels
Creating bands or channels around the VWAP can help identify overextended price movements where reversals are likely. This approach resembles using Bollinger Bands but centers the bands around the VWAP. Trading when the price touches or breaches these bands has been a part of some strategies, especially in markets with a clear trend, offering clear-cut signals for countertrend trades with defined risk parameters.
Take Advantage of StocksToTrade Features
Does it sound like VWAP is exactly what you’re looking for and you’re ready to add it to your charts right now? What if your charting platform doesn’t offer VWAP?
Good news! VWAP is one of the many technical indicators that are built into the StocksToTrade platform.
We offer way more than just a library of technical indicators … StocksToTrade is also jam-packed with features that can help you streamline your trading day as much as possible.
Here are just a few of the powerful features:
- Top-of-the-line scanning capabilities. Just plug in your exact trading criteria, and it’ll quickly search thousands of stocks for opportunities.
- Ultra-modern and clean charts — so easy on your eyes every trading day.
- Scan the web for any mentions of your favorite stocks, including news stories, SEC filings, and social media mentions.
- Coverage for just about every stock listed in the U.S.: NYSE, Nasdaq, pink sheets, and OTC.
- And so much more. And we’re always adding to our growing list of features.
See why some of the best U.S. stock traders use our platform every day. Grab a 14-day trial of StocksToTrade for just $7!
How to Leverage VWAP Forex Strategy
In the Forex market, VWAP can be applied to manage trades around volume and price averages, offering insights into the best execution prices. While the Forex market’s decentralized nature means volume data might be broker-specific, the VWAP calculated from a reputable broker’s data can still provide valuable insights. My use of VWAP in Forex has involved focusing on major currency pairs for better reliability, considering their higher liquidity and volume data’s comparative accuracy.
How Accurate Is VWAP?
The accuracy of VWAP, as with any trading indicator, can depend on a multitude of factors, including market conditions and the specific application by the trader. In my analysis and application over the years, VWAP has proven to be a reliable benchmark for gauging the average price weighted by volume, offering a meaningful insight into both the direction and the momentum of price movements. However, it’s essential to remember that no indicator, VWAP included, works in isolation. The most successful trading strategies I’ve employed and reviewed have been those that use VWAP in conjunction with other analytical tools and indicators, ensuring a well-rounded and comprehensive approach to market analysis.
Is Volume Weighted Average Price (VWAP) Reliable?
VWAP’s reliability hinges on its application and the context in which it is used. For intraday trading, VWAP offers a dynamic benchmark that reflects both price and volume, making it a robust indicator for assessing market sentiment. However, its reliability can be influenced by factors like market volatility and volume anomalies. My experience suggests that VWAP’s greatest strength lies in its ability to offer real-time insights into the market’s volume-weighted price, providing a solid foundation for making informed trading decisions.
Conclusion
Has this post given you the confidence to start using the VWAP for your day trading?
It’s a truly simple indicator, but you still need particular skills to use it. The steps in this post can help you to do exactly that.
Make sure to only trade particular VWAP setups that make sense to you. You can also simply use VWAP as a filter for your other trading setups.
One last point: Any time you add a new technique or indicator to your trading strategy, make sure to paper trade it first. Some practice trials can help you work out the kinks and build more confidence with a new tool.
Most importantly, if you’re not on board with our top-of-the-line trading toolbox, what are you waiting for? You can access top-notch charting, paper trading, and scanning abilities, and so much more. Grab a 14-day trial for just $7 today!
What are your favorite day trading indicators? Is VWAP one of them? Leave a comment and share!
FAQs
Is VWAP a good indicator for day trading?
Yes, VWAP is an excellent indicator for day trading, offering a volume-weighted perspective on price trends that can inform both entry and exit decisions. Its widespread use among institutional and retail traders alike underscores its utility and influence in the market.
Is VWAP trading profitable?
Trading based on VWAP can be highly profitable, especially when combined with a disciplined approach to risk management and an understanding of market context. Like any trading strategy, profitability depends on consistent application and the ability to adapt to changing market conditions.
Can VWAP be used on a daily chart?
While VWAP is primarily an intraday indicator, reflecting the average price based on volume for a single trading day, its principles can inform broader trading strategies. However, its direct application is more suited to shorter time frames, providing real-time insights rather than historical analysis.
Can VWAP be used to analyze specific securities?
Yes, VWAP can be applied to analyze specific securities by using its formula to calculate the average price a security has traded at throughout the day, weighted by volume. This is particularly useful when incorporated into candlestick charts, as it adds a volume-weighted perspective to the visual analysis. Each candle on the chart represents a lot of traded securities, and overlaying the VWAP line can help identify where the bulk of trading activity occurred relative to the price range of the day. By understanding these values, traders can make more informed decisions, using the name and behavior of the security to guide their trading strategy.