
A well-rounded trader knows to use every possible analytical method. It’s all part of the process of constantly building and tweaking better trading strategies.
That includes using indicators that can help you predict market activity and adjust your trading strategies accordingly.
Bear with us, not everyone finds indicators super exciting. But what if there’s an indicator that can help you change the way you trade?
One candidate might be the relative strength index (RSI) — a momentum indicator that tracks recent price changes. The RSI has been around for decades and can be an effective method for determining whether a stock is overbought or oversold.
Despite its efficacy and popularity, too many traders overlook this indicator. And far too few even know how to read it and apply it.
We’re changing that right now to help you use this metric in your trades. Today, you’ll get to know the relative strength index, how to read it, and how to use it. Keep reading to learn more about the RSI, an effective analytical metric you need to know.
Click here to download the key points of this post as a PDF
Table of Contents
What Is the Relative Strength Index?
Founded by J. Welles Wilder Jr., the relative strength index is a momentum indicator that operates on an oscillator. That essentially results in a line graph that moves back and forth between two extremes.
The RSI combines a security’s average gain or loss over a set period of time. Traders can then use this information to determine whether that stock is overbought or oversold. The RSI isn’t just for stock-price activity. You can also apply this index to bonds, commodities, currencies, future, and options.
How to Read the Relative Strength Index
To understand how to read the RSI, you first need to understand how an oscillator operates. As it applies to the RSI, an oscillator measures a stock’s performance between two extremes: 1 to 100.
As the oscillator moves toward 100, it indicates that the stock is overbought. As it moves closer to 1, you can often determine that the stock is oversold.
This analysis is particularly useful when evaluating a stock that’s trading on the horizontal, which can make it more difficult to spot trends.
Here’s the general rule: A value over 70 means overbought, while under 30 means oversold.
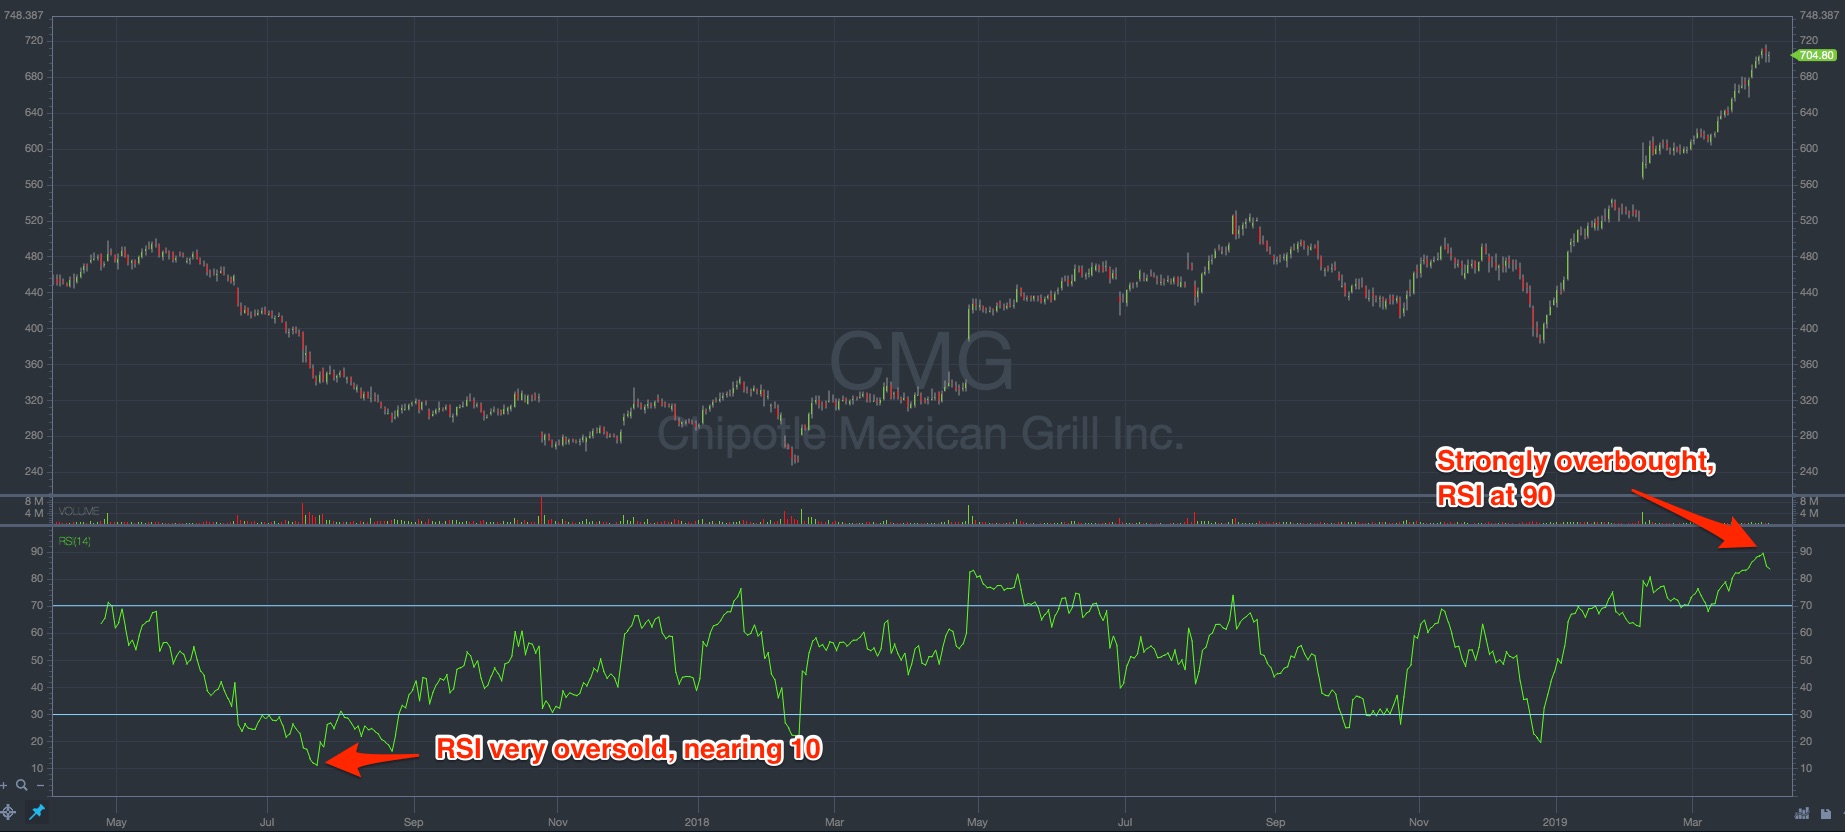
Chipotle Mexican Grill stock shows RSI at extreme levels (source: StocksToTrade)
Now, if a stock is overbought, there’s a good chance that it’ll soon drop in price. And, conversely, an undervalued stock may be about to increase in price.
But you need to know more than just how the oscillator model works. You should also understand how to calculate the RSI …
Relative Strength Index Calculation
The formula to calculate the RSI is fairly straightforward. We can break it down into a few main components — average gain, average loss, and relative strength.
Here’s the formula:
RSI = 100 – (100 / (1 + [Avg. Gain / Avg. Loss])
Keep in mind that the average loss uses positive values. And typically, you use a 14-day period to calculate the RSI.
Let’s look at an example. Say that seven days in this period closed with a 2% average gain, and the other seven closed with an average loss of -0.5%. The calculation would look like this:
80 = 100 – [100 / (1 + [2/14] / [0.5/14])]
In this case, the 14-day relative strength index indicates that the stock you’re evaluating is overbought. You can then use this information and potentially predict that the stock will soon see a price correction.
You can also extend the calculation period for more accurate RSI values using a second formula. This second formula includes the current gains and losses with the previously recorded average gains and losses.
With the data from the first formula, you can now use the following formula:
RSI = 100 – (100 / (1 + [(Previous Avg. Gain x 13 + Current Gain) / (Previous Avg. Loss x 13 + Current Loss)]))
This second step is used as a smoothing technique similar to calculating an exponential moving average (EMA).
Once you calculate the RSI, you can plot the value alongside a stock’s price chart. Generally, as average gains increase, so will the RSI. Average posted gains nearly always outweigh average posted losses.
And guess what happens as a stock’s price drops … Yep, the RSI also drops.
3 Tips on Using RSI
Newbie traders may find it difficult to apply these results to their trading strategy. Why? Usually because the relative strength index remains in the overbought or oversold areas for extended periods of time.
And that’s exactly why we’re here. You just need a little help. With experience and a few tips, you can learn how to use this indicator in the context of a stock’s general trend.
Rely on Other Indicators Too
The relative strength index is a reliable and effective indicator, but it shouldn’t be the sole factor you use to make buy and sell decisions. That’s true of any indicator or factor. It’s all about building a solid approach to your trades.

Often, external factors like news catalysts can cause a stock’s price to drastically rise or fall — almost out of nowhere. These external influences can make RSI values misleading.
RSI should be a part of your strategy, but it shouldn’t be your entire strategy.
Don’t Limit Your Timetable
As we mentioned before, the RSI is typically used to evaluate a stock’s price movements over a 14-day period. But that’s not a strict rule.
There’s nothing to prevent you from applying the RSI to a longer or shorter time period. And basing your calculations on a longer time frame can help you yield more accurate results.
However, remember that shorter time frames, more often than not, can reduce the accuracy of your RSI calculations. And when you rely on a shorter time frame, you can be more susceptible to the effects of volatility and news catalysts.
This isn’t to say that the relative strength index can’t still be useful, but be more cautious when operating on shorter time periods.
Convergence and Divergence: Understand the Difference
When you use the RSI to evaluate trends, it’s critical that you understand the difference between convergence and divergence. Let’s take a closer look …
Divergence
Divergence is when a stock’s price rises to new highs while the RSI declines.
RSI divergence forms at the top of bull markets and is a strong indicator of an imminent price reversal.
If you spot the development of an RSI divergence pattern, be aware that the uptrend will likely soon reverse.
Convergence
Convergence is when a stock’s price drops to new lows while the RSI rises and creates higher lows.
Divergence indicates a potential uptrend reversal, and convergence indicates that a bearish market may soon reverse, meaning prices could rise.
Like divergence, convergence will usually appear before the reversal begins. It can often be an early sign that the price trend will reverse.
While many traders turn to the relative strength index due to its reliability, it can still be misleading and volatile. Remember these three tips when using RSI to help you maintain a big-picture view of your trading strategy and plan.
Understanding Overbought vs. Oversold
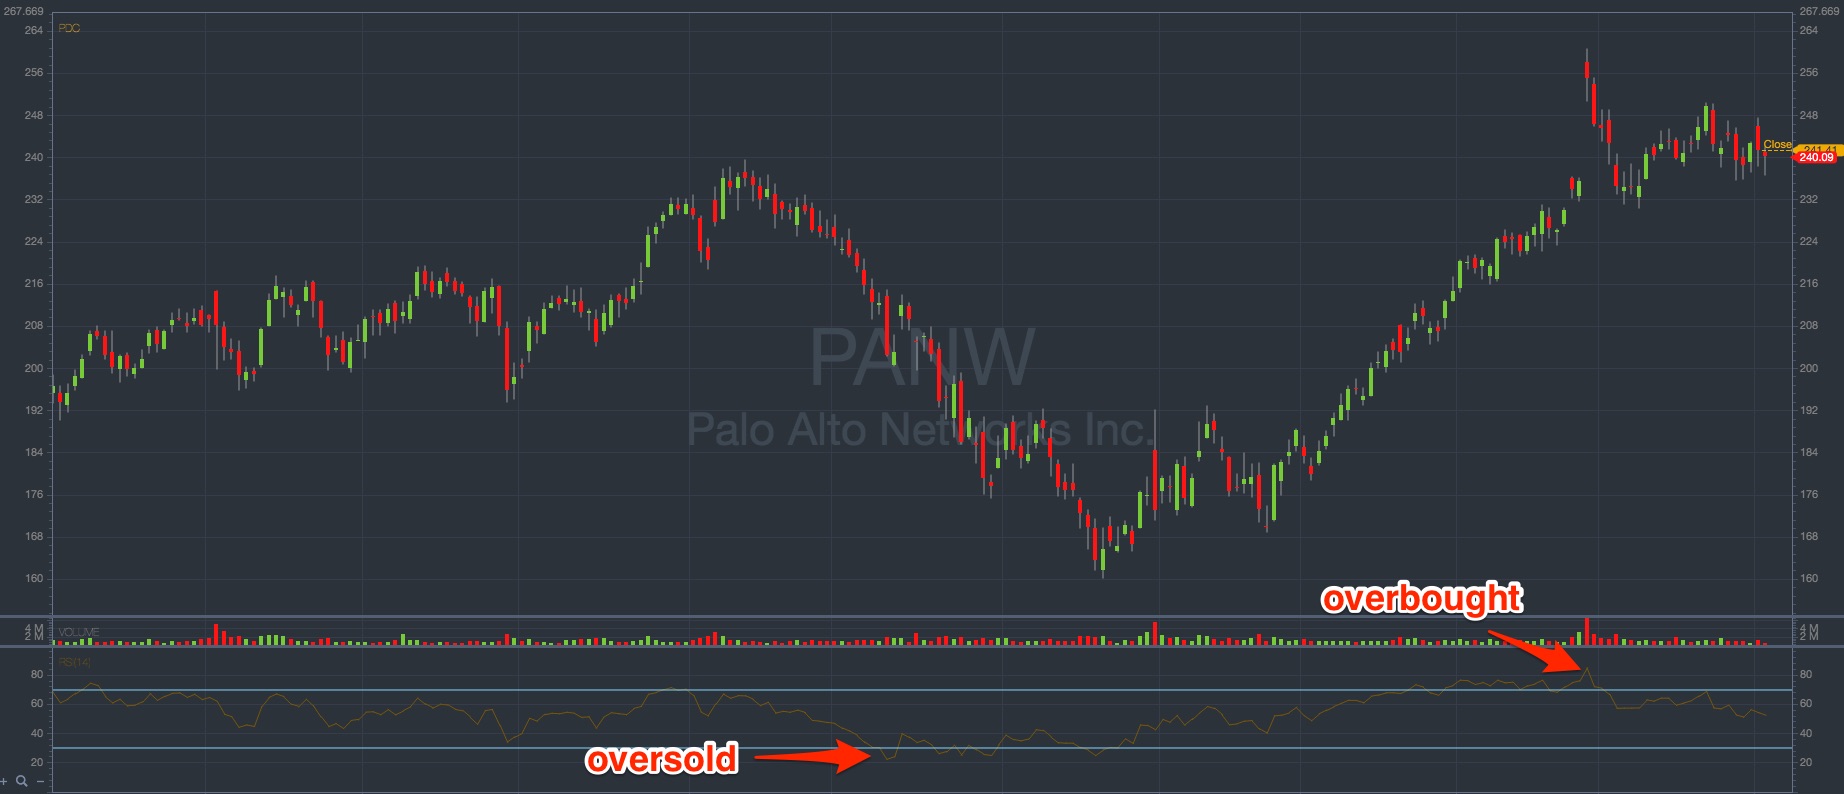
Oversold and overbought conditions on PANW stock (source: StocksToTrade)
Since RSI is mostly used to determine whether a stock is overbought or oversold, you need to know what these terms imply.
Overbought stocks have far more buyers than sellers. As a result, prices increase. You can use the RSI to help you recognize the point at which traders realize that a stock is overbought. This is where they’re more likely to sell off their shares before the trend reverses.
Now, when a stock’s demand suddenly and drastically drops, it’s oversold. This might be due to a news catalyst, such as a poor earnings report or company scandal. As a result, traders may suddenly sell their shares to cut losses.
You can use the RSI to help spot the point at which prices drop so low that traders are likely to purchase shares again. This can be an opportunity to buy.
Again, market analysts generally believe a correction is due when the RSI is either above 80 (overbought) or below 30 (oversold). Learning to recognize reversal points can be a clever way to spot potential trading opportunities.
Take Advantage of StocksToTrade Features
Most effective trading strategies include reliable analytical tools to help traders identify trends and opportunities well in advance. We’ve probably said millions of times by now: Never rely on one analytical tool when trading!
The RSI can a great indicator and help you spot price trends, but it shouldn’t be the only driving force behind your trade decisions.
It’s easier than ever to fully research stocks and use a ton of tools to analyze your opportunities. Your best option? Use a professional stock screener to help you take your trading strategy to the next level. Let’s be real … today’s sharpest traders use screeners that include a variety of resources to help them make intelligent trading decisions.
StocksToTrade Pro is a premier platform designed by experienced traders for traders. This industry-leading stock screener can help you find the trading opportunities that fit your criteria and your needs.
The STT platform includes charts, quotes, real-time market news, watchlists, and many other awesome resources. Traders who use our platform can receive guidance from lead trainer Tim Bohen and access our community forum to chat with trading peers.
Our community — and even some highly accomplished traders — can attest to our platform’s power and reliability. Sign up for a 7-day, $7 StocksToTrade trial today and try these amazing features for yourself!

The Bottom Line
A life of trading is a life of learning. That means you’ve gotta learn it all, including analysis strategies. These tools are crucial to developing and growing your trading strategy.
Performing effective analysis includes knowing how to read and use reliable indicators to predict trends and events before they happen. The relative strength index remains one of the most commonly used price indicators for decades. It can be one of the most effective early indicators of price reversals.
Learning to identify these potential price changes can be a means of finding trade opportunities in both bullish and bearish markets.
But remember … RSI, like most indicators, is susceptible to volatility. It should be part of your strategy, but not your entire strategy.
Curious about other technical indicators? Watch this video:
What indicators do you use to identify trading patterns? What are your tips for using RSI? Let us know in the comments below … we love to hear from you!