
Last week, we discussed meme stocks’ roaring comeback amid major moves from Reddit poster children AMC and GameStop.
This week the momentum continued, spreading from AMC and GME to nearly every retail favorite short squeeze play.
On Wednesday, June 2, price and volume hit a cathartic high note as daily relative strength indexes reached levels not seen since January.
Then today, June 3, the leader of this week’s momentous surge, movie theater chain AMC, announced plans to sell 11 million shares, sending retail traders into a selling frenzy.
In the morning, seemingly every FinTwit darling was getting crushed. But by the middle of the trading day, a reversal seemed to be taking place, sending meme stocks back into a bull run.
So is it time to buy the dip in meme stocks? Or is this final death rattle of a short-lived relief rally?
Let’s look further into AMC, as it is proving to be an excellent case study on multiple fronts, and the perfect vehicle to explain this week’s overall retail rally.
AMC Gifts Free Popcorn, Sells Expensive Shares

Editorial credit: Colleen Michaels / Shutterstock.com
The Reddit rally we covered last week was already in full swing, but on Wednesday the momentum ascended to new highs when AMC launched a special service exclusively for retail traders.
The page features a gracious welcome note thanking traders for their support and includes a redeemable coupon for a free large popcorn upon presenting proof of stock ownership.
At the time the page went live, AMC stock was trading for around $32. Traders rushed to the bid line, insatiably snatching up shares and bullish call options, driving the price up as much as 100 percent on Wednesday, reaching an intraday high of $72.62.
After all, concession stand prices have inflated enormously in recent years…
$72 for a large popcorn is a steal… right?!
The bottom-up bullishness was brought to a halt on Thursday morning when the company announced plans to sell up to 11.5 million shares to cover costs related to “general corporate purposes.”
This is almost certainly a euphemism for paying down debt, or possibly for plans to buy more real estate and expand their theater footprint.
Regardless, traders never like to see a corporation sell into strength, as it’s often interpreted as a sign that the company views its stock as overvalued.
AMC is more or less admitting as much, writing “we believe that recent volatility and our current market prices reflect market and trading dynamics unrelated to our underlying business, or macro or industry fundamentals, and we do not know how long these dynamics will last.”
But around noon on the east coast, the retail warriors regained control, setting up a near-perfect case study in multiple areas of technical analysis.
The Chart Traders Dream Of…
Wednesday and Thursday’s price swings in AMC shares weren’t unprecedented, as they were foreshadowed largely in January when the first GameStop short squeeze took place.
But this time, the technical indicators on the chart were nearly perfect, and provide excellent examples to look for on similar charts in the future.
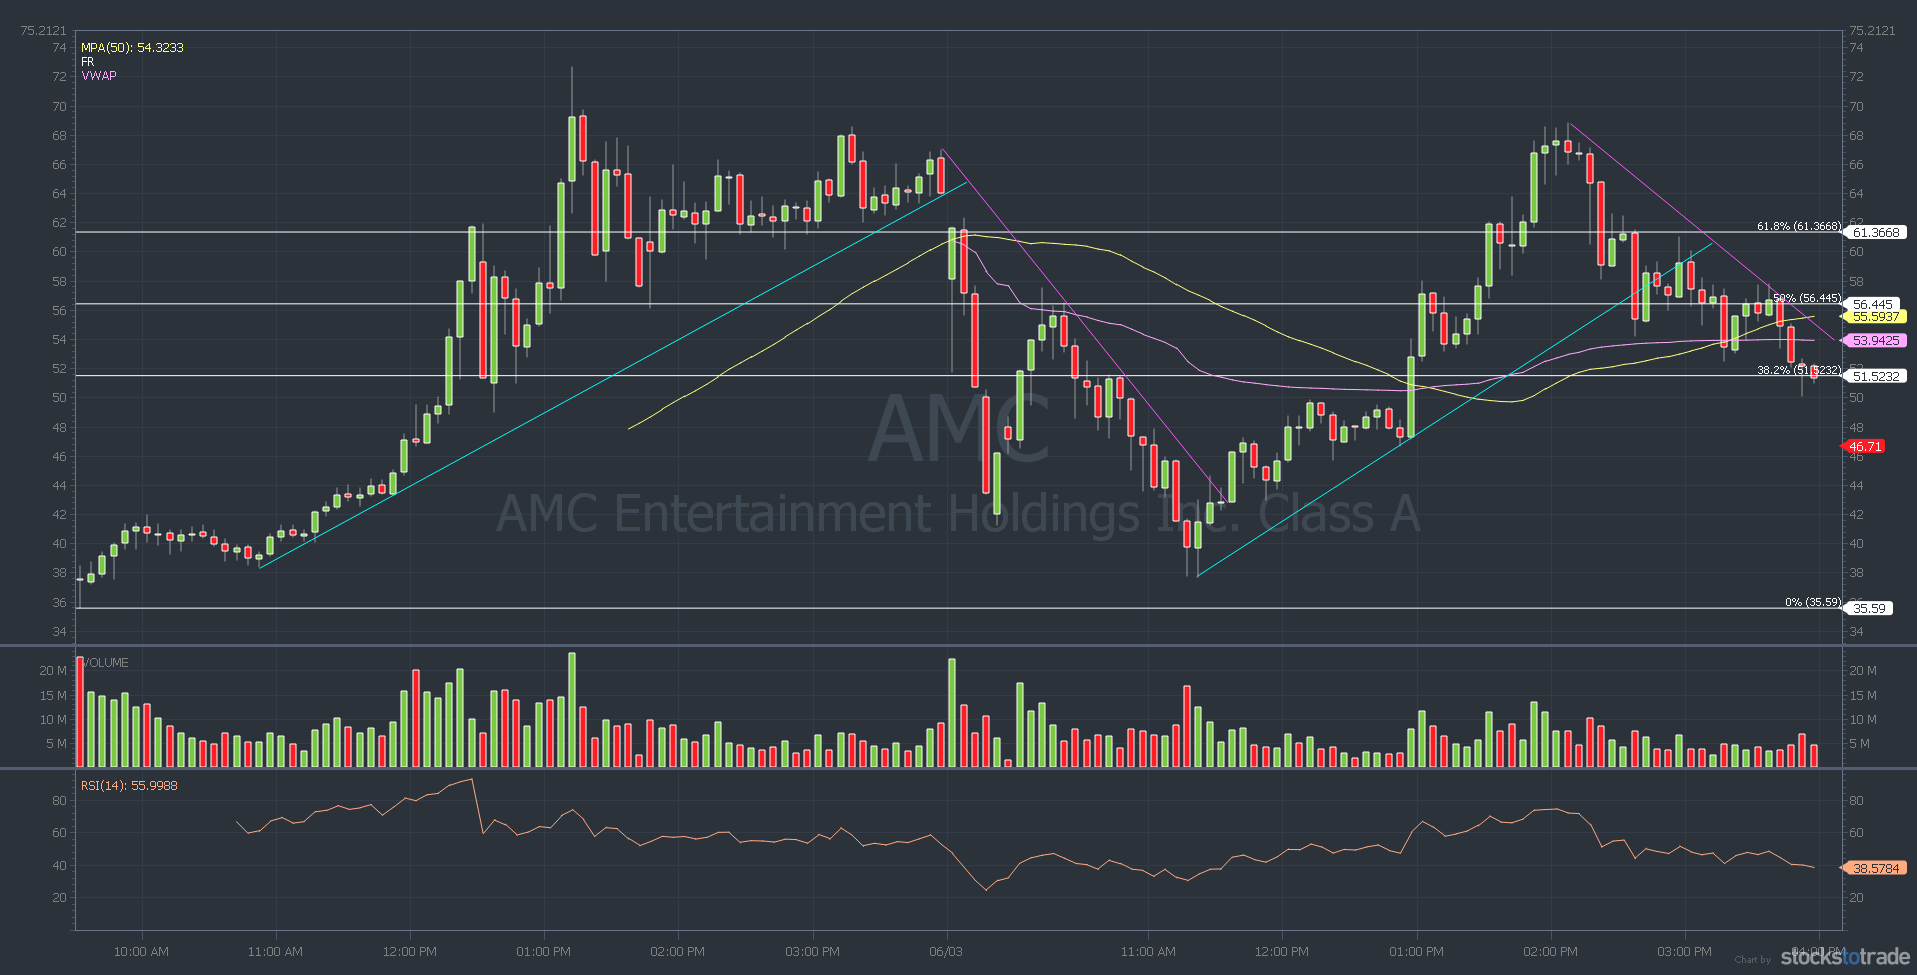
Each time an established downtrend or uptrend was broken on considerable volume in the last two days, AMC stock made a head-spinning reversal.
First off, the uptrend that formed on Wednesday morning was textbook. AMC’s share price continually bounced off the same trendline, over and over again, before ultimately blasting off into true gamma squeeze territory around lunch time.
After reaching its high of $72.62, AMC shares began to sell off, ever so slightly, until they found support at $56.13.
Once support was established at this level, the chart resumed following alone the bullish trend line established at market open, rallying another 18 percent into the close.
Thursday morning, AMC’s stock offering news put a damper on sentiments. The stock opened at $58.50 and immediately began dumping. The downtrend was as perfect as the uptrend from Wednesday.
This time AMC found support at a key Fibonacci retracement level, landing near the 50.0 retracement at $37.97.
After backtesting this level, AMC began yet another violent rally, forming a nearly identical uptrend to the one on Wednesday. This move took the stock as high as $68.60.
In extended hours on Thursday, AMC shares were struggling to clear the 61.8 Fibonacci retracement, trading for $47.81 at the time of writing.
Thoughts on Technical Indicators
Dizzy yet? Join the club!
Even for experienced traders, the volatility in AMC over the past two days is whiplash-inducing.
Technical indicators are very important, but they can also be confusing.
Price, volume, RSI, Fibonacci retracements, options flow… it’s overwhelming to extrapolate from all of these simultaneously.
When there are so many to choose from, how do traders know which to pay attention to and which to ignore?
It takes trial and error to decide which indicators work for you, and there aren’t a lot of shortcuts to this epiphany.
It comes from spending a lot of time reading charts, identifying patterns, and taking close notes of how the price action reacts to said patterns.
Once you see that every time Stock XYZ nears a certain RSI or price level, it backs off (or rallies), it becomes difficult to ignore. When XYZ nears those levels again, you’ll have it marked in your charting software, and you could be prepared for the move before it happens.
But what about AMC? Should traders buy or hold? Short or sell?
The reality is, buying AMC stock today is almost like placing a sports bet.
Retail traders vs. hedge funds … by buying or shorting the stock you’re picking which team you think will win.
Not necessarily in the long term, but in the span of your trading period.
The recent volatility is out of control, so it’s probably advisable for newbie traders to steer clear of trading AMC at these levels.
For experienced scalpers or swing traders, however, this is a fantasy come to life. They wait years for this sort of volatility and price action.
It is a rare occurrence when a stock moves 100 percent intraday and call options rise thousands of percent overnight.
If you’re confident in your technical analysis, your reading of the tape, or your overall feeling of market momentum — stick to your strategies and strike while the iron’s hot.
Cover image editorial credit: Editorial credit: IgorGolovniov / Shutterstock.com