
How do you use Fibonacci retracements to trade?
That’s a good question … and one a lot of traders want an answer for.
The Fibonacci retracement tool is one of the most popular trading tools. It’s also one of the most misunderstood.
The thing is, once you learn how to use it, it can become one of your go-to indicators. It’s another tool to help you understand and plan for stock price movements — even in this volatile market.
This tool is one of the best ways to help you see areas of support and resistance.
Interested in using it?
You’re in luck — that’s what we’re discussing today.
Let’s get started!
Table of Contents
- 1 What Are Fibonacci Ratios?
- 2 What Are Fibonacci Retracement Levels?
- 3 Why Use Fibonacci Retracement in Trading?
- 4 Understanding Fibonacci Retracements
- 5 How to Calculate Fibonacci Retracement
- 6 How to Use a Fibonacci Retracement
- 7 How to Interpret Fibonacci Retracement
- 8 How to Use Fibonacci Analysis in Trading
- 9 What Are the Limitations of Fibonacci Retracement Levels?
- 10 Frequently Asked Questions About Fibonacci Retracements
- 11 Try Out StocksToTrade
- 12 Conclusion
What Are Fibonacci Ratios?
Leonardo Fibonacci was a mathematician who sought to reveal the structure of nature and the universe. The ratios derived from his work have been used to describe predictable patterns in both art and science.
Technical analysts use the ratios to find patterns in financial markets. They use retracement ratios — 23.6%, 38.2%, 61.8%, and 78.6% — to calculate support and resistance levels. Why those numbers? Keep reading…
They’ll also use 50%, even though it’s not one of those ratios, because there’s a theory (the Dow theory) that a trend has a good chance of continuing once there’s been a 50% retracement.
What Are Fibonacci Retracement Levels?
Traders who use technical analysis consider Fibonacci retracements a favorite tool.
They’ll connect two relevant price points, such as a high and a low, and the indicator provides horizontal lines — Fibonacci retracement levels.
The levels are based on the ratios I mentioned earlier: 23.6%, 38.2%, 50%, 61.8%, and 78.6%. Curious about those ratios? Here’s the deal … They’re the results of a mathematical formula stemming from Fibonacci’s idea that each number relates to the one preceding it.
Take a look at the chart below. The red lines are the Fibonacci retracement levels.
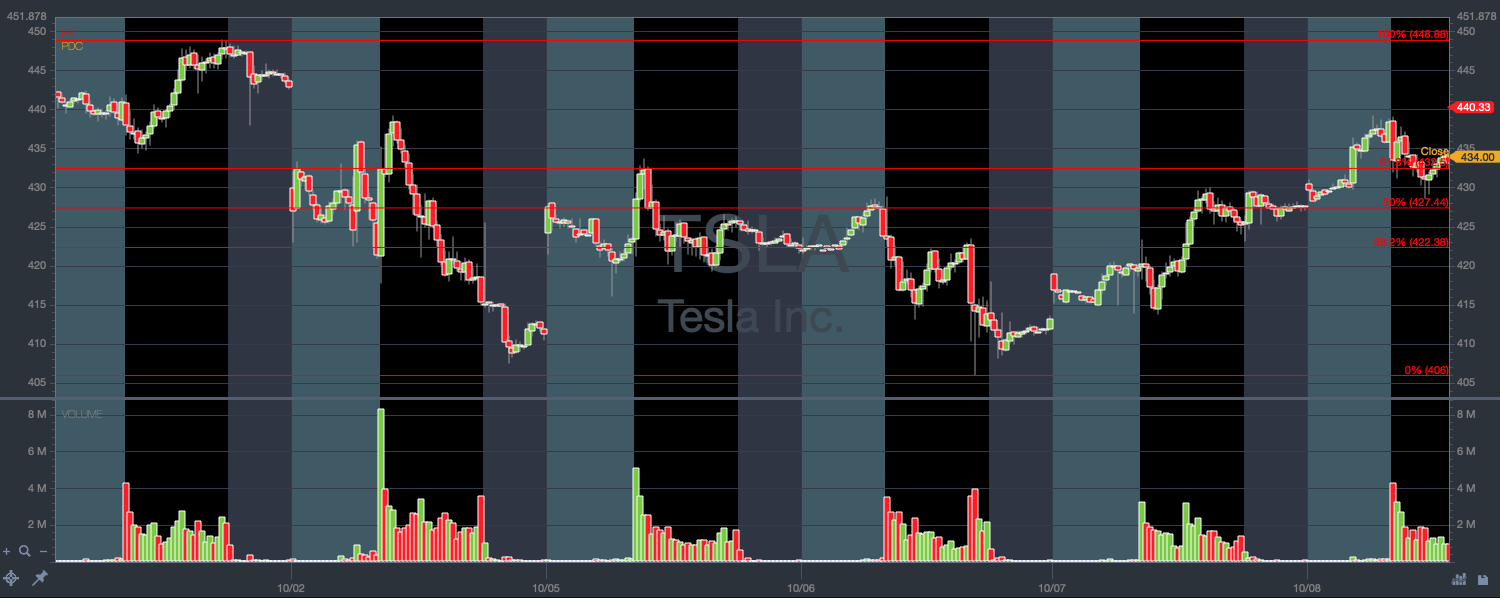
Tesla Inc. (NASDAQ: TSLA) 10-day chart (Source: StocksToTrade)
Why Use Fibonacci Retracement in Trading?
Fibonacci retracement levels are areas of support and resistance that traders can use to determine points of price consolidation or reversal.
These levels don’t work all the time, but if the tool is used correctly, they can be surprisingly accurate.
Let’s use a sports analogy…
If you were going to spar with someone in a boxing ring, would it help you to know if your opponent favored using a particular punch?
It might. If you knew which punch was coming, you might be able to avoid it.
Traders use the ratio levels to alert them to possible reversals that can go against their trading plans. Just being aware of these areas helps them prepare.
Understanding Fibonacci Retracements
Now that you know what a Fibonacci retracement is, let’s take a deeper look at some related terms.
Fibonacci Extensions
Fibonacci extensions are similar to Fibonacci retracements in that they use the same measuring ratios of 23.6%, 38.2%, 50%, 61.8%, and 78.6%.
Fibonacci retracements help determine price pullbacks. Fibonacci extensions, on the other hand, indicate profit-taking points and how far a stock might go after a breakout.
Fibonacci Projections
Fibonacci projections are similar to Fibonacci retracements and extensions in that they use the Fibonacci ratios to calculate support and resistance levels.
Where projections differ from the other two is that they account for a current price swing in relation to a previous price swing in its calculation.
How to Calculate Fibonacci Retracement
There isn’t really anything you need to calculate. The retracement levels are simply percentages of whatever price range you choose to measure.
When it comes to trading, it makes sense to have a Fibonacci retracement tool to calculate and draw lines for you. A good software platform will have one available so you can do your research.
How to Use a Fibonacci Retracement
This is easy. To use a Fibonacci retracement, pull up a chart of a stock and time frame you want to research…
Next, select the Fibonacci retracement tool, and the software does the work for you. Let’s take a look at an example from StocksToTrade…
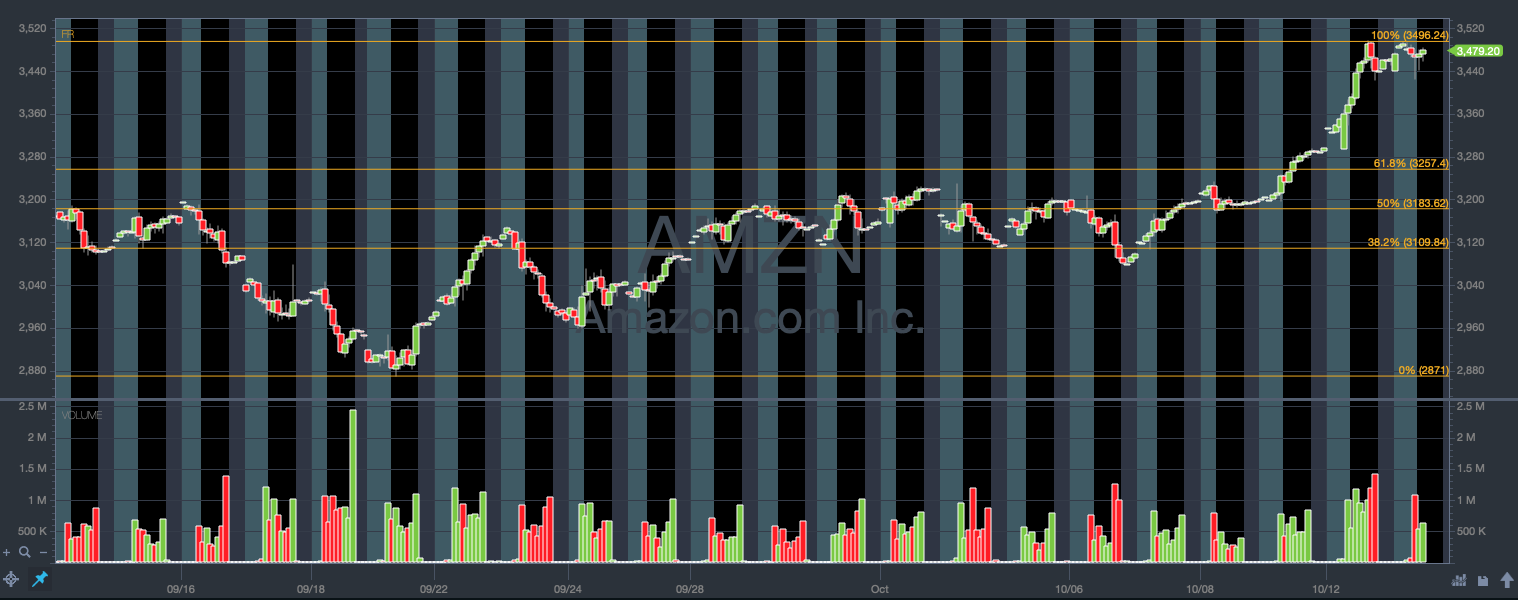
Amazon.com Inc. (NASDAQ: AMZN) 1-month chart (Source: StocksToTrade)
In the next section, we’ll interpret what we see on the chart.
How to Interpret Fibonacci Retracement
In the above example, we’re looking at Amazon.com Inc. (NASDAQ: AMZN) in September and October 2020. The tool measures from the low of that time frame, September 21.
Notice how the Fibonacci level at that price is 0%. That’s because it’s the starting point and we’re measuring the retracement move from there.
As the stock price moves up, look at how it respects the 38.2% and 50% levels before it makes a run to a full 100% retracement.
Now imagine if you were aware that the 38.2% and 50% levels were possible resistance areas before it made that move. Do you think that could have helped you with your trading plans?
Of course — if you know how they can help you build solid trading plans.
The 0% level could have been a possible stop-loss, and you could have taken partial profits at 38.2% or 50%. Or you could have potentially bought some shares once the stock proved itself by passing the 61.8% level.
More knowledge brings more opportunities.
How to Use Fibonacci Analysis in Trading
Now that you have a basic knowledge of how Fibonacci retracements work, I’ll give you a few tips on how to use it for trading.
Support and Resistance
One of the most important aspects of trading is being aware of areas of support and resistance. When you trade a stock, you’re attempting to predict future price moves and form trading plans according to those predictions — hopefully resulting in a profit.
If used correctly, Fibonacci retracements can show levels of support and resistance.
Areas for Entry
Areas of support — and areas where a stock price consolidates — are possible places to enter a trade. If you can enter a trade before it makes a significant move, you have more potential to profit.
Let’s take a look at another chart …
Zoom Video Communications Inc. (NASDAQ: ZM) has been a hot stock in this volatile pandemic market, and it made a move on October 13.
If traders had been watching this particular stock, they could have used Fibonacci retracements to look for areas of entry. Notice how the price respected the 38.2% level.
A possible entry would have been when it passed the 61.8% level and volume increased.
The more you use Fibs in your strategy, the more you’ll see that the 61.8% level is an important area.
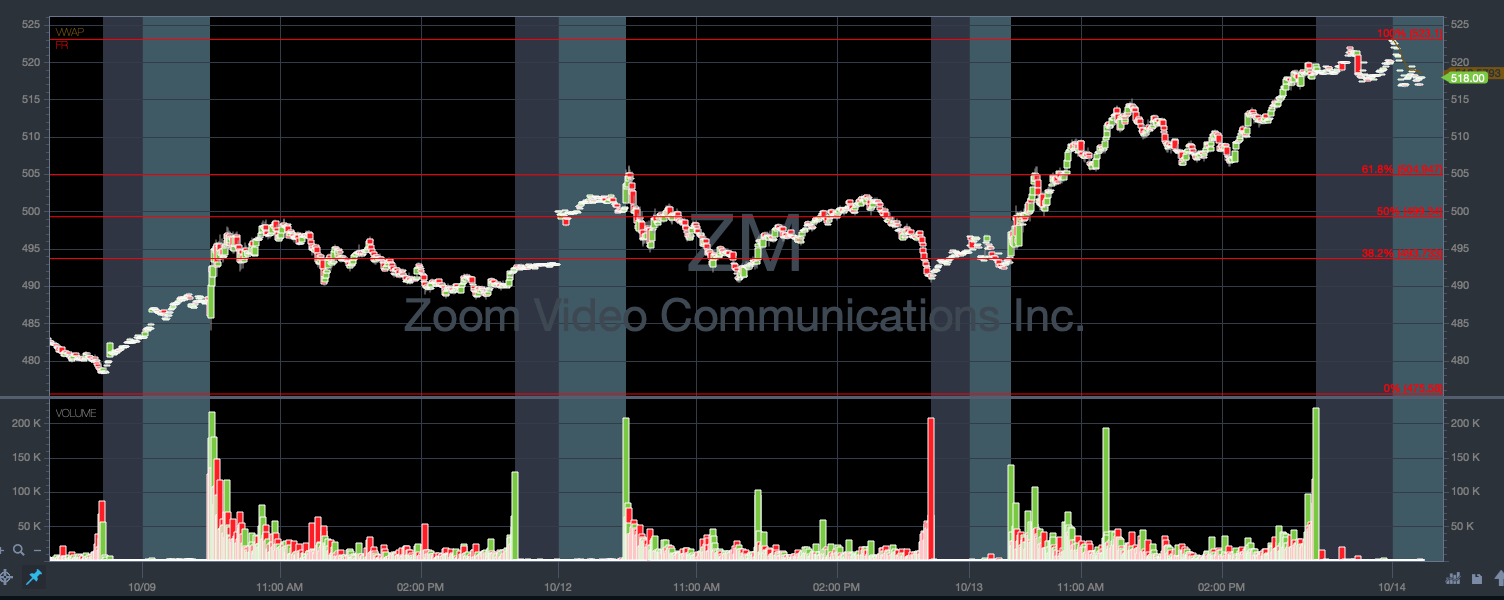
Zoom Video Communications Inc. (NASDAQ: ZM) 5-day chart (Source: StocksToTrade)
It’s true, this market has been incredibly volatile. Want to learn more about volatility? Check out “The Volatility Survival Guide.” I put in a special appearance in this guide that Tim Sykes made specifically for this crazy market.
Areas to Take Profits
Areas of resistance — those points where a stock price may make a reversal — are good places to take profits or exit a trade altogether.
Remember, a lot of trading is about limiting your risks … If you can see areas of potential danger coming, you can make trading plans to try and avoid them.
Using the example above, a trader might be confident in swing trading ZM because it ended the day strong and with a burst of volume.
A smart trading plan could include taking at least some profits once it breaks past the 100% level.
Shorting Stocks
Fibonacci retracement levels can also be useful when shorting stocks. The ratio levels can also be areas of stock reversal.
Take a look at Workhorse Group Inc. (NASDAQ: WKHS). Remember how I said the 61.8% level is key?
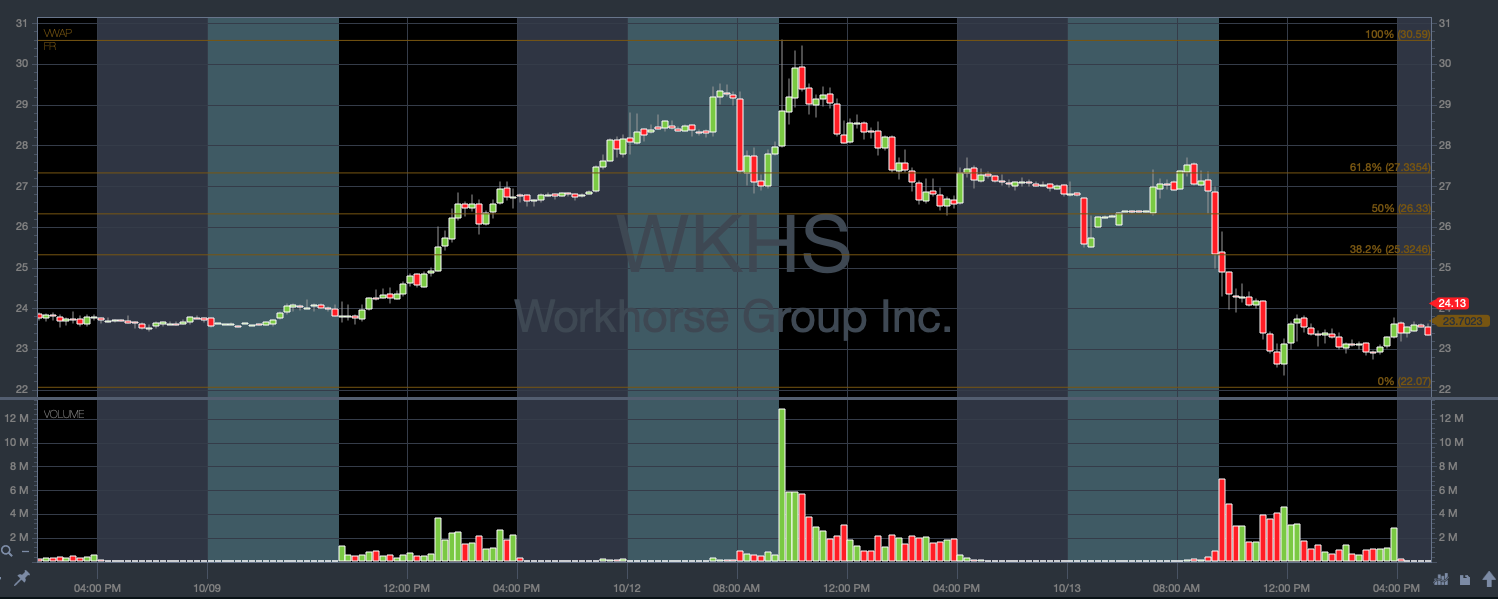
Workhorse Group Inc. (NASDAQ: WKHS) 5-day chart (Source: StocksToTrade)
On October 13, the stock struggled at this price point and eventually reversed to the downside. The 61.8% level would have been a good entry for a short.
Look for Trend Changes
One of the best ways to limit your risks in trading is to trade with a long-term trend.
If you know a stock has a strong trend to the upside … you can take on more risk if you go against it and trade to the downside.
You can use Fibonacci levels on long-term charts to stay aware of trends and watch for trend reversals.
Take a look at this six-month chart of the S&P 500 (NYSE: SPY). It’s clearly in an upward trend, and you can look at the ratio levels for areas of resistance. Here, it’s struggling at the 100% level.
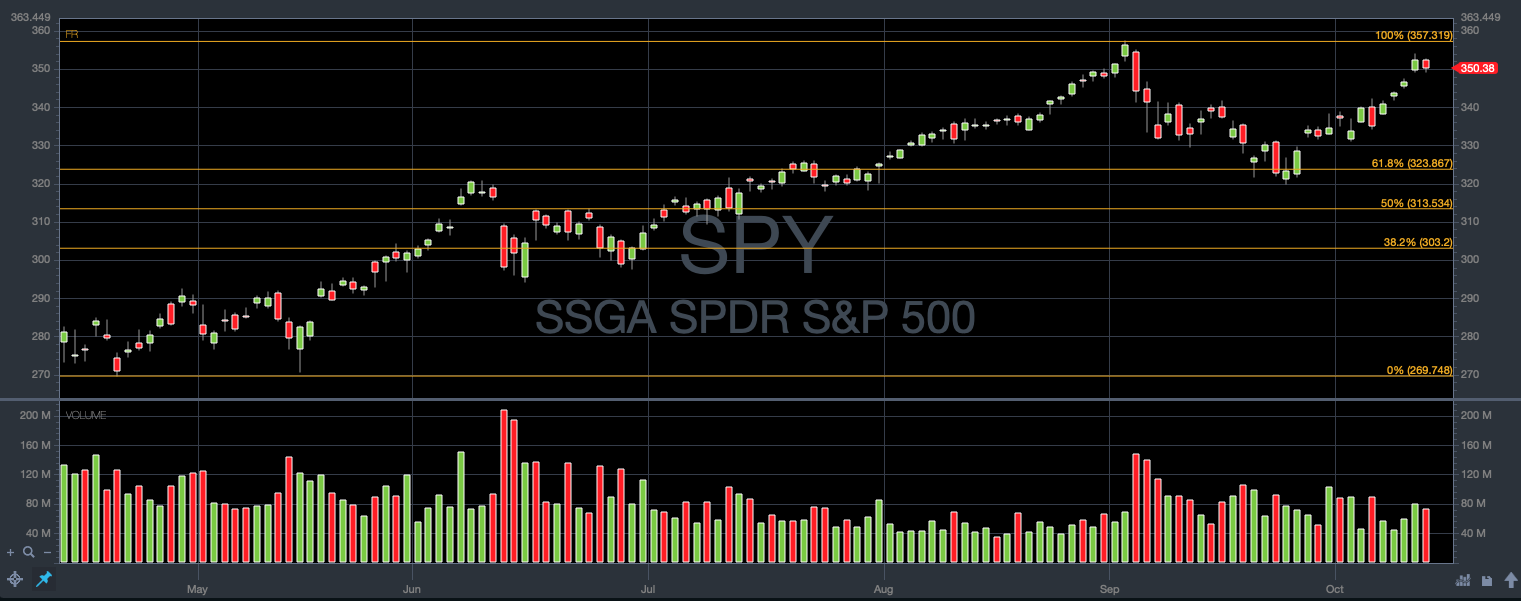
S&P 500 (NYSE: SPY) 6-month chart (Source: StocksToTrade)
What Are the Limitations of Fibonacci Retracement Levels?
A lot of traders love using Fibonacci retracement levels … But like any other tool or indicator, it has limitations.
Remember our boxing analogy?
Imagine if you entered a boxing match thinking your opponent was only going to throw a left jab. You’d have a good chance of avoiding all the left jabs … but then get knocked out by a right cross!
It’s important to be aware of what’s actually happening with a stock’s price and react wisely.
The ratio levels are just guides to help give you an edge. Remember to make your trading plans — and get out of your trades if your plan fails.
Frequently Asked Questions About Fibonacci Retracements
Let’s take a look at some commonly asked questions about this great tool.
What Is Fibonacci Retracement Theory?
The theory behind this trading tool is that the same Fibonacci ratios that are used to recognize patterns in nature can be used to find patterns in the financial markets.
What Is Fibonacci Strategy?
This trading tool uses Fibonacci ratios to determine support and resistance areas for stock movements. By recognizing these areas, traders are able to use patterns to make trading plans that — hopefully — will be profitable.
Are Fibonacci Retracements Reliable?
This is a trick question. If you use them correctly, they can be reliable. As with any tool, you need practice to learn how to do that. You need to devote a lot of screen time to studying Fibonacci retracements so you can see patterns and make smart decisions.
Try Out StocksToTrade
Interested in using Fibonacci retracements for your trading research?
If so, you’re in luck! StocksToTrade has this tool, along with tons of other tools and indicators. We think it’s the best trading experience available. The platform was designed by traders for traders. It comes loaded with easy-to-read charts, built-in scans, watchlist capabilities, and so much more.
You can try StocksToTrade for 14 days for only $7 here.
Conclusion
Now you have a good, basic understanding of Fibonacci retracements and how they work.
There’s a good reason so many traders like them.
Having the ability to read charts is extremely important if you want to trade well consistently … and this tool can help you break down a chart so that you can be aware of important areas for your trading plans.
It’s available on the StocksToTrade platform, so give it a go!
Don’t want to learn how to trade alone? Join the SteadyTrade Team today and learn alongside mentors and a group of like-minded traders. Every day, we provide members with mentorship, webinars, chat, trading education, community, and more. It’s all so you can ask questions, get answers, and develop your own trading style.
Have you used Fibonacci retracements while trading? What do you think about them? Leave a comment below!