
Veteran traders use stock trend analysis to spot market trends … Then they swoop in with a plan to trade the meat of the move.
That’s how top traders become top traders. But far too many others rely on hope and greed. They continue holding a stock long after the music’s over.
How do we overcome this to make smarter, more calculated trades? How do we analyze stock trends without letting emotions interfere?
Let’s get into stock trend analysis and how you can use it in your trading. I’ll give you a few examples to get you started. Read on!
Table of Contents
- 1 What’s Stock Trend Analysis?
- 2 Why Stock Trend Analysis Is Important for Traders
- 3 Advantages of Using Stock Trend Analysis
- 4 What Are the Top Trend Indicators?
- 5 How Do You Analyze Stock Trends? 6 Tips for Traders
- 6 Stock Trend Analysis Techniques
- 7 Stock Trends Charts: 5 Real-Life Examples
- 7.1 Super League Gaming Inc. (NASDAQ: SLGG) — Strong Uptrend
- 7.2 Bayport International Holdings Inc. (OTCPK: BAYP) — Clean Uptrend and Downtrend
- 7.3 Ault Global Holdings Inc. (AMEX: DPW) — One and Done
- 7.4 Tesla Inc. (NASDAQ: TSLA) — Broken Trendlines
- 7.5 Thai Airways International Public Co. Ltd. (OTCPK: TAWNF) — Strong Intraday Uptrend
- 8 Frequently Asked Questions About Stock Trend Analysis
- 9 Stock Trend Analysis: Conclusion
What’s Stock Trend Analysis?
Stock trend analysis is using past price action to predict a future trend. Trends tend to continue — whether they’re intraday or long term.
Stock trend analysis is both a science and an art. We analyze all kinds of stocks in the SteadyTrade Team. I run twice-daily live webinars and mentor a team of dedicated traders. If you’re looking for mentorship and a community to help you learn the ropes, sign up today!
What Is a Stock Trend Line?
A stock trend line is a sloping line that connects the candles of a candlestick pattern on a stock’s trend chart. Traders use this line to gauge whether a stock is keeping with the trend or breaking it.
Use a trend line with other trend indicators to confirm price action.
Why Stock Trend Analysis Is Important for Traders
Traders want a clear trend in a stock. Whether long or short, they want to be on the right side of the move. Staying with the trend will usually be more profitable than fighting it.
The time horizon doesn’t matter. Big moves always start as little moves — whether it’s quick momentum or a year-long swing.
There are several ways to analyze a stock trend. I’ll get into some of them later. First, let’s cover the advantages.
Advantages of Using Stock Trend Analysis
Stock trend analysis is part of technical analysis. Besides signaling stock direction, stock trends can indicate entries and exits. Stock trend analysis — along with other indicators — can help you be more confident in your trades.
What Are the Top Trend Indicators?
Trendline
A trendline connects points in a chart. Here’s how to show an uptrend on a candlestick chart…
If three or more bottom wicks align, draw a line from the bottom left of the three candles to the top right. That’s the trendline … No candles should cross below this line.
A downtrend is the same thing in reverse. You’d draw a line from the top left to the bottom right.
Some trends will still continue even when the trendline breaks.
Support
A support level is the lowest range where a stock tends to trade. It’s generally a level where the stock has consolidated and held a number of times.
I use support levels in my risk management. I place my stop slightly under the support level, depending on how volatile the stock is. Sometimes there will be a shakeout just under support, and the stock bounces right back up.
Resistance
A range that a stock won’t tend to rise above is a resistance level.
I avoid buying stocks that have a lot of resistance. I love it when stocks hit all-time highs without any resistance — especially when they break through previous strong resistance levels.
Sometimes a stock breaks a resistance level, only to get stuffed right back down. Support and resistance levels aren’t perfect — they’re ranges.
Moving Average
A moving average is the rolling average price over a certain number of days. One that traders commonly use is MA-50, the 50-day moving average.
Moving averages are useful because stocks don’t always have clear trendlines. If the price is above the moving average, it will tend to continue higher. And if the price is below the moving average, it’ll probably trend lower.
VWAP
VWAP stands for volume-weighted average price. VWAP averages the price during the current day while taking volume into account. If the price is above VWAP, that means most longs are profiting. And if the price is below VWAP, the opposite is true.
I love VWAP. Stocks holding over VWAP are more likely to go higher, so I use it to confirm a bullish thesis. If all other indicators are telling me a stock’s bullish, but it’s been under VWAP all day — I don’t trade it.
Previous Day’s Close
This indicator tells traders if the stock is green (above the previous day’s close) or red (below that level) on the day. A green stock is a bullish indicator, while a red stock is bearish. And if the stock is zipping over and under the indicator, it’s undecided.
How Do You Analyze Stock Trends? 6 Tips for Traders
#1 Focus on Hot Sectors
When growing a small account, capitalizing on sector momentum is key. Prepared traders know how to play hyped-up sectors. The hype creates a tailwind for other stocks in the hot sector to trend higher. Bigger than expected gap-ups or rallies are common.
Hot sectors tend to trend up. If all indicators are pointing down, but the stock is in a hot sector … watch out! There’s a good chance the stock will continue higher.
#2 Read the Chart
The best way to analyze stock trends is to read the chart. A chart tells a detailed story about the stock’s price action.
Does the daily chart look like it’s filled with one-and-dones? Do stocks with big green days end up closing far below their highs? Do the daily candles end up as dojis? And do the following days’ candles trend lower? If so, the stock probably won’t uptrend — even if other indicators are showing that it will.
On the other hand…
Does the daily chart look like it’s had multiple breakouts followed by multi-day rallies? More likely than not, a breakout will become an uptrend if other indicators are also leaning that way. A breakout to all-time highs with no overhead resistance has a great chance of becoming a multi-day rally.
#3 Look for Volume
Volume, volume, volume! There needs to be a lot of volume for a stock to have a solid trend. I ignore trends on weak volume. There aren’t enough traders in the stock to move it.
No stock begins a strong trend on weak volume. I say this all the time in my Pre-Market Prep sessions … If you’re not already tuning in, catch me every trading day at 8:30 a.m. Eastern. I go live to talk about the market and the day’s big movers.
Ebbing volume is a sign a trend might be weakening. This isn’t a great entry point if you’re looking to get in on a trend. But it might be a signal to exit a position.
#4 Have a Catalyst
A strong catalyst can start a new trend. Did a company finally get that big government contract? There’s a good chance it will have a multi-day uptrend. Did a company that was expected to beat earnings estimates report a huge loss instead? You could expect a multi-day downtrend.
The key is to focus on important catalysts — the ones that really move the stock.
#5 Use Multiple Indicators
Most traders see a few bullish indicators for a stock and jump right in … But experienced traders like being as certain as possible. They look for the stars to align so they have the best odds of success.
Smart traders make sure they have a lot of signals pointing in the right direction. Then they plan where they’ll enter. If they miss a subpar play — it’s no sweat. The next bus is around the corner.
#6 Don’t Chase
Remember, it’s OK to miss a trend … There will always be another one. Whether your scanner missed it or you were on a coffee break — learn to let go of trends that already moved.
Want the best trends on your radar? Then use the best tools for the job. StocksToTrade lets you choose from pre-built scanners or work with your own customized scans. We designed our platform to be intuitive and easy to use. Get your 14-day trial for $7 today! And to see how you can keep up with the hottest catalysts, get your trial with the Breaking News Chat add-on for $17.
Remember to follow your plan on your trend entry. And forget the stocks that don’t fit your plan.
Stock Trend Analysis Techniques
Look Left
To analyze a stock trend, pull up the daily chart and read it closely. Note any trends and big volume days. Were the stock’s moves bullish or bearish? Is the trend over the last year or so up or down?
Past price action is a key to future price action.
Review the Current Trend
See if the stock is currently in a trend. Have the last few days been solid green days? Or has the stock just started its uptrend and is on its first or second green day?
It’s best to get in a trend as soon as all the indicators confirm it or on a dip right after. If the stock isn’t in any trend, it’s best to wait until it sets up — on both daily and intraday charts.
First Green Day
Traders aim to buy a stock at the beginning of an uptrend and sell when it shows signs of reversing. That’s why I get in immediately after a stock shows me a buy signal. If I miss it, I miss it — no sweat! I don’t try to chase.
Chasing a stock that’s been green for 10 days in a row probably sets you up for a big loss.
Reversal
There are usually indicators before a stock breaks an uptrend. This could be decreasing volume, a large panic, a crack of a trend line, or price holding under VWAP.
These are usually a sign for longs to exit their positions.
First Red Day
With lower-priced stocks, the first red day is the kill shot of the momentum. The volume increases as the stock starts downtrending. The pump is over, and holders will start selling shares fast. The multi-day run is done, and the stock will likely have a multi-day fade. Short sellers love shorting the first red day, especially on OTCs.
Stock Trends Charts: 5 Real-Life Examples
Super League Gaming Inc. (NASDAQ: SLGG) — Strong Uptrend
This stock slowly rallied for a few months. Then it picked up steam and held its uptrend line. The growing volume and breakout over the highs make it a candidate for an even greater uptrend.
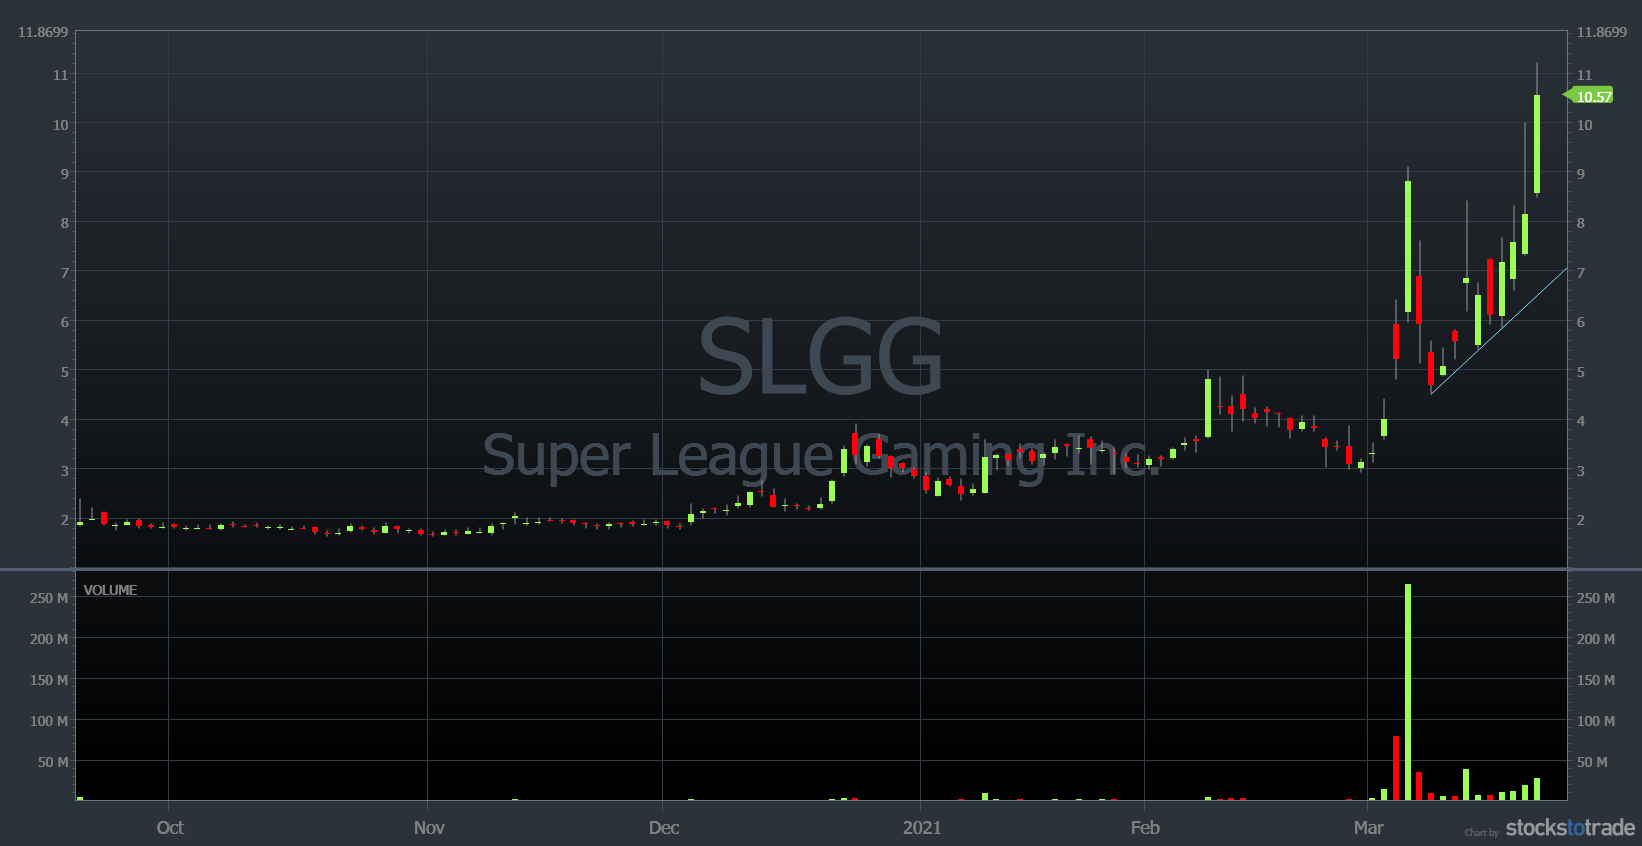
Super League Gaming Inc. 6-month chart (Source: StocksToTrade)
Bayport International Holdings Inc. (OTCPK: BAYP) — Clean Uptrend and Downtrend
BAYP steadily gained steam for several days. But it started losing volume as the green days went on. It had a blow-off top on the last day of its rally. It went from the $18s to almost $34 that day! That was the end of its run — it had an incredible panic in the afternoon that marked the end of its uptrend.
The first big red candle was in on high volume. After a bounce the following day, the stock kept downtrending. In fact, a few days later it was halted and suspended from the OTC exchange. It will reopen on the gray market — likely far below its halted price.
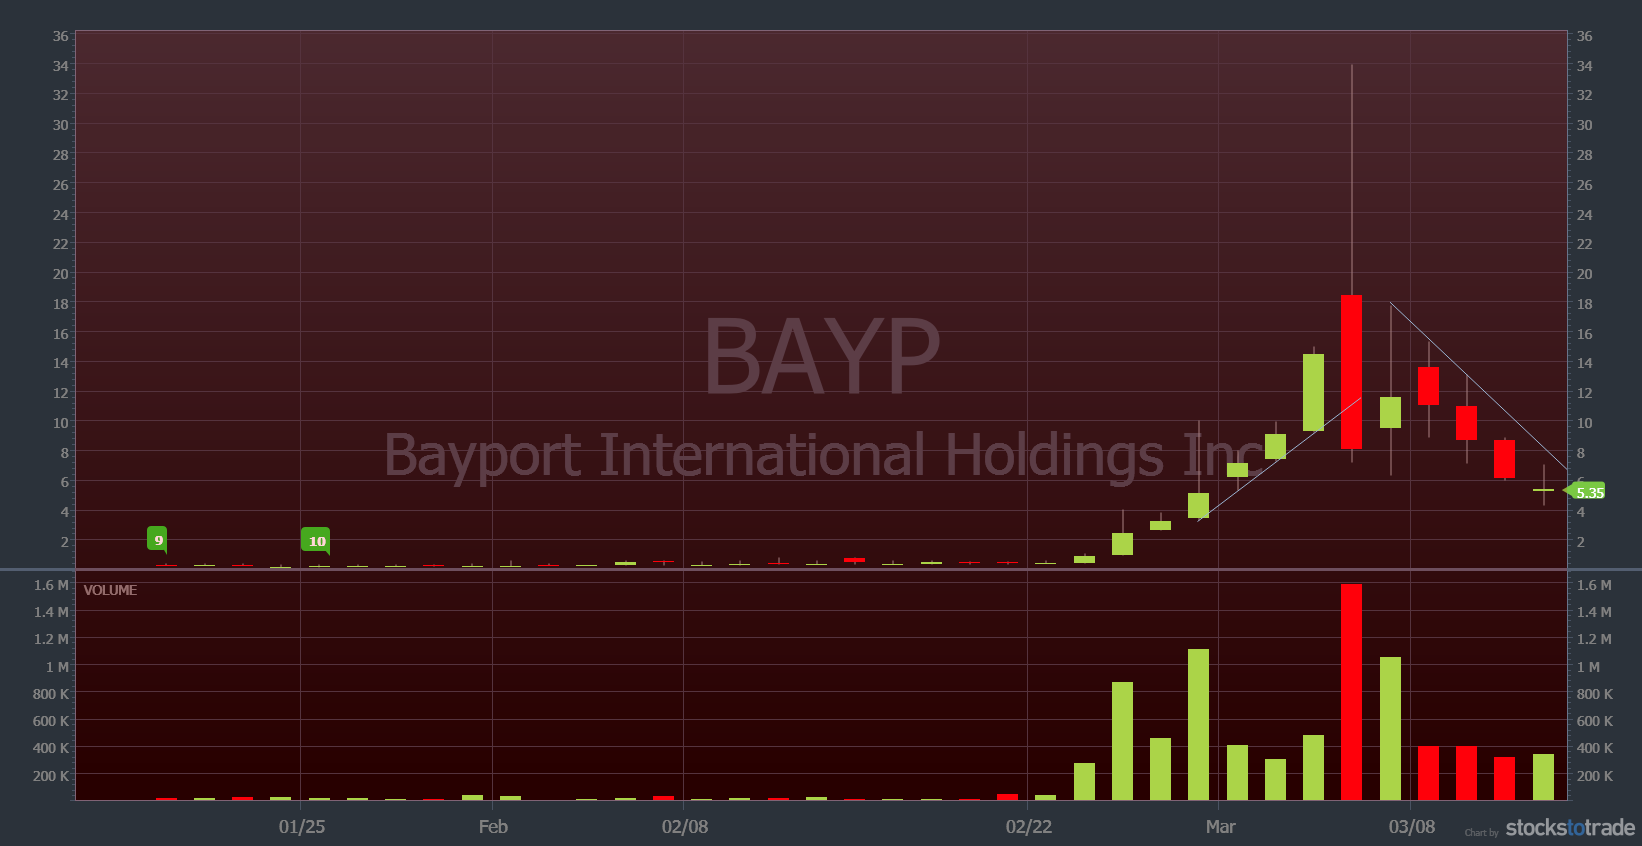
Bayport International Holdings Inc. 2-month chart (Source: StocksToTrade)
Ault Global Holdings Inc. (AMEX: DPW) — One and Done
This stock had a couple of one-and-dones in 2020 — those are circled on the chart. In each case, it was after the company released relatively good news.
It had another weak breakout in November 2020, again after a news release. It was only able to rise one day before selling off again. This stock will likely keep fading … until the next press release.
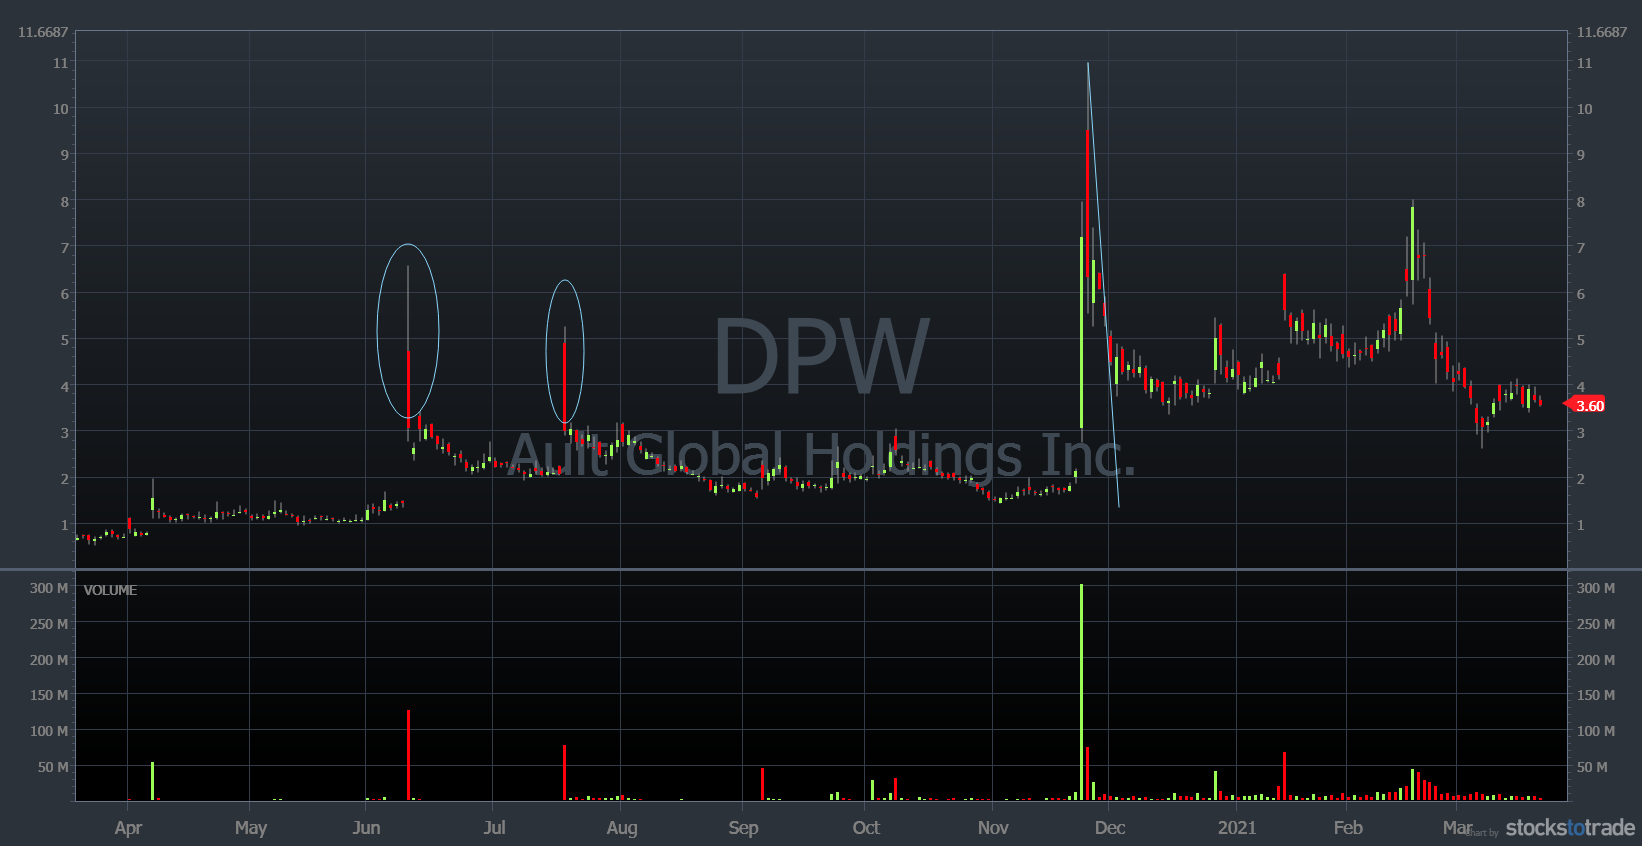
Ault Global Holdings Inc. 1-year chart (Source: StocksToTrade)
Tesla Inc. (NASDAQ: TSLA) — Broken Trendlines
One of the most hyped stocks in recent memory, TSLA slowly uptrended for months. That changed in late January 2021, when the stock broke both trendlines. It sold off over 30% of its market cap after breaking through the trendline.
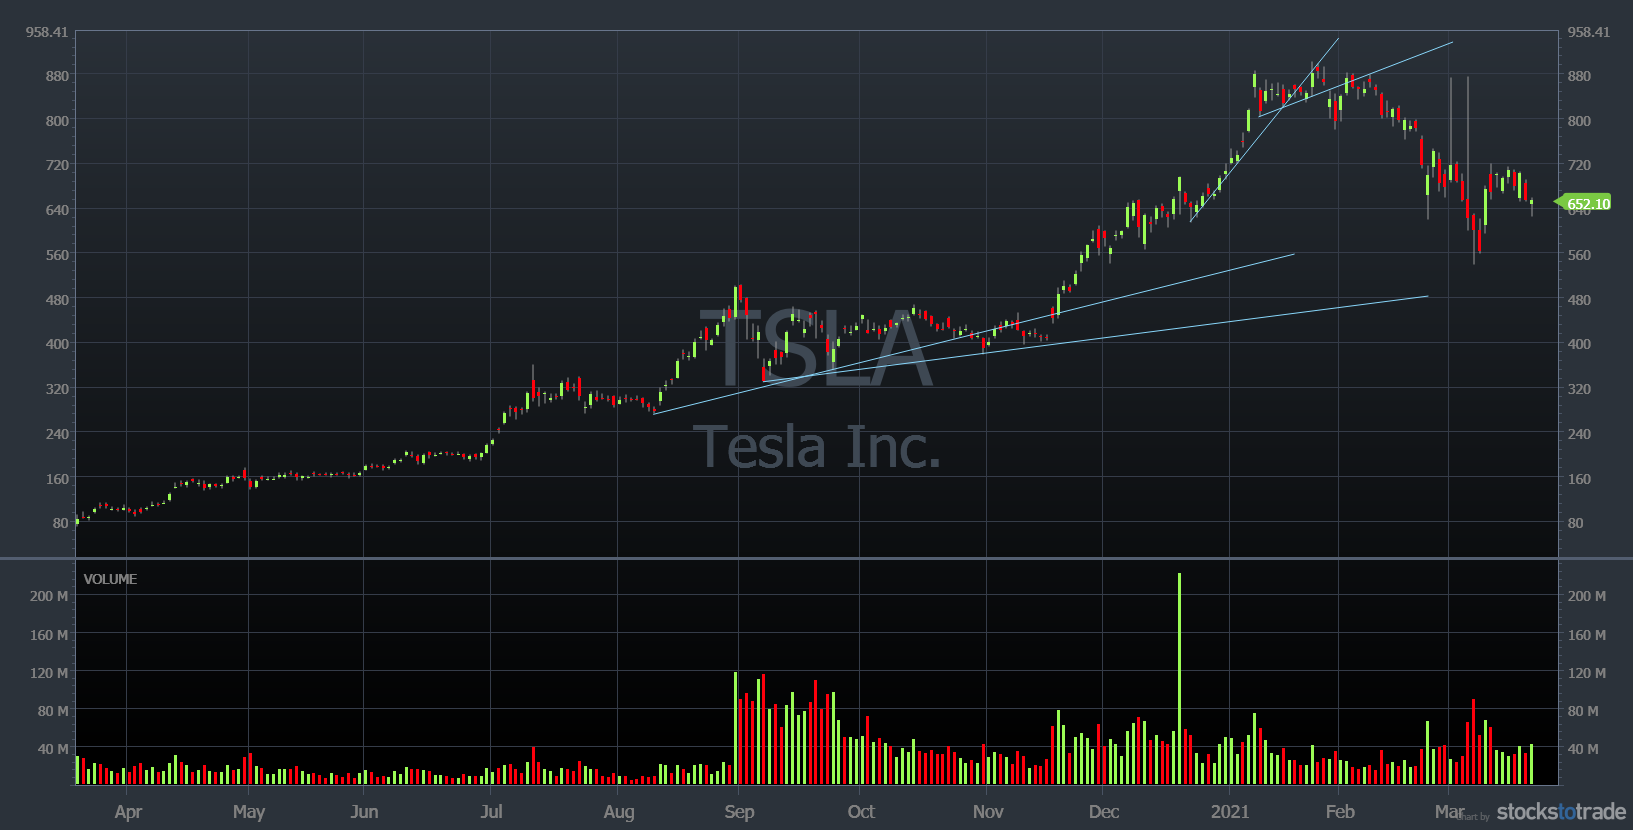
Tesla Inc. 1-year chart (Source: StocksToTrade)
Thai Airways International Public Co. Ltd. (OTCPK: TAWNF) — Strong Intraday Uptrend
Here we see a very strong uptrend, a response to a positive press release in the morning. The stock held VWAP from 11 a.m. on. The midday consolidation led to a massive rally and continuation in the afternoon. This helped the stock rally into the close. The action was similar to my VWAP-hold high-of-day break pattern.
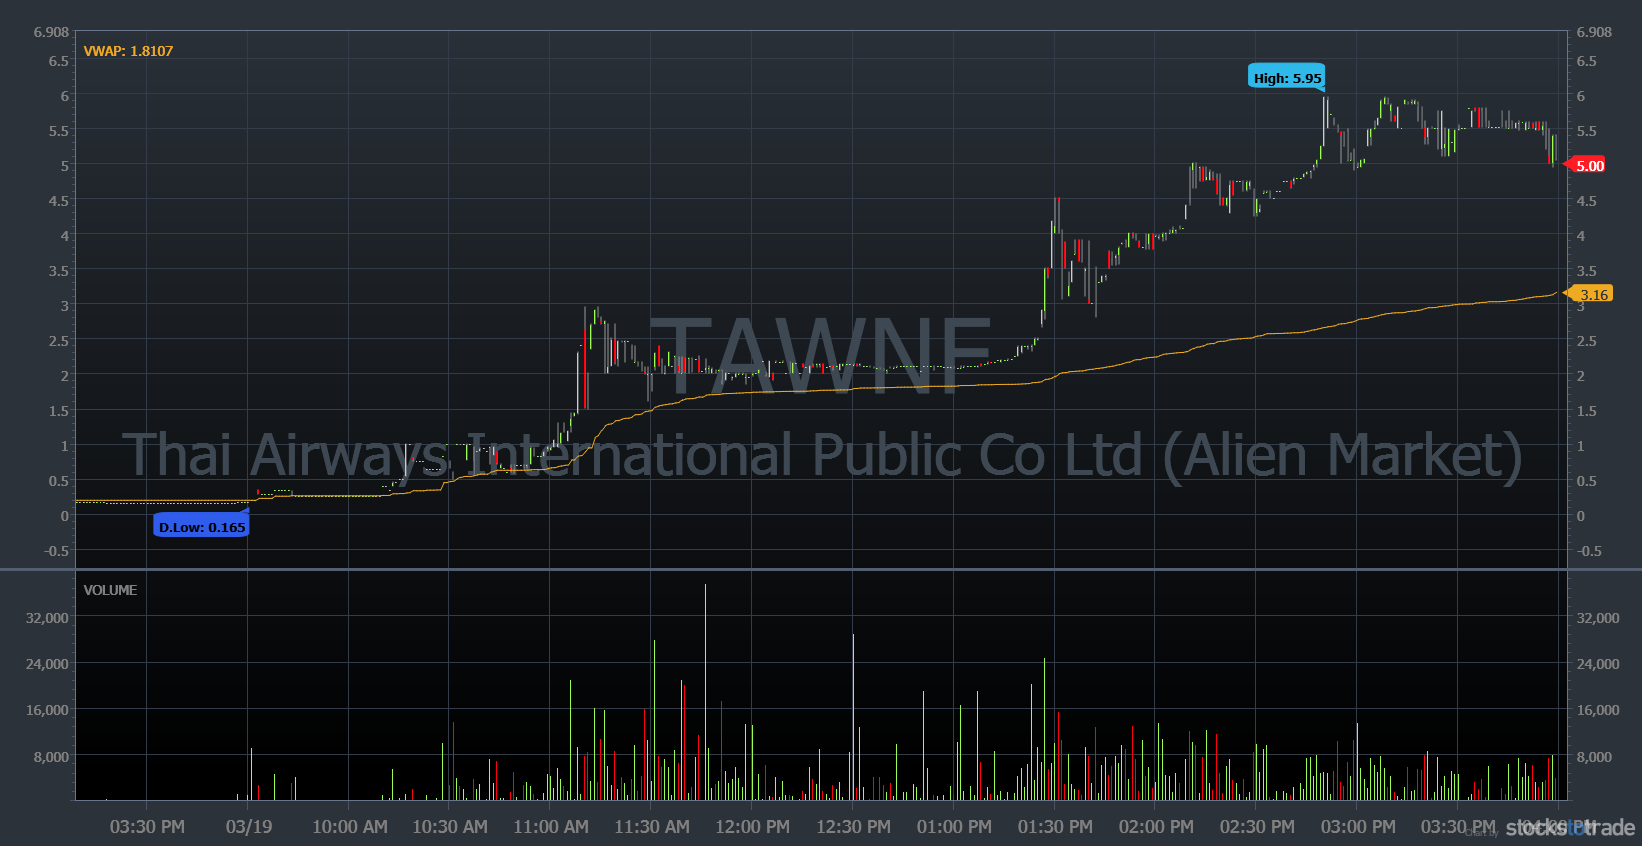
Thai Airways International Public Co. Ltd. 1-day, 1-minute candle (Source: StocksToTrade)
Frequently Asked Questions About Stock Trend Analysis
How Do You Analyze a Stock?
There’s technical and fundamental analysis. In penny stock land, I rely heavily on technical analysis. I’ve gotten a feel for it by reading chart after chart.
How Do You Know When a Stock Will Go Up?
You don’t. That’s why I’m always prepared to take a loss … no matter how good a setup looks. In trading, the odds are stacked against you. The best thing to do is stack the odds in your favor. Then focus on trading high-odds setups.
How Do You Know if a Stock Market Trend Is Valid?
A market trend is valid when multiple indicators point in the same direction. And it will be valid until it starts to show signs of reversal. Some stocks will show clear signs of a trend change.
Stock Trend Analysis: Conclusion
Traders use trends to decide which stocks have an edge that may fit their strategies.
It’s all about spotting those big trends and riding the momentum with a plan and risk management. Stock trend analysis can help traders know when to get in or out.

We review trends and more in our SteadyTrade Team webinars. If you’re looking for guidance on spotting trends and refining your trading techniques, join the SteadyTrade Team today!
What stock trends are on your radar? How do you approach stock trend analysis? Leave a comment below!