
Why are continuation patterns important?
We’ve all been there. A stock spikes without you. It trends up all day. You could’ve made a tidy sum, but you missed your shot.
Looking back at the end of the day, you see that you could’ve gotten in at multiple points and still pull off a winning trade.
Then it happens again — you miss your shot. So this time, you just hop in, thinking it’ll be like last time … And you wind up with a losing trade.
That’s why you need to know how to identify patterns and continuation signals. You can stop the madness and make smart trades. But you must know the right signs.
Ready to level up? Read on to learn how to spot and trade continuation patterns.
Table of Contents
- 1 What Is a Continuation Pattern?
- 2 Continuation Patterns vs. Reversal Patterns: What’s the Difference?
- 3 Advantages of Using Continuation Patterns
- 4 Bullish Continuation Patterns
- 5 Bearish Continuation Patterns
- 6 Top Candlestick Continuation Patterns
- 7 How to Identify Patterns in Stocks
- 8 How Do You Trade Continuation Patterns?
- 9 Continuation Chart Patterns: Practical Examples
- 10 Conclusion
- 11 Frequently Asked Questions
- 11.1 Is a flag a continuation pattern?
- 11.2 What is the most reliable continuation pattern?
- 11.3 What is the difference between continuation and reversal?
- 11.4 How do candlestick patterns inform investment advice?
- 11.5 Can candlestick patterns be used across different financial products?
- 11.6 What role do candlestick patterns play on trading sites and their services?
What Is a Continuation Pattern?
A continuation pattern is a trading pattern that shows up in a trend. It’s a shape the stock chart makes. These patterns signal that the trend will continue.
Continuation patterns are a big part of technical analysis. They’re great to have in your trading toolbox.
Stocks don’t go straight up and straight down. It might look that way on a daily chart … But in fact, those big moves are the result of hours of price action.
Sometimes you’ll get a panic or a short squeeze and see parabolic moves. But for the most part, stocks move in trends over time.
How can you trust the trend? How do you know you’re not buying at the top? Or selling at the bottom?
Sorry — you never know. Even the most reliable patterns fail sometimes. That’s why risk management is so important. But continuation chart patterns can help improve your odds.
Why Should You Use Candlestick Patterns When Trading?
Candlestick patterns like the ones we’re talking about in this article are vital tools for traders due to their ability to reveal market sentiment and potential price movements. Originating from Japanese rice traders, these patterns provide visual insights into the battle between buyers and sellers within a specific time period. By analyzing the formation of these patterns, traders can make informed decisions about when to enter or exit trades.
One of the key advantages of using candlestick patterns is their versatility. They can be used alongside other indicators to confirm trading signals, adding an extra layer of accuracy to your trading strategy. Patterns like the doji, hammer, and engulfing patterns can help identify potential reversals or continuations in the market, providing traders with valuable information about price momentum and control.
Through my years of trading and teaching, I’ve found that mastering candlestick patterns can significantly enhance a trader’s ability to predict price movements. By integrating these patterns into your analysis, you can better understand market dynamics and improve your overall trading performance.
To get into candlestick pattern analysis, your first step should be checking out this article on candlestick patterns.
And here’s my candlestick cheatsheet:

How to Use Continuation Patterns
Continuation patterns are crucial for traders looking to capitalize on the ongoing trend. These patterns indicate that the existing trend will likely continue after a brief consolidation period. Recognizing continuation patterns, such as flags, pennants, and wedges, can help traders enter trades with confidence, knowing that the trend is likely to persist.
Using continuation patterns effectively involves identifying the pattern formation and waiting for the breakout. During my trading and teaching career, I have emphasized the importance of patience and confirmation. For instance, a flag pattern forms after a strong price move, followed by a consolidation phase that resembles a rectangle. The breakout from this consolidation signals the continuation of the trend, providing a clear entry point.
Incorporating continuation patterns into your trading strategy allows you to leverage the strength of an ongoing trend. This approach helps manage risks by confirming the trend’s direction before committing to a trade, ultimately improving your chances of success.
What Is a Continuation Signal?
A continuation signal is the confirmation part of a continuation pattern. It’s one thing to know how to identify patterns in stocks. Knowing how to play them is another thing. The signal is the trigger part of your trading plan.
Once the continuation pattern forms, you’re looking for price action to confirm the continuation. The signal improves your odds of success.
How do you know what stocks are in play? What if you don’t know how to find trending stocks in the first place? We’ve got you covered! In StocksToTrade’s Small Cap Rockets, we alert potential big movers. Check it out today…
Continuation Patterns vs. Reversal Patterns: What’s the Difference?
A continuation pattern signals a trend will continue, and a reversal pattern signals the trend will reverse.
Some continuation patterns can be reversal patterns. It depends on where they happen in the trend. You can also see failed continuation patterns as reversal patterns.
Take, for example, the ascending triangle. If you spot an ascending triangle as part of an upward trend, it’s a harbinger of continuation. At the bottom of a trend, it signals a reversal. But let’s say you’ve got an ascending triangle at the top of a trend. It fails to break out. That could be a sign that the trend is reversing. It may be out of steam.
Advantages of Using Continuation Patterns
FOMO can be a game killer. If you’re undisciplined, it can be an account killer, too.
But if you’re keen on your continuation patterns, missing the initial breakout doesn’t have to ruin your day.
Sometimes it’s hard to catch that first run. Especially when it happens during extended hours. But if you can identify the key levels and spot these patterns, there’s still a chance to jump on the trend.
One of the great things about a continuation pattern is that it gives you clear entry signals. You don’t have to guess about where to get in.
My favorite continuation pattern is the VWAP-hold high-of-day break. It’s a great afternoon pattern for new traders.
Bullish Continuation Patterns
Continuation patterns are similar whether you’re looking at bullish or bearish trends. If a trend is bullish, that means the price is going up. If it’s bearish, the price is going down.
The basic chart patterns are the same. I’m talking about flags, pennants, triangles, and rectangles. Once you identify the trend, these patterns signal continuation.
On the bullish side, you’ve got bull flags, bull pennants, ascending triangles, and rectangles. You can find these in any time frame, and they’re all telling you the same thing. The trend wants to keep going.
There are some less conventional bullish patterns — like the OTC swizzle and the ABCD, or gun, pattern.
OTC Swizzle
This continuation pattern looks like a rectangle. You get a spike in the morning, followed by all-day consolidation. The bottom of that consolidation is your risk level. The initial high is the breakout level.
When it breaks out past the initial high, that’s your continuation signal.
ABCD or Gun Pattern
This pattern usually follows a dip and rip. It’s also rectangular.
The stock breaks high of the day in the morning. The old high of day becomes support, and the new high of day becomes resistance. The stock swoops down near the old high of day but holds it.
This creates a rounding bottom on the chart. The stock holds above the old high throughout the day and starts to creep up into the end-of-day ‘power hour.’ If it breaks above the new high of day, you’ve got a continuation on your hands.
This pattern has only two theoretical points of resistance. The chart itself may not look like a rectangle. But if you draw a horizontal line across the top and across the bottom, you’ll see it.
Bearish Continuation Patterns
Bearish continuation candlestick patterns are like their bullish cousins. The only real difference is the price is going down.
You’ve got bear flags, bear pennants, and rectangles. On the bearish side, triangle continuation patterns work a little differently.
Triangle Continuation Pattern
In a bearish trend, the ascending triangle signals a reversal. But a descending triangle is a bearish continuation pattern. It’s no coincidence that a descending triangle pattern in a bullish trend can signal a reversal.

Triangles show us price congestion. The price gets squeezed into a narrow range between a trend and a resistance level. Sometimes triangles form by price action squeezing between two trends. That’s called a wedge.
With triangles, the first swing — high or low — is your key level. A break of the key level with volume will be your continuation signal. If it breaks past the opposing swing, that’s a reversal signal.
Say a bullish-trending stock swings up to $1.50. Then it pulls back to $1.25. It moves back up to $1.50 and comes down to $1.35. Your key levels are $1.50 and $1.25.
If it breaks past $1.50 with volume, that’s a continuation signal. If it breaks under $1.25, that’s a reversal signal.
Pennants
A pennant looks like something between a triangle and a flag. It’s a tight little triangle that follows strong directional movement.

The main difference between a triangle and a pennant is the distance the price retraces. A triangle tends to have larger swings. A pennant’s price stays in a tighter range and narrows faster. Think of them as sharp flags.
If the price moves beyond the initial swing, that’s your continuation signal.
Flags
A flag follows a steep price move. The price shoots up or down, creating a pole. It then consolidates in a symmetrical range. The range doesn’t have to be — and usually isn’t — horizontal.
The top trend and bottom trend are parallel. When the price breaks above the top or below the bottom, that’s your continuation signal.

Rectangles
Beautiful rectangles! Also called channel or range plays. You get a clear resistance line across the top. Nice clean support line on the bottom. The best ones are parallel and horizontal.
A rectangle is a good example of consolidation. The stock’s holding near its highs. You’ve got a clear support level to risk off of. It tells you exactly where the breakout point is.
If a stock breaks through resistance, that’s your continuation signal. If it breaks below support, that’s a reversal.
Let’s say you like bearish patterns … A stock falls down, consolidates — that forms a rectangle. If it breaks below support, it’s a continuation signal. If it breaks above resistance, it’s a reversal.
You don’t always get such clean plays, but when you do it’s awesome.

Top Candlestick Continuation Patterns
Candlestick continuation patterns are essential tools for traders aiming to predict the persistence of a current trend. Recognizing these patterns can provide valuable entry points and confirm the ongoing direction of price movements. Each pattern offers insights into market sentiment and potential future prices.
Gaps
Gaps are powerful continuation patterns that occur when there is a significant price movement between trading sessions, leaving a gap on the chart. These gaps indicate strong momentum and are often followed by a continuation in the same direction. There are different types of gaps, including breakaway, runaway, and exhaustion gaps, each providing valuable insights into market strength and potential price targets.

Three White Soldiers / Three Black Crows
The three white soldiers pattern is a bullish continuation pattern that consists of three consecutive long-bodied candlesticks, each closing higher than the previous one. This pattern indicates strong buying pressure and a continuation of the uptrend. Conversely, the three black crows pattern is a bearish continuation pattern with three consecutive long-bodied candlesticks closing lower, signaling strong selling pressure and the continuation of the downtrend.
Rising Three Methods / Falling Three Methods
The rising three methods is a bullish continuation pattern that starts with a long white candlestick, followed by three smaller candlesticks that consolidate within the first candlestick’s range. The pattern concludes with another long white candlestick, confirming the uptrend. The falling three methods is its bearish counterpart, indicating a continuation of the downtrend after a brief consolidation period.
Separating Lines
Separating lines are continuation patterns that occur when a black candlestick in a downtrend is followed by a white candlestick that opens at the same level as the previous close and continues upward. This pattern indicates a continuation of the bullish trend. In a bearish context, a white candlestick is followed by a black candlestick opening at the same level and continuing downward, signaling a continuation of the bearish trend.
Matching High / Matching Low
Matching high and matching low patterns are continuation patterns where two consecutive candlesticks have the same high or low price. In a matching high pattern, the repeated high suggests strong resistance, potentially leading to a continuation of the uptrend after a brief consolidation. Similarly, a matching low pattern indicates strong support, likely resulting in the continuation of the downtrend.
How to Identify Patterns in Stocks
It takes practice to read the hard right edge. Even with a lot of time and practice, we don’t know the future. The idea isn’t to be right all the time. The idea is to be right more times than you’re wrong and to let go when you’re wrong.
There’s a saying: Let the patterns come to you. I know this sounds like something a zen master might say, but it’s relevant and important.
You can’t know what a stock will do before it does it. But if you know your patterns, you can see them forming as they’re happening.
I like to use my tools. If you draw lines over and around key levels of support and resistance, they make the shapes clearer. Once you see the shape, you can begin to form a thesis.
One of the best ways to identify patterns is to draw lines on the charts. StocksToTrade comes with a complete toolkit that allows you to do just that! Try it now for 14 days for only $7!
How Do You Trade Continuation Patterns?
You’re looking for a trend. You want to see the stock moving in a clear direction.
Sometimes you see it and think you’re too late. If you’re a new trader, you might give up and move on. But if you’re familiar with continuation patterns, you don’t have that problem.
Watch for the patterns. Mark your key levels and follow the shape as it forms. Wait for your signal.
That’s going to be a breakout of resistance with volume. Volume is key. It can be easy to get faked out if you’re only looking for breakouts. We call them fake-out breakouts.
But if you see a price move accompanied by strong volume, it’s a good sign that buyers or sellers are moving in. It validates the move.
You don’t have to wonder why a stock’s trending, though! With StocksToTrade’s Breaking News Chat, you get the news that might move a stock before the stock even moves. Whether you’re catching the breakout or watching the trend, the Chat is your friend. Give it a shot — get STT with Breaking News Chat in a 14-day trial for just $17!
Continuation Chart Patterns: Practical Examples
Check out the two charts below … One uptrending and one downtrending. You can see continuation patterns form many times throughout the trend.
Let’s start with a bullish stock.
Net Savings Link Inc. (OTCPK: NSAV) — Bullish Trend
It’s not on the chart, but this stock gapped up and broke out.
It put in a high and held above the breakout level. That’s the green line on the bottom. After it creeps back up to the resistance level, it starts to look like a handgun.
The continuation signal is when it breaks past the original resistance. It’s especially important with OTCs to wait for that breakout to happen. Otherwise, you could be looking at a double top.
If you missed that breakout, no sweat. The longer the trend goes on, the lower your risk/reward. But you’ve still got that ascending triangle pattern later in the day.
Notice the low volume where it breaks resistance on the triangle. You’ll see it struggles to get going.
Compare that to the volume with the first signal — where it breaks out of the gun pattern. The volume verifies the move.
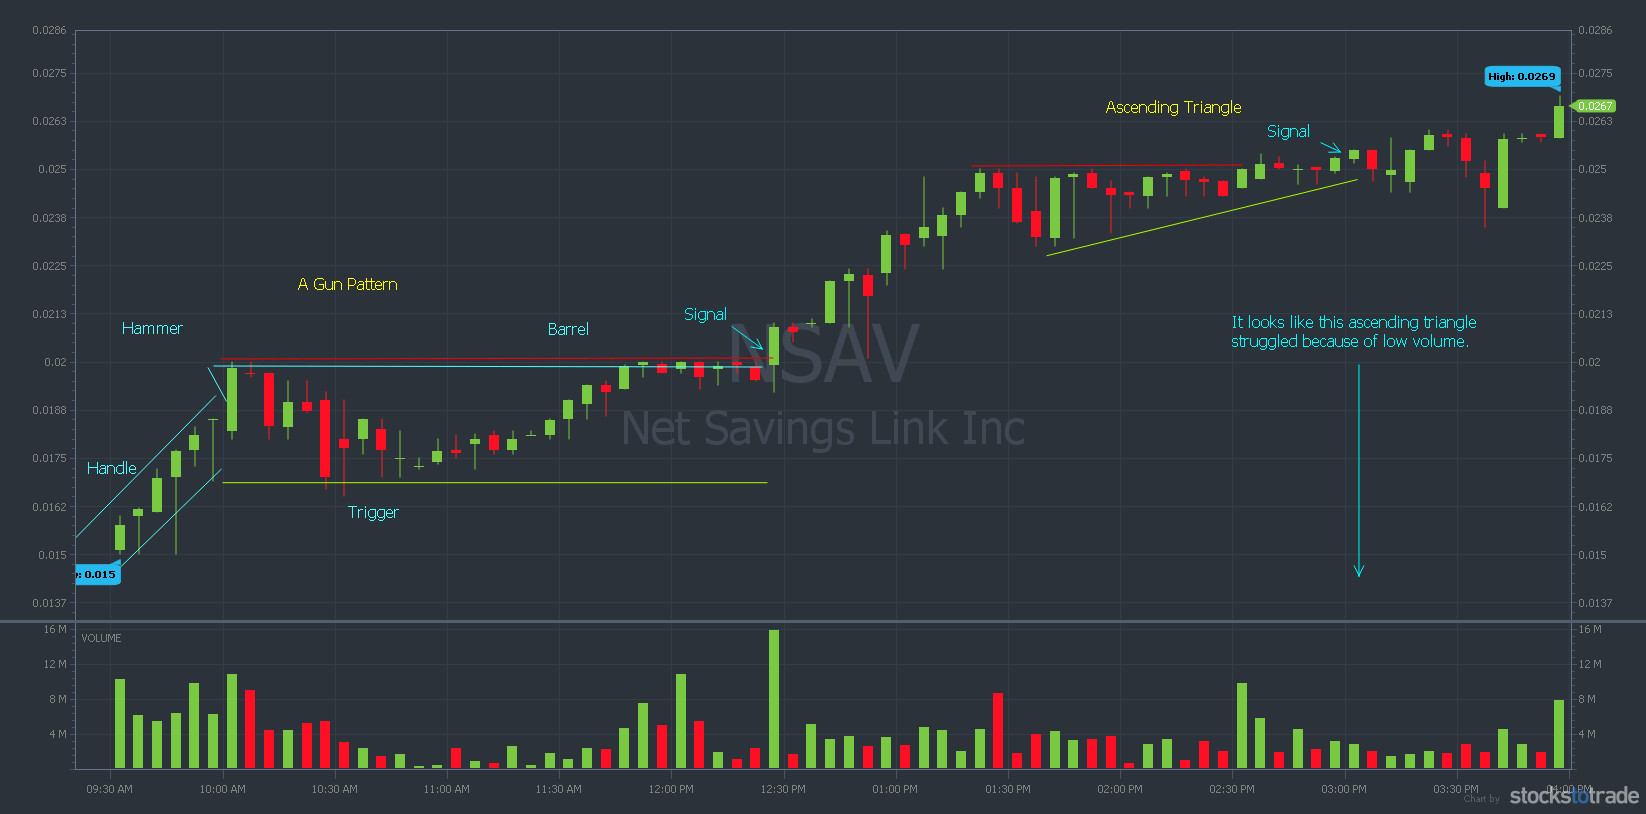
Net Savings Link, Inc. 1-day, 5-minute chart (Source: StocksToTrade)
Now here’s a bearish trend…
Greenland Technologies Holding Corporation (NASDAQ: GTEC) — Bearish Trend
GTEC ran during premarket when the company released some news. It’s tough to chase that kind of run. But look at that bull flag. It consolidates, breaks out, and keeps going.
If you tune in to my Pre-Market Prep — where I go live every morning to talk about the hottest stocks — you may remember I was watching this stock for a dip and rip, but I wound up with a double top. There’s a bonus pattern for you.
That reversal pattern set us up for an all-day downtrend. If you wanted to short the stock, there were plenty of opportunities to hop on the trend.
I’ve marked the obvious bear pennant, bear flag, and rectangle patterns. Can you spot any I missed? Can you spot the fake-out breakdown?
Notice that volume faded toward the end of the day. When it broke down from the rectangle, it was out of steam. It cracked but didn’t panic.
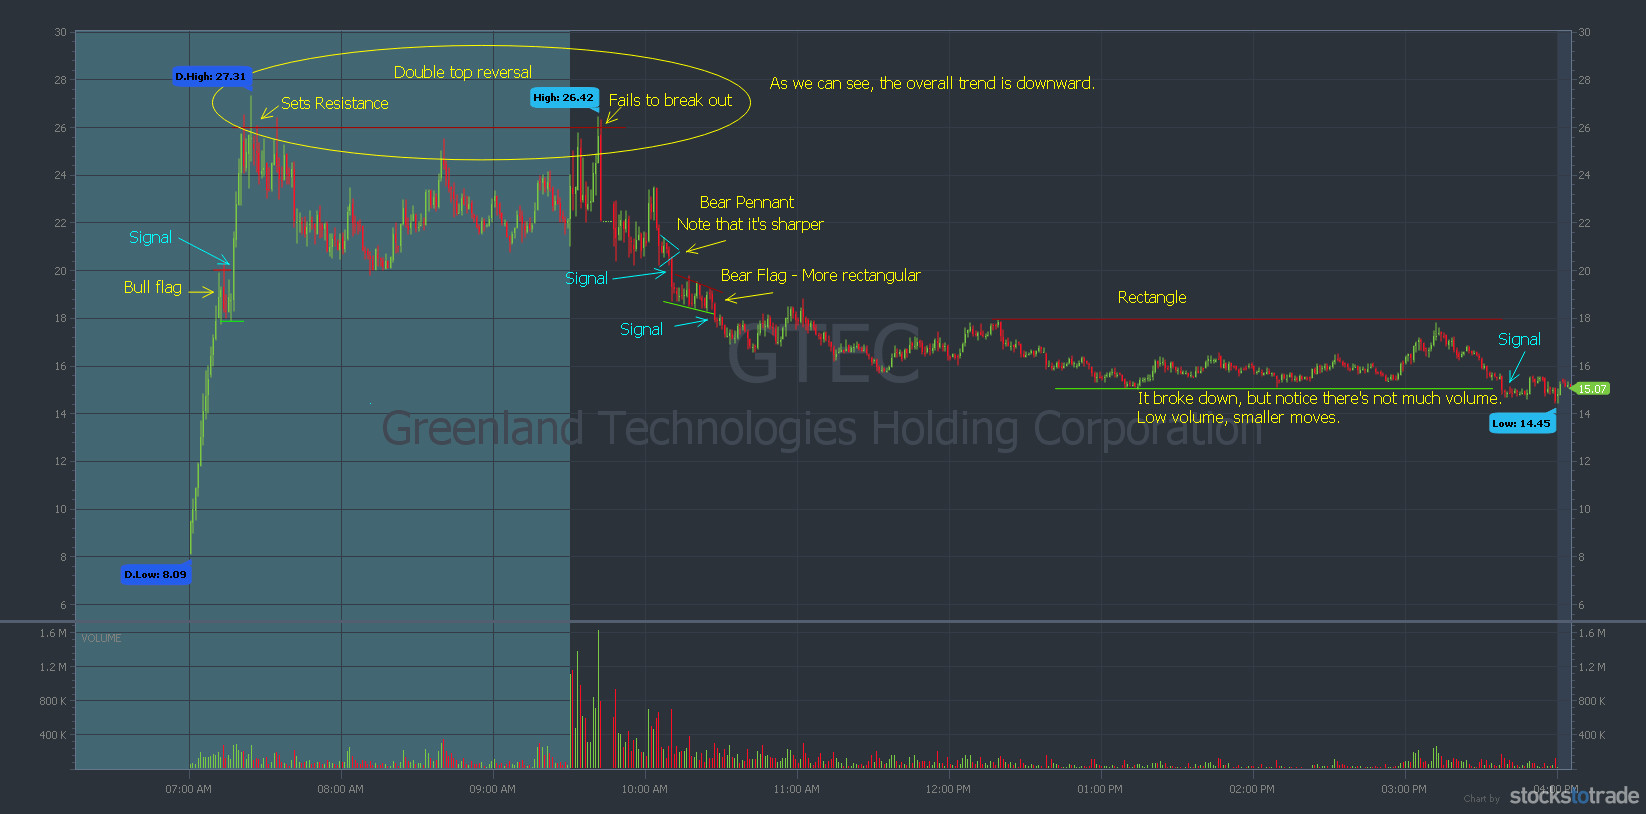
Greenland Technologies Holding Corp. 1-day, 1-minute chart (Source: StocksToTrade)
Conclusion
It can suck to miss a big move. But you don’t have to miss out altogether. Breakouts can lead to trends that have many many opportunities.
With the right mindset and an eye for patterns, you can spot safer ways to take trades. Sometimes even in the middle of a trend.
Triangles, pennants, flags, and rectangles are great continuation patterns. If you know these patterns and their signals, you can create plans with a clear risk/reward ratio.

We talk about all these patterns and more in the SteadyTrade Team. I run live webinars twice and sometimes three times a day. All those webinars are archived for you to watch whenever you want. If you’re looking for support and mentorship, join the SteadyTrade Team!
What was your biggest miss? How will knowing these continuation patterns help you? Let me know in the comments below!
Frequently Asked Questions
Is a flag a continuation pattern?
Yes, a flag is a continuation pattern. It forms after a strong price move and is characterized by a rectangular consolidation phase. The flagpole represents the initial move, and the breakout from the flag signals the continuation of the trend. Traders often use flags to identify entry points during an ongoing trend, leveraging the pattern’s reliability.
What is the most reliable continuation pattern?
The reliability of a continuation pattern depends on various factors, including market conditions and volume. However, flag patterns are generally considered among the most reliable. Their clear structure and predictable breakouts make them valuable tools for traders. Confirming the pattern with volume and other indicators enhances its reliability.
What is the difference between continuation and reversal?
Continuation patterns indicate that the current trend will persist after a brief consolidation, while reversal patterns suggest a change in the trend’s direction. Continuation patterns, such as flags and pennants, signal that the trend will continue. In contrast, reversal patterns, like head and shoulders or double tops/bottoms, indicate that the trend is likely to reverse, leading to a new direction in price movement.
How do candlestick patterns inform investment advice?
Candlestick patterns are crucial for informing investment advice because they reveal market sentiment and potential price movements. By understanding these patterns, traders can offer more accurate recommendations to their clients, ensuring better management of funds and resources. This expertise helps in identifying key areas where prices may pause or continue, aiding in strategic investment decisions.
Can candlestick patterns be used across different financial products?
Yes, candlestick patterns can be applied across a wide range of financial products, including stocks, commodities, and forex. These patterns are versatile and can help traders analyze a series of price movements regardless of the specific market. This universal applicability makes them valuable tools for clients seeking comprehensive investment advice and better insights into various markets.
What role do candlestick patterns play on trading sites and their services?
Candlestick patterns are prominently featured on trading sites, providing traders with visual tools to analyze price trends. These patterns, with their distinct body shapes and links to various market events, can be combined with other indicators like bar charts and line strikes to provide valuable information. The integration of candlestick patterns on these platforms enhances the overall trading experience, protecting investment rights and improving overall trading strategies.