
If you saw a descending triangle pattern on a trading chart, would you recognize it?
Recognizing chart patterns can help you manage risk and catch price movements. Once you know what to look for, the descending triangle can be an easy pattern to spot.
It also comes up a lot. A lot of traders on our SteadyTrade Team love this pattern.
Having great market conditions is key for any pattern. Often, that means high volume.
That’s an essential component in trading patterns. But I’m jumping ahead…
First, let’s get into the basics of the descending triangle and how to trade it.
Table of Contents
- 1 What Is a Descending Triangle Pattern?
- 2 What Does a Descending Triangle Pattern Mean?
- 3 How Does a Descending Triangle Pattern Form?
- 4 Traits of a Descending Triangle Pattern
- 5 What Is a Descending Triangle Pattern in Technical Analysis?
- 6 Examples of the Descending Triangle Pattern
- 7 How Do You Trade the Descending Triangle Pattern?
- 8 Descending Triangles vs. Ascending Triangles
- 9 Is a Descending Triangle Pattern Bullish or Bearish?
- 10 The Benefits and Disadvantages of Using a Descending Triangle
- 11 Conclusion
What Is a Descending Triangle Pattern?
A descending triangle is a technical pattern that indicates a bearish trend. It is also a versatile pattern — it can show continuation or a reversal.
The descending triangle can form during a downtrend or after a quick run-up in price.
You’ll then see a brief period of consolidation.
The two resulting trend lines form a triangle that points down on a chart. That can be a clear signal to traders…
Remember, if you recognize a pattern, other traders will too. Like visuals? Don’t worry. We’ll get to some soon.
What Does a Descending Triangle Pattern Mean?
Price action is ruled by supply and demand. That means the right catalyst or technical setup can lead to more demand for a stock.
A stock’s supply is its float. It’s how many shares are available to trade. You can read more about float here.
So the descending triangle shows that demand for a stock is dropping. You can see that in the selling off of the stock price.
Short sellers love to see this pattern as it can signal a potential to profit when the price drops.
How Does a Descending Triangle Pattern Form?
Charts — you gotta love ‘em. They show you market price trends in real time.
You’ll see price trends moving as a series of candles on charts. With the descending triangle, these candles create peaks of lower highs and lower lows.
As the price moves lower, we call that trending downward. This price trend will then slow before it starts to move sideways.
This can become a period of rest for buyers (longs) and short sellers (shorts). Longs think the price action will move higher after each bounce off support. And because of the stock’s downward trend, shorts think longs are losing momentum.
Longs are also less concerned with the lower highs that form as long as support holds. With each test of support, shorts think that support will finally break.
Traits of a Descending Triangle Pattern
I always say you gotta read the charts until your eyes bleed. It gets easier to spot these patterns with practice and experience.
StocksToTrade’s top-of-the-line stock screener can help you spot this pattern. And its real-time paper trading feature can help you practice with simulated trades. Try it for 14 days for only $7.
That said, here are a few traits to watch for…
Forms During Any Trend
The first thing you should do is look for price direction. Is price action going down or pulling back from a spike? If so, how many red candles have there been?
Any more than three red candles of price going down, and I’d say you have a bearish trend forming.
The descending triangle is most powerful when traded in the context of the trend. Remember, the trend is your friend. Notice how a stock is trending and don’t fight it!
Angled Topping Trendline
As the stock trends downward, price action will hit a level where it can’t break below any further below.
It’s like a line in the sand … Price action changes direction and moves back up.
Then it hits a peak and begins to pull back from that level. That’s a point of resistance — the price can’t go higher.
With luck, price action will return to where it first bounced. You want to see it move back up, but not higher than the last point of resistance…
This creates a lower high. Then you can draw an angled trendline across the tops of those lower highs.
Horizontal Support Trendline
I already mentioned that in this pattern, after a downtrend, the price finds a bottom level and moves back up.
Once price action touches that bottom level at least two times or more, it signals a support area. Now you can place a flat horizontal trendline along that bottom level.
Falling Volume
Volume is king. So be sure to watch for the story that volume tells you.
Falling volume can indicate that longs are taking profits. That can lead to failed breakouts to the upside.
A volume drop can also mean that shorts are waiting to see what longs will do. Shorts may even start to accumulate shares at each failed breakout.
What Is a Descending Triangle Pattern in Technical Analysis?
Patterns develop because of traders’ mindset and emotional states. Like all triangle patterns, the descending triangle is a pattern of consolidation.
During this consolidation period, traders are pretty indecisive. You can learn to navigate this indecision by using technical analysis.
As traders, we use technical analysis to help us identify trading opportunities.
Shorts could take a position at each failed breakout for the ride back to support. They’d set a stop loss at the price above resistance. Longs could buy at support for the run-up and break of resistance. They might place their stops right under support.
This is why it’s key to understand pattern psychology. That’s the more predictable part of any trading pattern.
Examples of the Descending Triangle Pattern
All patterns, including the descending triangle, can happen in many different time frames. Let’s look at some examples.
Houston American Energy Corporation. (NASDAQ: HUSA)
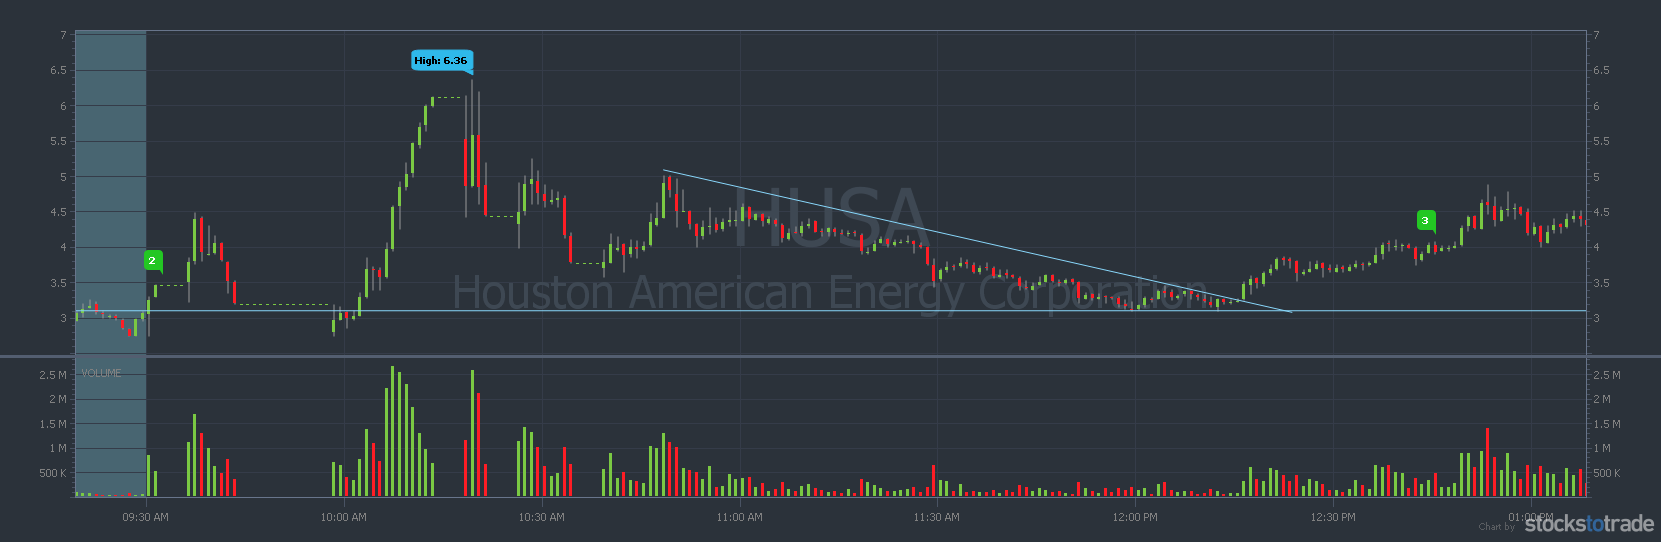
HUSA: 5-minute chart, descending triangle, September 29, 2020 (source: StocksToTrade)
After the first hour and a half of the market open, HUSA formed a descending triangle. The pattern forms with a series of lower highs that come to a point at the $3 support level.
The Peck Company Holdings, Inc. (NASDAQ: PECK)
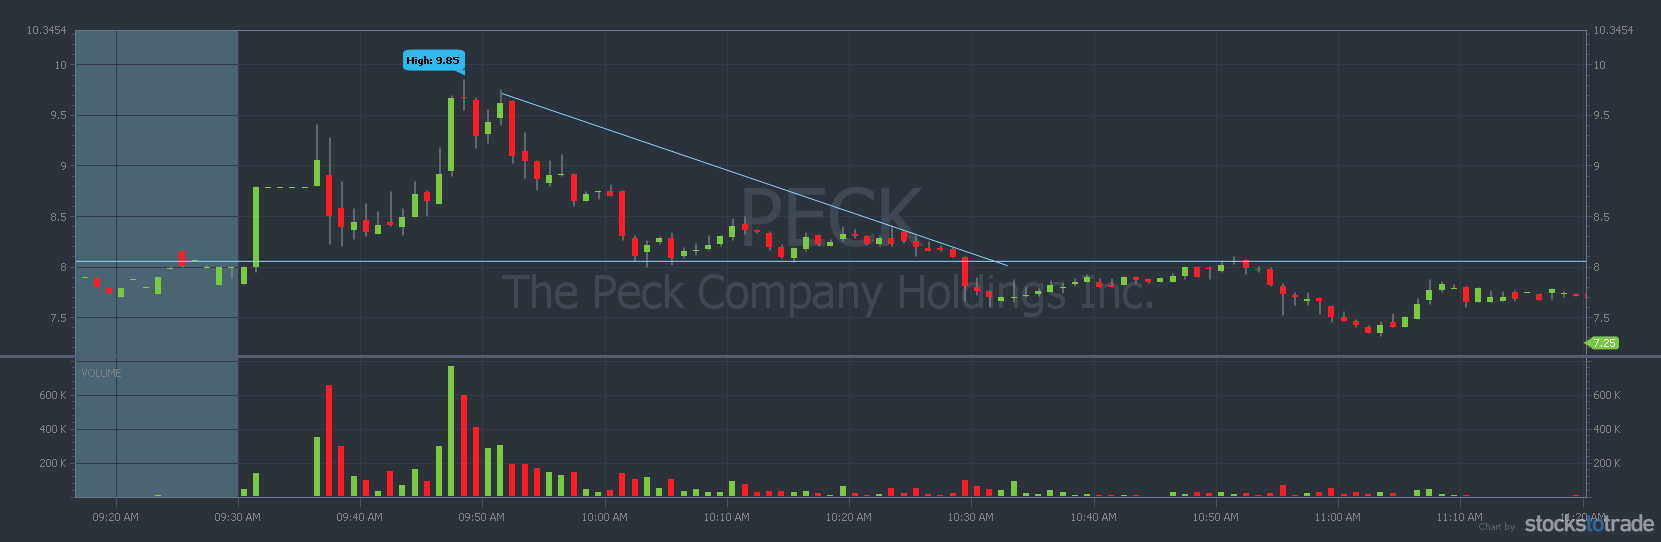
PECK: 1-minute chart, descending triangle, September 30, 2020 (source: StocksToTrade)
From a curl at 9:45 a.m. Eastern, PECK formed a descending triangle from the market open to 10:30 a.m. Peck cracked support around $8, then continued lower.
Aptorum Group Limited (NASDAQ: APM)
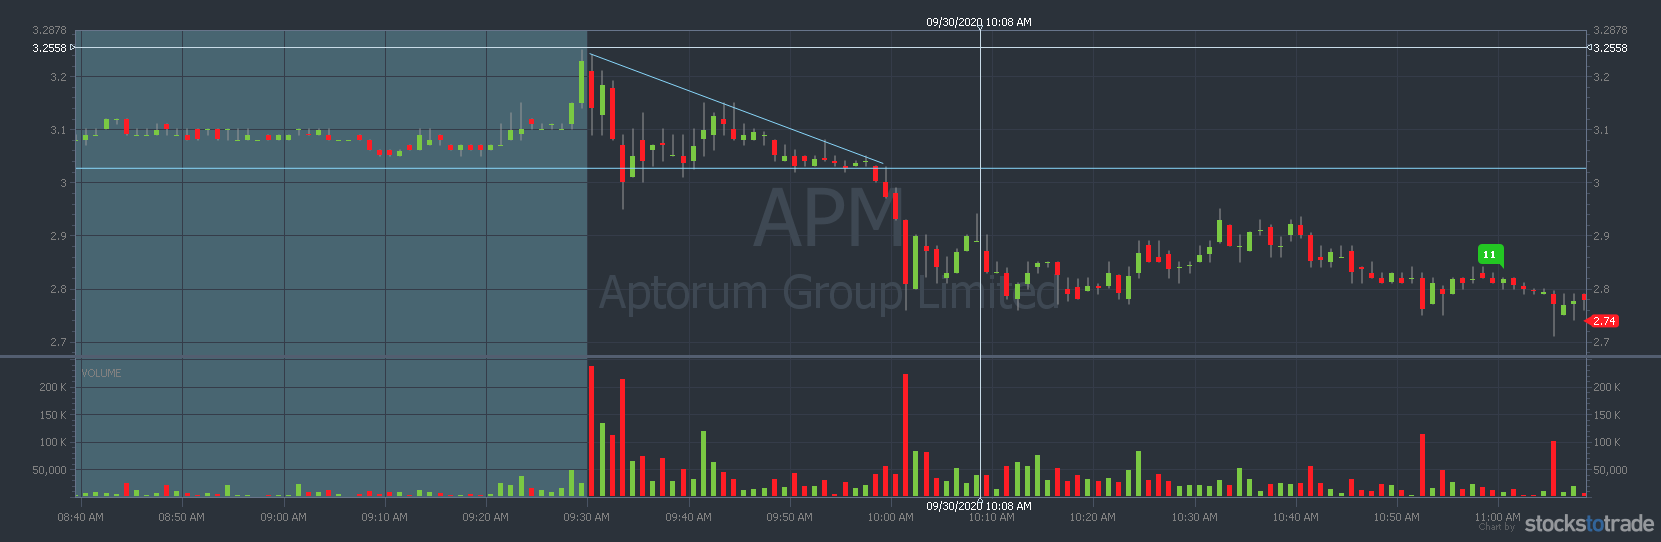
APM: 1-minute chart, descending triangle, September 30, 2020 breakdown (source: StocksToTrade)
In this example, APM formed a descending triangle from the market open. APM broke support and continued downward until consolidating from 10 a.m. Eastern through the rest of the day.
Eastman Kodak Company Common New (NYSE: KODK)
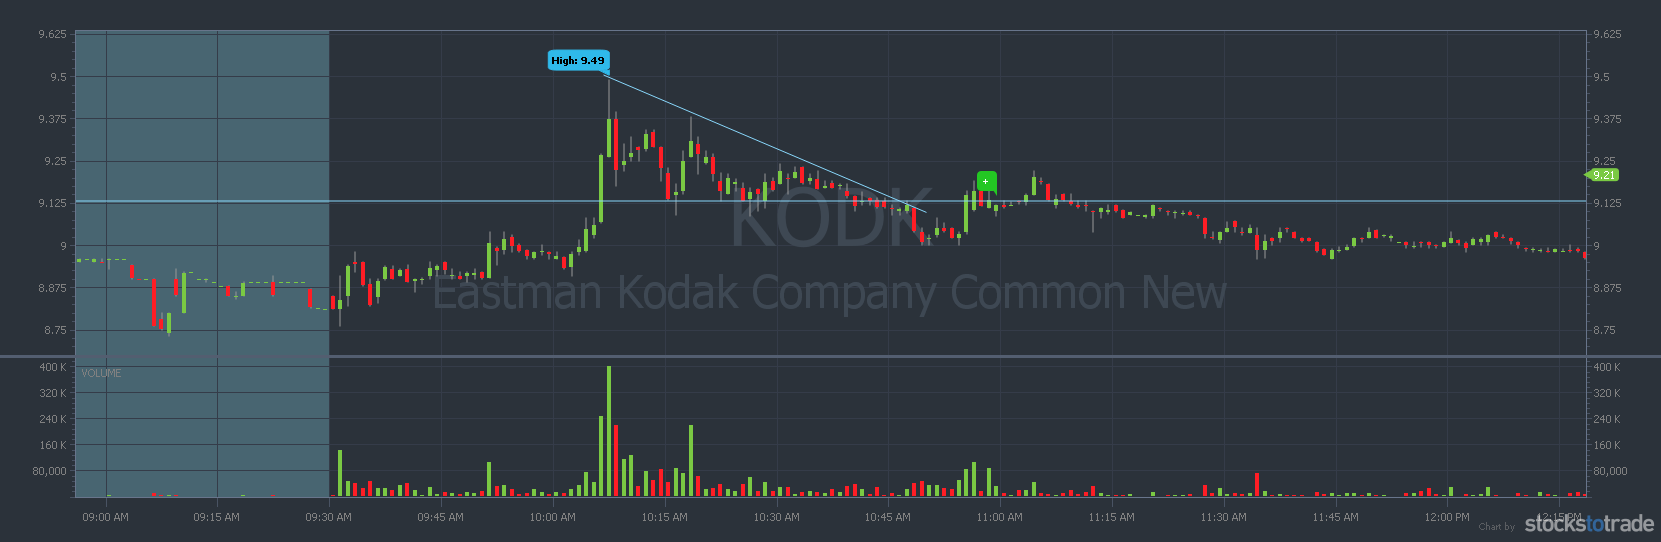
KODK: 1-minute chart, descending triangle, September 30, 2020 (source: StocksToTrade)
KODK formed a descending triangle around 10 a.m. Eastern. The $9 level held up as support, and it formed the lower highs of the pattern around 10:45 a.m.
How Do You Trade the Descending Triangle Pattern?
Patterns help traders predict possible movements in price. Here are some tips to help you recognize the descending triangle pattern.
Identify the Descending Triangle
First, you get a big push downward, almost resembling a bear flag set up. This can happen on an already downtrending stock or after a recent big spike.
Second, the price will find a level where it can’t push lower. So it bounces back up. Look for volume to decrease on the run-up as it hits a point of resistance and begins to fade back.
You want to see the price to come back to where it bounced before. That gives you another point to draw a horizontal line across support.
Finally, if the price rises back up, you shouldn’t see it to go any higher than the last high. If this happens, you can draw an angled trendline along those lower highs.
Breakout of Support
With each retest of support, shorts want the bottom to weaken. They hope that longs lose interest and stop buying.
Then shorts can push price through the support line.
Think of it as a frozen pond. What can happen if you walk out on the ice and start jumping on it? Each time you land, the ice can crack. With each crack, the ice gets a little weaker. Until…
The ice breaks and you plunge into freezing cold water.
The same thing can happen if support is weak. If you jump enough, it can crack and send the price on a breakout to the downside.
Shorts will look to get in on the breakout downward. And longs should have their stops under support.
Descending Triangle Reversal
The descending triangle is a great bearish pattern. It means shorts are in control. You may see low selling volume on the chart.
So longs may see an opportunity to buy up shares. And they’ll want to make sure support holds. If it does, they may get aggressive, and shorts will start to buy to cover.
All this can fuel an explosion in buying volume. If the reversal is strong enough, it leads to a break of resistance.

Proper Position Sizing
In trading any pattern, you want to use a good position size and follow your trading plan.
I’ve seen many people blow up their trading accounts. All because they didn’t follow their plan and used too much size. You don’t have to go all in on trades. In fact, it’s smart to start small.
It’s good to start with a smaller starter position. Get a feel for how the pattern works for you.
No pattern works every time, so you have to manage your risk. You can do that by setting a stop loss on every trade you take.
And if the trade doesn’t work, get the heck out of it!
Descending Triangles vs. Ascending Triangles
Descending triangles and ascending triangles are opposites.
Descending triangles point downward. This is a strong bearish pattern. The stock price is dropping.
The opposite is true for an ascending triangle. It’s a triangle pointing up on the chart. This is a strong bullish pattern. With this pattern, the stock price could break out.
How you play these patterns depends on your strategy.
Is a Descending Triangle Pattern Bullish or Bearish?
A descending triangle has more bearish traits. But it can be also bullish. That’s known as a reversal pattern. Like the bull flag pattern.
You can’t use a scanner to search for patterns. So you need to look at the top percent gainers and learn how to recognize when the pattern is playing out on the chart. I use StocksToTrade for top percentage gainers.
StocksToTrade has 40+ built-in scans, and you can customize your own scans too. Plus, I think we have the best charts around. Add in our news feeds, social media feeds, indicators, and so much more … There’s a lot to love about this platform. Try it for yourself! A 14-day trial is just $7.
The Benefits and Disadvantages of Using a Descending Triangle
What’s great about the descending triangle is it can be a great pattern for both short sellers and longs.
It can also give traders a little time to rest as they watch how the price action will play out.
Here’s a big downside of the descending triangle … Shorts could get caught in a short squeeze if there’s a reversal. I think shorting is a risky strategy anyway.
And if you’re long, you could get caught in a strong flush to the downside if a reversal can’t sustain.
Conclusion
The descending triangle is a good pattern to know. It’s versatile and can offer many trading opportunities.
It can also help you find risk/reward that suits your trading style. But remember, you gotta keep your emotions in check and follow your trading plan.
Trading is risky and takes a lot of hard work. You must study a lot to learn the patterns that can work for you. There’s no easy button, and no one can tell you which patterns will for you.

You have to find that through lots of practice. You don’t have to go it alone. Our SteadyTrade Team mentorship program is designed to help you find your trading groove. It’s hard in the markets! So learn in a community of traders who can help support you in your journey. Join us!
You need a trading platform to trade patterns like the descending triangle. Check out StocksToTrade. It’s loaded with features to help you spot awesome trading opportunities.
You can try it out for 14 days — it’s only $7.
What do you think about the descending triangle pattern? How would you trade it? Leave a comment below and let me know!