
How well do you understand candlestick patterns and why they matter in trading? There are tons of stock charts that traders can use in their stock research…
If you’re a brand-new trader, you’ll probably start by looking at the simplest — line and bar charts.
But once you start to gain a better understanding of the market, you’ll want to take a look at one of the most important tools available for stock chart analysis: candlestick chart patterns.
At first glance, candlestick patterns may look complex. But they’re actually pretty easy to read. And they can offer much more valuable information than line or bar charts.
Ready to learn more? In this post, you’ll get a basic education on candlestick patterns, including basic candlestick anatomy. I’ll also cover fundamental patterns and how to read and use the information you find.
Table of Contents
20 Candlestick Chart Patterns You Must Know
Believe it or not, it’s likely that the candlestick pattern was initially developed in the 18th century … by a Japanese rice merchant.
Munehisa Homma was a rice trader in Osaka — and apparently an enterprising fellow. According to some accounts, he got ahead in the rice market by establishing a network of employees located at regular geographic intervals.
Through this long chain of people, he could quickly receive word about the most up-to-date market prices, and he used this information to get an edge in the market.
Homma’s also said to be the father of the candlestick pattern, although the information about exactly how he developed it is kinda sketchy.
Regardless of whether he’s the inventor of candlestick charts, the concept took off. The candlestick pattern was adopted by others. And it later spread more widely via Steve Nison, who wrote the book “Japanese Candlestick Charting Techniques.”
So what’s the fuss? A candlestick pattern can give you a lot of information about a stock in an easily deciphered visual form. Many traders consider these patterns a great tool for technical analysis.
 But what exactly is a candlestick pattern and how can you use it? Here’s what you need to know…
[As an Amazon Associate, we earn from qualifying purchases.]
What Is a Candlestick Pattern?
To understand a candlestick pattern, let’s start with the candlesticks themselves.
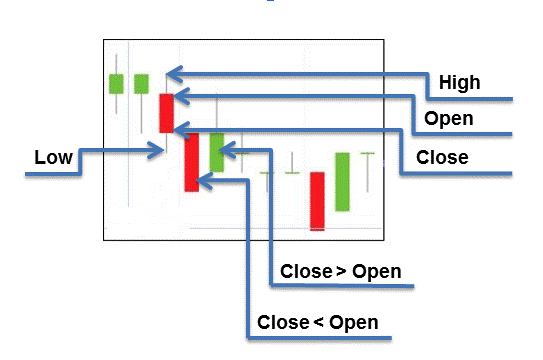
Each candle shows a stock’s open, close, high, and low prices within a specific time frame.
When you put a bunch of candlesticks together, it tells a story. And if read correctly, these patterns can be powerful tools that help skilled traders lower risks, confirm trends, and make informed trade decisions.
How to Read a Candlestick Chart
The first time you look at a candlestick chart, it might seem incredibly complicated. The good news is that candlesticks really aren’t so complex. Let’s review the anatomy…
Candlesticks have two key parts: the body and the shadow.
The candlestick body looks like a pillar candle, and the shadow looks like the candle’s wick. The shadow can extend in either direction of the body, top or bottom — and sometimes even both ends. Insert ‘burning the candle at both ends’ pun here.)
© 2020 StocksToTrade.com
The candle’s body can tell you a few main things within the time period you set:
- Opening price
- Closing price
- Which direction the share price went — up or down
In StocksToTrade, a green candlestick tells you that the stock’s closing price was higher than its opening price. On the other hand, red candles indicate that the closing price was lower than the opening price. At the bottom of the candlestick’s body, you’ll find either the opening or the closing price.
With a green candlestick, you’ll see the opening price at the bottom and the closing price at the top. With a red candlestick, you’ll see the opening price at the top and the closing price at the bottom.
What about those shadows? Within the time period you set, they can show you the high and the low.
The top shadow represents the period’s high, regardless of the candle’s bullish or bearish status. The bottom shadow indicates the period’s low.
Types of Candlestick Patterns
Now that you have an idea of how to decipher a candlestick chart, let’s discuss some of the different patterns you can look for.
Bullish Candlestick Patterns
Bullish candlestick patterns feature a closing price that’s higher than the opening price and will show an upward trend.
If the trend is moving upward within the time period you set for the chart, it’ll display in green on StocksToTrade.
Here are a few examples of popular bullish candlestick patterns…
The Hammer
This is a bullish candlestick pattern that shows that buying pressure has quickly overcome a temporary sell-off, aka bullish price behavior.
In this pattern, the candle’s body is short with a long lower shadow. This can be a sign that sellers are driving the prices down during the trading day, but that buyers are coming in to push the trading-day close higher.
But it’s important to be able to confirm that the trend is turning upward — keep a watchful eye and remember to check the trading volume.
Inverted Hammer
The inverted hammer candle is basically an upside-down hammer candle. It has a small body with a long shadow (that’s at least twice the size of the body) above.
The inverted hammer candlestick can be an indicator of a possible reversal at the bottom of a downtrend.
The long upper shadow shows that buyers tried to bid the price higher. But sellers caught on to the buyers and attempted to push the price back down.
The closing of the candle body shows that buyers managed to close the session near the open. Since the sellers weren’t able to close the price lower, this may be an indication that there are no sellers left and the buyers have an opening to take control.
The Morning Star
Like the first rays of light in the morning, the morning star can be like a beacon of hope for the new day ahead…
This pattern features three candles:
- The first is a long red candle.
- The middle has a short body and can be either red or green.
- The third has a short green body.
This type of candle shows that prior selling pressure could be waning. The final candle can show that there’s a renewed trend of buying — potentially setting off a bullish reversal. Always confirm this with volume.
Bullish Three Line Strike
The bullish three line strike is a rare candlestick pattern. It forms during an uptrend and indicates that a continued uptrend is likely.
Despite the name, this pattern actually contains four candles. The first three are called “strikes.”
It contains an initial trio of bullish (green) candles each closing higher than the previous one. That shows that an uptrend is in progress.
This is then followed by a fourth bearish (red) candle. It opens higher than the third but then drops down, closing below the opening of the first candle. The body of this last candle should contain the real bodies (not counting shadows) of the previous candles within its length.
The first three candles show that the bulls are in control and that price is progressing steadily. The sudden reversal of the fourth candle greatly reduces the risk of an actual trend reversal. It’s so swift, the uptrend is expected to resume.
Remember, patterns can break and not always work. Wait for confirmation before entering a trade.
Bullish Abandoned Baby
The bullish abandoned baby is a three-candle reversal pattern. It’s unique and rare — but can be reliable.
The first candle is bearish (red) moving with a downward trend. The second candle is a doji that gaps downward, with no overlap with the body or shadow of the first candle. The third candle is bullish (green) gapping in the opposite direction.
This formation shows a rapid shift of price momentum in the bulls’ favor, catching the bears off guard. The rally off the abandoned baby bottom forces short sellers to cover fast. It often results in a sharp short squeeze.
Bullish Engulfing
This is a dual candle reversal pattern. And it’s one of the most bullish patterns in candlestick trading.
Why do we call it an engulfing candle? Because the candle on the left gets completely engulfed by the new candle on the right side.
The first candle is bearish (red), continuing a downward trend. The second candle is bullish (green) and reversing the trend by completely overtaking the first candle. It creates a lower low and a higher high.
This pattern shows that the aggressive selling pressure has changed. The bulls have completely overwhelmed what the bears did previously.
The Piercing Line
The piercing line is a dual candle bullish reversal pattern that has moderate reliability. It forms during a downtrend, possibly at a support level.
The first candle is bearish (red) and the continuation of a downtrend move. The second candle is bullish (green). It opens lower than the close of the first candle and closes above the halfway mark of the bearish candle.
This pattern indicates that the bears are losing control — the bears are taking over.
It’s important to wait for confirmation that the reversal actually takes place.
The Three White Soldiers
This is a triple candle pattern and it’s formed when three long bullish candles follow a downtrend, signaling a reversal.
The first candle is bullish (green) and follows a bearish trend.
The second candle is also bullish. It must be bigger than the first candle’s body and close near its high … That means there’s little to no shadow at the top.
The last candle should be at least the same size as the second with no to little shadow at the top.
The three white soldiers pattern is considered one of the most powerful bullish signals, especially if the previous downtrend was overextended.
Bearish Candlestick Patterns
Bearish candlestick patterns feature a closing price that’s lower than the opening price and will show a downward trend.
If the trend’s moving upward within the time period you set for the chart, it will display in red on StocksToTrade.
(See how powerful the StocksToTrade platform can be … Get your 14-day trial for just $7 today!)
Bearish Engulfing Pattern
This pattern sometimes occurs at the peak of an upward trend or when a correction occurs during a downtrend.
This pattern is characterized by two candles. The first has a long body, little shadows, and a higher close.
The second candle totally covers the body of the first candle, engulfing its entire range. It pretty much shows a total reversal in the momentum, with the second candle reversing the prior gains. That’s what makes it bearish.
Evening Star Pattern
The evening star is the yin to the morning star pattern’s yang. It’s another three-candlestick formation, featuring a first candle with a close that approaches the high.
The second candle extends above the first with a small body. And the third slips down below the second candle, closing beyond the middle of the first candle’s body.
This pattern is visually striking — the second candle is above the other candles, showing that the upward momentum may have played itself out.
Two Black Gapping
The two black gapping formation is bearish and signals a continuation to a downtrend.
The first candle is bearish (red) and gaps below the prior one. The second candle continues the bearish move by providing a lower high.
Three Black Crows
The three black crows pattern is the reverse of the three white soldiers pattern. It’s also a powerful reversal signal, especially when the prior bullish trend is overextended.
As the name suggests, it consists of three candles. The first is a bearish reversal candle. It either ends the uptrend or implies that the period of consolidation that followed the uptrend is over.
The second candle is bearish. It should close near its high, leaving a small or non-existent lower shadow. The third candle, also bearish, should at least be the same size as the second. It should have a small or non-existent shadow.
Although this pattern can be a powerful reversal of an uptrend, it’s gotta have volume behind it to work well.
Hanging Man
The hanging man is a bearish reversal candlestick. It can mark the top of a move.
It’s basically a hammer-shaped candle positioned at the higher end of a trading range. It has a short real body with a long shadow. The lower shadow must be two or three times the size of the body and there should be little or no upper shadow.
When the price is rising, the formation of a hanging man indicates that the bears are starting to outnumber the bulls … The price momentum may start heading down.
Shooting Star
A shooting star is a bearish reversal candle positioned at the top of an uptrend. It has a petite body with a long upper shadow and small or nonexistent lower shadow.
Its shape is nearly identical to an inverted hammer … But because of its position on the chart, the inverted hammer is a bullish reversal candle.
A shooting star indicates that the price opened at its low, rallied, but pulled back to the bottom. The bulls attempted to push the price up, but the bears came in and overpowered them. Now there are no more buyers left.
Dark Cloud Cover
The dark cloud cover is a bearish two-candle pattern that appears in an uptrend signaling a reversal.
The first candle is bullish with a large body. The second candle is bearish and opens above the high of the previous candle.
It’s important for the second candle to drop and close well into the body length of the first … at least 50%. And the pattern is more reliable if none of the candles have shadows.
The dark cloud cover indicates a shift in momentum. But as always, traders must wait for confirmation to see if the price decline continues.
Other Types of Candlestick Patterns
Another term you’ll encounter a lot when you start studying candlestick patterns is the doji. What’s that?
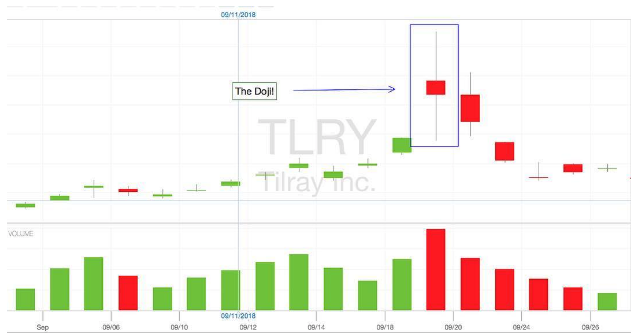
The Doji
© 2020 StocksToTrade.com
The doji is a particular candlestick-pattern phenomenon. This candlestick shows an open and close that are pretty much equal.
A doji candle kinda looks like an elongated plus sign or cross. Depending on where it crosses, it might be called a gravestone, long-legged, or a dragonfly. By itself, this candle type is neutral, but it can figure into a variety of other patterns.
Often, the doji can be a signal of a reversal in technical candlestick patterns, which can show indecision. With a lack of clear conviction, this could be a sign that the trend’s about to change. But that’s not always the case.
The doji could also represent a moment when either buyers or sellers are temporarily at a standstill before a trend continues. In this way, it shows the market could be consolidating in preparation for its next move higher.
Spinning Top
A spinning top candle has long upper and lower shadows that significantly exceed the length of the body.
These candles indicate indecisiveness and show possible resistance to a continuation of previous candles on the run. The fight between the bulls and the bears have reached a standstill. Buyers and sellers struggle to decide whether to continue the price direction.
Marubozu
Marubozu candles have no shadows coming from their bodies.
It’s a solid red or green candle that signifies a very aggressive move toward the direction in which it’s heading. It shows that there’s no doubt as to who won the struggle during that time frame, whether that’s buyers or sellers.
Marubozu candles are usually the first part of an aggressive continuation or reversal candlestick pattern.
Falling Three Methods
The falling three methods is a bearish continuation pattern.
It consists of five candles in total — two long in length and three short.
The first candle is long and bearish. The next three are bullish and short in length … The three short candles can’t reach above or below the first candle’s body. The final candle is long and bearish. It must close below the first candle’s body.
The pattern starts out showing that the bears are overwhelming the bulls. Starting with the second candle, the price pauses and tries to move up. But the bulls can’t push the price above the height of the first candle.
The final candle shows how the bears overtake the move and drive the price back to the downward trend.
Rising Three Methods
The rising three methods pattern is similar to the falling three methods. The difference is it appears in an upward trend and indicates its continuation.
The first candlestick is bullish with a long body. It’s followed by a few smaller bearish candles that don’t exceed the length of the first candle. Finally, the pattern is complete when a large bullish candle opens higher than the close of the final short candle and closes above the high point of the first.
In this pattern, the bulls are dominating the bears. But then the pricing pauses and the bears try to take control … only to lose to the bulls. This causes the momentum to shift back to the previous upward trend.
 What to Look for Before Trading
That wraps up your basic training on candlestick charts and candlestick patterns. So how can you start to use them? Here are some things to keep in mind…
- Don’t trade based on candlesticks alone. Candlesticks can tell you a lot about a stock’s momentum, but they should only be one part of your stock research. Be sure to back up your chart research with fundamental research and checking indicators too.
- Shadows are significant. If there’s a long shadow, it can be an indication that there’s resistance to either buying or selling pressure … And one always comes out ahead.
- The time frame matters. Don’t make the mistake of thinking that you’re seeing something you’re not. A one-year chart is different from an intraday chart, for example.
- Don’t forget the doji. The doji can show the balance between buyers and sellers and can give you an indication of a reversal — so learn about the doji and its variations!
The StocksToTrade Candlestick Pattern Conclusion
Candlestick patterns contain a ton of information that can help traders create strong, calculated trading plans. To make them work for you, you need knowledge … and powerful trading tools.
StocksToTrade was designed for traders by traders with the goal of helping every trader perform more-detailed, accurate research that’s essential for creating strong watchlists and trading plans.
Here are just a few perks of the platform:
- You can scan thousands of stocks from all the major U.S. exchanges.
- Amazing charting software can help you track price action and find patterns in the stocks you follow.
- A paper trading module can help you learn the market, try out trading, and test new strategies before you put real money on the line.
- News integration can help you track things like SEC filings, company news, and social media buzz — all right from the platform.
- Broker integration allows you to trade right from the platform — no switching back and forth between different apps, screens, or programs.
See how STT can help you on your trading journey every day. Get your 14-day trial of StocksToTrade for just $7 today!
Traders: How do you use candlestick patterns to inform your trades? Newbies: Are you ready to use candlesticks in your market research? Leave a comment and let us know your experience!