
Penny stocks move fast … and a penny stock screener can help you catch those wild moves!
It can help you spot your favorite chart patterns as they develop.
If you’re like most traders, you want to find the best trades as quickly as possible — before the chat rooms jump in!
Scanning for stocks the old-fashioned way is time-consuming … It’s a sure way to miss out on awesome trades. A stock screener makes life so much easier — especially when you’re trading penny stocks.
Don’t know how to use one or which one to use? This post will help you get started.
Table of Contents
- 1 What Is a Penny Stock Screener?
- 2 Why Use a Penny Stock Screener?
- 3 How to Use a Penny Stock Screener
- 4 How to Trade Penny Stocks
- 5 Ways to Trade Penny Stocks
- 6 How Do You Find Potential Penny Stocks?
- 7 How to Trade Using a Penny Stock Screener in 9 Steps
- 7.1 #1 Follow Chart Patterns
- 7.2 Examples of Key Chart Patterns
- 7.3 Breakout Pattern
- 7.4 Breakout and Retest
- 7.5 Only Trade Patterns You Master
- 7.6 #2 Follow Technical Indicators
- 7.7 Examples of Technical Indicators
- 7.8 Moving Averages
- 7.9 MACD Indicator
- 7.10 #3 Trade Stocks With High Volume
- 7.11 Examples of High-Volume Stocks
- 7.12 Bionano Genomics Inc. (NASDAQ: BNGO)
- 7.13 GEVO Inc. (NASDAQ: GEVO)
- 7.14 #4 Trade Based on News Catalysts
- 7.15 #5 Don’t Trust Stock Promoters
- 7.16 #6 Cut Your Losses Quickly With Stop Losses
- 7.17 #7 Keep a Trading Journal and a Stock Watchlist
- 7.18 A Trading Journal
- 7.19 Stock Watchlists
- 7.20 #8 Don’t Trade Too Big
- 7.21 #9 Use a Top Penny Stock Screener
- 7.22 Take Advantage of All the StocksToTrade Features
- 8 What Should I Look For in a Penny Stock Screener?
- 9 Can You Become Rich From Penny Stocks?
- 10 What Is the Best Penny Stock Screener?
- 11 Conclusion
What Is a Penny Stock Screener?
A stock screener just what it sounds like…
It’s a tool that allows traders to filter stocks based on specific criteria. A penny stock screener does the same thing with a focus on penny stocks.
You can filter for almost anything — price, biggest percent gainers, volume, sector, market cap … A screener can filter thousands of stocks in seconds.
What Are Penny Stocks?
Penny stocks are small companies. These are generally stocks with market caps of under $1 billion that trade for under $5 per share.
They might be new businesses in an up-and-coming sector, or they might be established companies in danger of going bankrupt.
Trading penny stocks is a lot different from trading large-cap companies. It requires a different mindset and a different trading strategy. And it’s just one of the things we focus on in the SteadyTrade Team. Join us to round out your trading and market know-how.
Why Use a Penny Stock Screener?
If you trade penny stocks, you need a penny stock screener. That’s what will help you narrow your focus and quickly find the stocks that best fit your account size and trading plan.
Penny stock screeners don’t eliminate the need for research. But they can be a big help when you create a watchlist. Need help building your watchlists? Learn from my process every week — sign up for my no-cost weekly watchlist here!
How to Use a Penny Stock Screener
Using a penny stock screener isn’t complicated, but it can take some time to set it just how you want it.
A good trading platform will have a built-in stock screener. Our StocksToTrade platform comes loaded with 40+ scanners. And of course, you can customize your scans.
To scan for stocks, you enter your criteria. That might be trading volume, biggest percent gainers, price, or market cap. Then you click ‘Search.” That’s it. You’ll get a list of stocks.
From there, it’s up to you to do more research and narrow the list of potential trade ideas.
How to Trade Penny Stocks
To trade penny stocks, you technically only need a few things — a stable internet connection, a solid computer or laptop, and a funded brokerage account.
Then, when you’re ready, you place a trade, right?
Wrong! There’s so much more to it. Smart traders add more — an education and top-notch tools like a penny stock screener — to the process.
Here are the bare bones:
- A brokerage account. You need money to make trades and a way to place trades. Find the right broker for your needs.
- A good trading platform. Your trading platform should give you access to charting, news feeds, and analysis. Think of it as the command center for your trading operation.
- A penny stock screener. Over 18,000 stocks trade in the U.S. every day. That’s too many for one trader to watch. A penny stock screener that can help you find the stocks that fit your trading criteria.
- A strategy. This ties into your education. Random trades are rarely winners. Hoping to make good trades isn’t a strategy! Smart traders are thoughtful about every move they make. Find a strategy that works for you and backtest it. Then try to master it.
Ways to Trade Penny Stocks
There’s a wide variety of techniques, strategies, and styles for trading penny stocks. Let’s look at three ways to trade:
- Day trading. Opening a trade and exiting it before the market closes is called day trading. It’s fast-paced and can be exciting, but you have to be prepared for the onslaught of price movement, news, and action.
- Swing trading. This is where you hold a position anywhere from a day to a few weeks. You’re seeking profits on bigger moves than you normally see in a single session. While swing trading isn’t as hectic as day trading, it’s close. A swing trader needs a well-researched strategy and a robust trading platform.
- Position trading. Want longer-term trades — weeks, months, or longer? That’s position trading, and it allows you to hold out for major moves. You won’t need to watch the market action as closely as you would with day trades or swing trades. But you do need a good trading strategy so that when opportunities pop up, you’re ready to jump in.
Stock Market Hours
Most stock trading in the U.S. takes place on two exchanges: the Nasdaq and the New York Stock Exchange (NYSE).
But you’ll find the majority of penny stocks trading as pink sheet securities on over-the-counter (OTC) markets.
OTC markets and most major exchanges operate Monday to Friday year-round, except U.S. holidays. Trading sessions run from 9:30 a.m. to 4 p.m. That daily session is where most traders are. It’s where you find most of the volume.
Unlike the Nasdaq and NYSE, OTC markets don’t allow for premarket and after-hours trading. Trading in these sessions can allow you to take advantage of signs that a stock is likely to move the next day — for example, if there’s overnight news.
Be warned: Trading outside of regular market hours can be tricky. There’s generally far less liquidity. That means it’s harder to get a trade filled without knocking the price around. Make sure you know what you’re doing before you venture into the after-hours arena.
How Do You Find Potential Penny Stocks?
One of the best ways is to use a penny stock screener. A good screener could completely change your approach to trading. I’ll show you how in a bit…
You also need to be aware of what has the power to move stocks. We call those catalysts. Learning to spot catalysts can help you find opportunities. And you don’t have to do it alone. STT’s Breaking News Chat room alerts subscribers to the hottest news that can spark big moves in stocks. Check out a 14-day trial of STT + BNC for just $17 here.
How to Find Penny Stocks Before They Explode
A penny stock screener can help you find penny stocks that show signs of a possible breakout. Then you can use technical analysis to see if these stocks are potential trades.
How do you use a penny stock screener to do this? Let’s find out…
How to Trade Using a Penny Stock Screener in 9 Steps
A penny stock screener takes a lot of the legwork out of finding the best stocks to trade. Screeners scan scores of stocks that meet the criteria you set.
Here are nine ways traders use penny stock screeners…
#1 Follow Chart Patterns
Think of patterns in a stock chart like footprints, with other traders leaving the tracks.
Big picture: You’re looking at the movements of the market herd. Once you understand what you’re seeing, the patterns can give you an indication of what the herd will do next.
When you can anticipate what might happen next, you learn where the odds are better. Then you can start thinking about your trades in a more dynamic way. No more lunging in the dark, hoping for the best.
Knowing chart patterns can help you determine appropriate stop-loss and take-profit levels.
Successful traders use chart patterns to trade all kinds of markets. I recommend making chart analysis a major part of your trading strategy.
Examples of Key Chart Patterns
Here are two examples of patterns commonly found in penny stocks.
Breakout Pattern
A breakout pattern involves a stock breaking above a key price level.
Here’s a six-month chart for Sundial Growers Inc. (NASDAQ: SNDL), with a resistance level of around $1.25 in January.
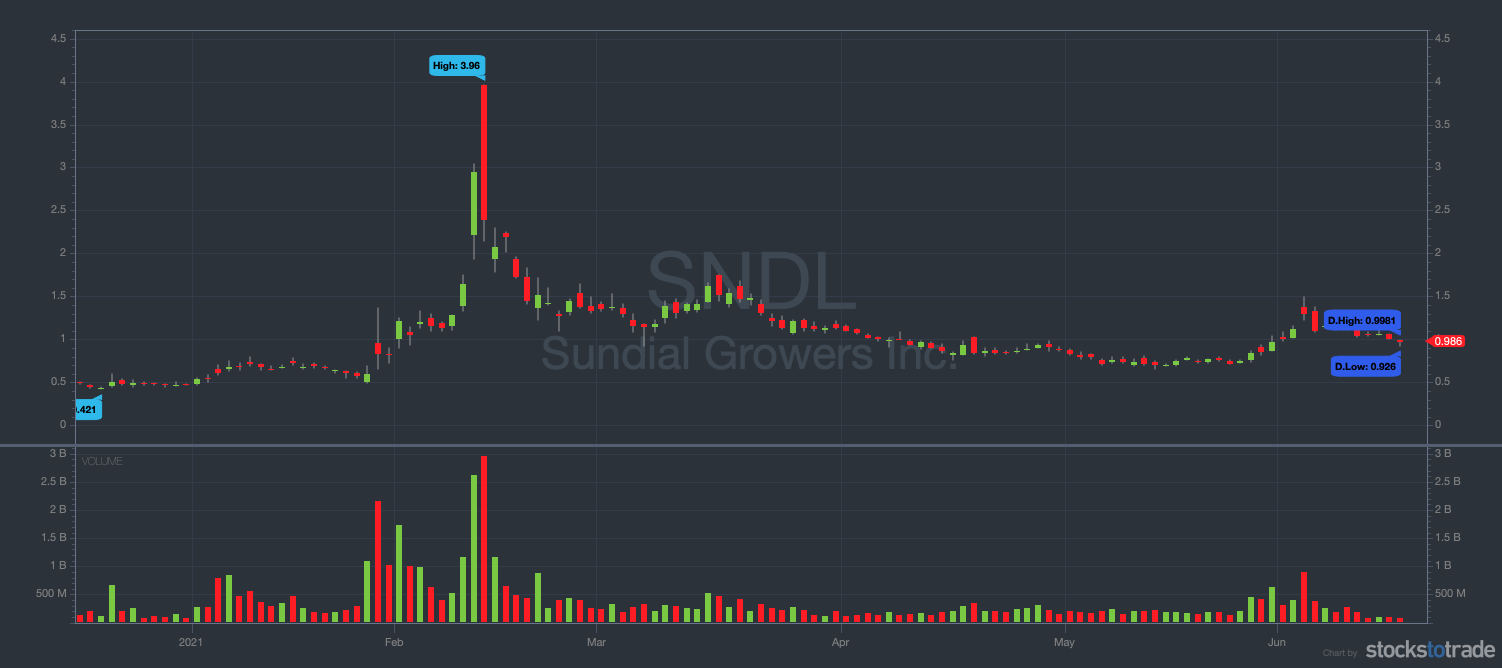
6-month SNDL chart (Source: StocksToTrade)
In mid-February, the stock broke above resistance on a big spike in volume, before making a run to the $4 range.
Traders who bought this breakout would have made a nice profit, assuming they were nimble in exiting the trade.
Breakout and Retest
Penny stocks that break above or below a key level often come back to the breakout point before continuing the move.
This chart shows Curaleaf Holdings (OTCQX: CURLF) establish a support level of around $8 last August.
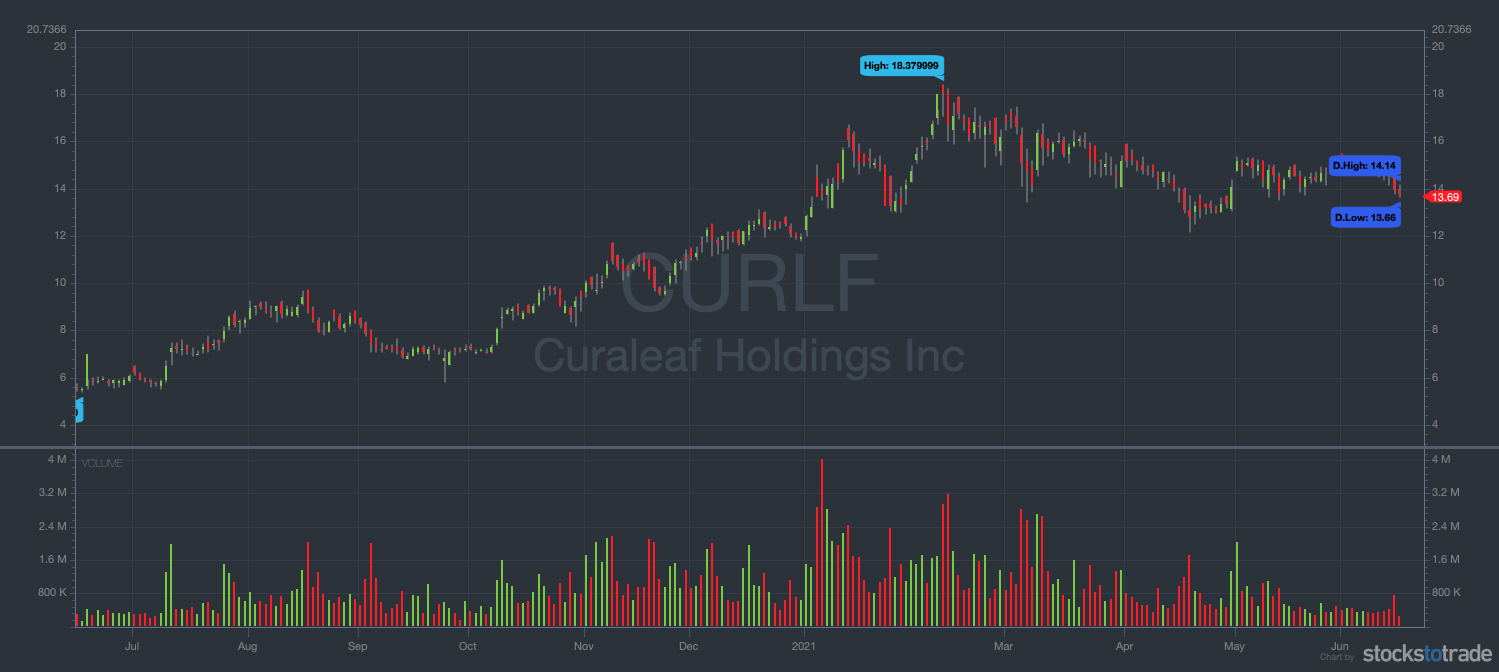
CURLF 1-year chart (Source: StocksToTrade)
CURLF fell below support in September, before returning to that level in October. The previous support level acted as resistance, and the stock continued its move to the downside before breaking out beyond the $10 level in November.
Only Trade Patterns You Master
Do a quick online search on charting and you’ll find a slew of information on how to trade penny stocks using chart patterns, as well as thousands of recorded chart patterns.
Newbies often learn the basics of a few patterns — then place bad trades. That’s because they don’t fully understand what makes a great chart setup and what doesn’t.
If you’re new to trading, maybe pick one or two chart patterns. Get real cozy with them. Then backtest them and dig into their intricacies.
You want to live and breathe your patterns. Know them like the back of your hand. Keep track of previous examples of these patterns. Make them your best friends. That’s a good way to develop confidence and expertise.
#2 Follow Technical Indicators
After chart analysis, it’s time for technical indicators. Traders often overlay technical indicators on a chart as a way to filter trades for higher probability.
Technical indicators take raw price and volume data from a chart and manipulate it to show things like recent momentum, trend strength, or volatility.
Sound complicated? Don’t worry — indicators are pretty simple to use once you get the hang of them.
Examples of Technical Indicators
Here are two recent examples of potential technical indicator setups:
Moving Averages
Moving averages show the average price of a stock over a selected period.
There are lots of ways to use moving averages to get an indication of a stock’s future direction. For example, you can use the crossover of a faster-moving average compared with a slower-moving average to indicate a change in direction.
MACD Indicator
The moving average convergence divergence (MACD) indicator shows the relationship between two moving averages, normally the 26-period and 12-period exponential moving averages (EMAs).
This indicator can help you spot potential changes in trends.
#3 Trade Stocks With High Volume
A common trap when looking for a trade is falling for low-volume penny stocks. The trade looks great, but the stock just doesn’t have enough trading volume.
Having enough trading volume means that there are always enough buyers and sellers in the market, ready to take the other side of your order. So you can easily get in or out.
Some traders filter for stocks that have at least one million in daily trading volume. Those with large accounts might require even more volume.
Examples of High-Volume Stocks
Here are two examples of stocks with high trading volume. Check out the comments on the charts to learn more about examining trading volume.
Bionano Genomics Inc. (NASDAQ: BNGO)
BNGO is an American biotech company that often seems to be in the spotlight. This former penny stock was my #1 short squeeze play idea going into February.
The volume on this stock is insane. It has traded 100 million shares or more many days.
This stock gapped up big in December 2020, jumping from 50 cents to almost $14 in a few days.
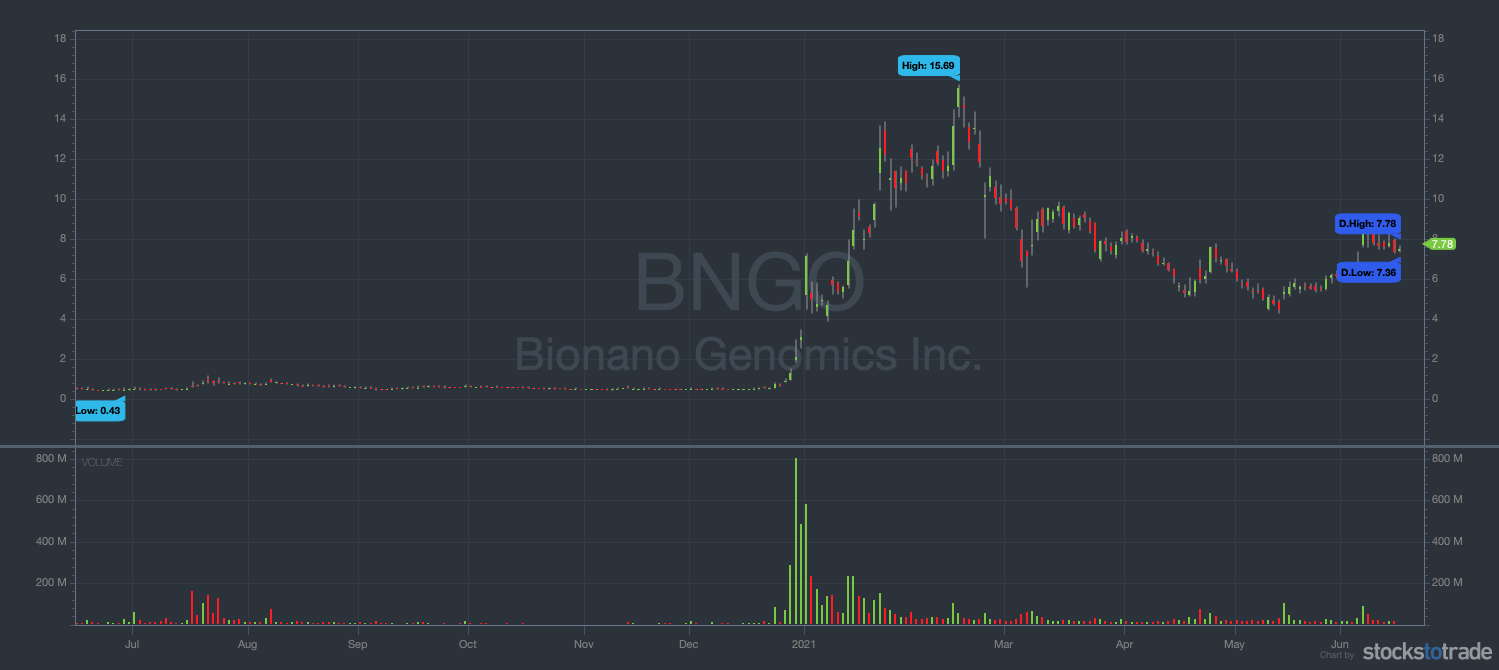
BNGO 1-year chart (Source: StocksToTrade)
GEVO Inc. (NASDAQ: GEVO)
GEVO is an energy company that’s consistently had big volume this year.
If you’ve been tuning into the Pre-Market Prep sessions every trading day at 8:30 a.m. Eastern on Instagram, you know I’ve talked about this stock quite a bit…
I’ve called GEVO “the worst stock in the world” … It’s been one of those penny stocks to avoid. But it’s seen a few huge momentum pushes.
This stock also traded close to 100 million shares a day on average for a bit … Talk about volume!
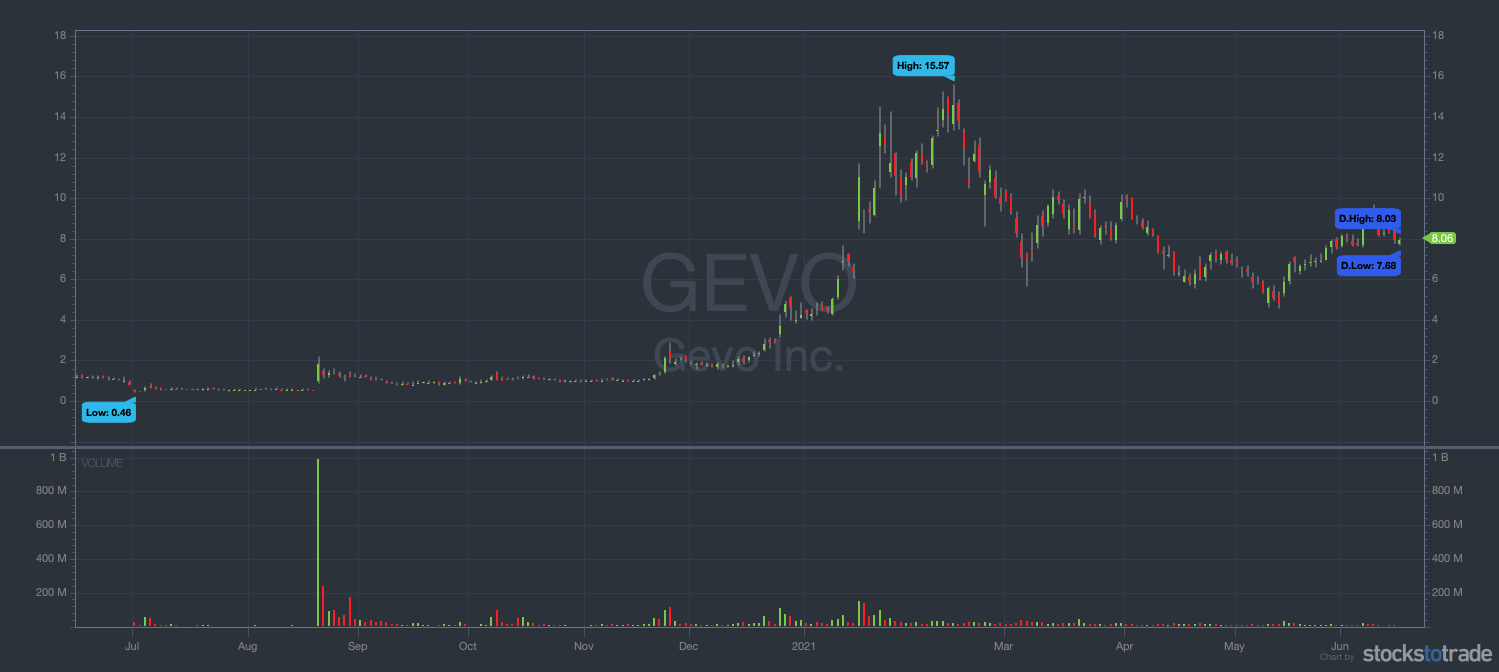
GEVO 6-month chart (Source: StocksToTrade)
#4 Trade Based on News Catalysts
Traders love stocks that look ready to move. A great way to find them is by trading off news catalysts.
A news catalyst is any development that can affect a stock’s price. It can be a news story, a company announcement, an SEC filing, or even Twitter gossip.
You probably already have your favorite stocks. It’s important to stay up to date on the news about those companies before and after trading sessions. Catalysts can lead you to the action, but you’ve gotta see them before you can act on them.
The STT Breaking News Chat add-on feature is one of the best ways to keep up with market-moving news. Run by two trading pros who scan market news all day, it’s changing the game. Check it out now — get your 14-day trial here.
#5 Don’t Trust Stock Promoters
Stock promoters are hired to help raise public awareness of a stock.
That awareness can result in rapid price movement, and often allows company insiders to liquidate shares at a higher price. It can also be a way for the company to raise funds while the stock’s at an artificially high price.
Promoters have bags of tricks. Sometimes they run newspaper ads or issue press releases. They might pay to run a news story. They’ll do massive email blasts hyping a stock. These days, you find them on Twitter a lot.
Most promoters operate in the smaller end of the market, mainly penny stocks. What they do isn’t illegal, but it can be shady.
No matter how hot a stock seems, no matter how good the story, never trust stock promoters. Do your due diligence. Look at the charts. Check out the stock’s price action. Look to get in and out. The excited masses can push a stock price up before its ultimate collapse.
#6 Cut Your Losses Quickly With Stop Losses
No trader profits on 100% of their trades.
Some successful traders lose on half their trades but still make huge profits every year. There’s a simple reason for this: Trading is mostly about losing a little when you’re wrong and (hopefully) taking a profit when you’re right.
That’s where stop losses come in. These are predetermined price points where you’ll exit a trade if it’s going against you.
Say you buy a stock for $1.50 and place a stop loss at $1.40. If the stock drops to $1.40, that’s your cue to protect your capital and get out!
Always plan your stop loss. You can base it on a key chart pattern level. Use stop losses wisely, and they can help keep your trading in fighting form.
#7 Keep a Trading Journal and a Stock Watchlist
On the SteadyTrade Team, we love these two simple but powerful tools: trading journals and stock watchlists. Let’s take a quick look at how to use them…
A Trading Journal
A trading journal allows you to record everything about your trades, including your mindset for the day and what you’re thinking about the markets.
But it’s not enough to record the information. You have to analyze it and use it to help you refine your trading strategy and ability.
Some examples of things you can track in your trading journal:
- A detailed history of your trades: your entry, your exit, where you placed your stop loss, the trade duration, and the order type.
- Your analysis and thoughts on market conditions at the time. Was the sector hot? Was the overall market up or down?
- Your emotional state while in the trade. Were you stressed to be in a short trade while the market was up? Or were you relaxed and confident?
- General market or trading strategy observations to explore later.
Why collect this information? So you can go back and see where you’ve done well and which areas need improvement. Better trading is all about doing more of what works.
Want to bring your trading game to the next level? Consider joining the SteadyTrade Team. It’s a community of traders, run by pros who take trading seriously!
Stock Watchlists
A stock watchlist is a place for you to track stocks that you think show potential.
You can use watchlists to keep tabs on different market sectors. Many traders keep separate watchlists — for example, one for pot stocks, one for biotech, and another for crypto stocks.
Once you have your watchlist, it’s time for research. Hone in on these stocks to be more prepared when the market opens.
#8 Don’t Trade Too Big
Here’s a key rule in trading: Never bet the farm. Never risk it all on one trade.
Some newbie traders start out by putting all of their capital into one or two stocks. If those trades turn south, it can mean losing a big chunk of capital.
Before you start trading with real money, you need to learn to manage risk. Start small. Only risk a small fraction of your capital on any one trade, maybe 1% or 2%.
Let’s look at how that plays out in terms of real money. Say a trader with a $20,000 account buys $2,000 worth of stock. This trader also sets their stop-loss to close out the trade if the stock price declines by 10%. This means a risk of $200, or 1% of the account.
You have to manage risk. No matter how confident you are in a trade, it can always be a loser.
Never let one loss do major damage to your capital!
#9 Use a Top Penny Stock Screener
There are over 18,000 stocks traded in the U.S. each trading day. You have to find a way to filter through all of them to find the best opportunities.
A penny stock screener can help you quickly build a list of penny stocks that look like good trades.
With a good penny stock screener, you input the exact trading criteria that you’re looking for, like chart patterns or a combination of technical indicators. Once you set your markers, the screener quickly scans and returns a list of potential trading candidates.
Don’t overlook this tool. Stock screeners are useful time-savers, doing the bulk of the research for you.
Take Advantage of All the StocksToTrade Features
If you’re heading into battle, you want the most powerful weapons at your disposal, right?
Think of going into the markets as going into battle. That’s the mentality that went into building the StocksToTrade platform. It was designed by traders, for traders. Here are just a few of its great features:
- Highly customizable charting features to give you a clean, elegant view of market action.
- A massive and growing library of technical indicators.
- Real-time scanning abilities, including a great tool to track news stories, SEC filings, and Twitter feeds — anything with the potential to move stocks.
- The ability to view nearly every stock traded in the U.S., including pink sheets and OTC markets.
- And many more premium features to help make your trading day easy.
StocksToTrade was designed for penny stocks and much more. See how it can help you every trading day — grab a 14-day trial for just $7 now!
What Should I Look For in a Penny Stock Screener?
As a penny stock trader, you want to make sure your penny stock screener has a good number of search criteria. You want to be able to narrow your search as much as possible as you build your watchlist.
Can You Become Rich From Penny Stocks?
Of course. But nothing in trading is guaranteed. Trading penny stocks can be risky, and it’s important to understand that before you begin. There are no get-rich-quick tricks when it comes to trading penny stocks. It takes time, practice, and work.
What Is the Best Penny Stock Screener?
There are many good penny stock screeners out there. I use StocksToTrade because of its awesome search capabilities. It lets me narrow my choice of potential trade ideas to those that best fit my trading plan and my goals.
Conclusion
Are you ready to use a penny stock screener? Once you’ve seen the benefits firsthand, you’ll never stop using one.
But remember: You also need a winning strategy. That means having a process to find great trades. Use your favorite chart patterns combined with news catalysts.
It’s OK to take baby steps. Keep your screening criteria simple, then revamp your process and add more criteria as you gain experience.
Make sure you record everything you do in your trading journal. That includes trial-and-error results from the screening process. Track every move you make, then go back and analyze what worked and what didn’t.
And if you don’t have a penny stock screener ready to go, check out the 14-day trial of StocksToTrade for $7 now!
What criteria do you scan for in stocks? What are your top tips? Share your comments below!