Short-term traders often underestimate the significance of fundamental analysis because they think it’s only useful for buy-and-hold investors and long-term traders. But that’s sentiment isn’t entirely accurate.
Whereas short-term price reactions and fundamental data do not always correlate, fundamental analysis can nevertheless help a trader gain unique insights into the factors that drive a stock’s price movements. A company’s fundamentals play a large role in shaping the stock’s future price movements.
But let’s back up just a bit to briefly define fundamental versus technical analysis: Fundamental analysis is a trading approach that looks to measure a stock’s true value and make trading decisions based on the results of the analysis.
Technical analysis uses statistics to predict the price movement of a particular stock; fundamental analysis, on the other hand, largely relies on a company’s financial statements, economic data and political events to determine a company’s fair value.
Trading on fundamentals is built on the idea that the market is not perfect and gaps can occur when assigning a company its true value.
With time, the market tends to move towards the intrinsic value or true value of a stock based on its fundamentals. If the current market value does not match the true value, a trader can profit from the situation by placing the appropriate trades then waiting for the market to adjust the valuation of the company.
Types of company valuations
There are literally dozens of different ways to value a company. They can, however, be divided into three broad categories:
- Ratio Analysis
- Cash Flow Analysis
- Extrinsic factors–earnings announcements, analyst upgrades/downgrades, stock splits, M&A
Ratio Analysis
Ratio analysis is the most common method of valuing a company. It involves comparing a company’s financial metrics with those of its industry peers. Common types of ratio analysis tools include:
- Price-to-Earnings(P/E)
Price-to-Earnings, or P/E, is a very popular fundamental analysis metric. It’s based on the simple premise that P/E ratios of companies that belong to the same industry tend to cluster around certain values, with outliers being companies that are either undervalued or overvalued. To calculate a company’s P/E, we divide the current stock price by the company’s earnings per share (EPS).
P/E Ratio = Current Stock Price/ Earnings per Share
P/E is usually expressed as trailing twelve months (ttm) or forward P/E. For example, if a stock is selling for $40 and its earnings over the past 12 months were $2, then its P/E (ttm) is $40÷$2=20. If analysts estimate that its earnings over the next 12 months will be $2.50, then its Forward P/E becomes $40÷$2.50=16.
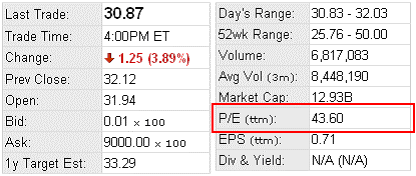
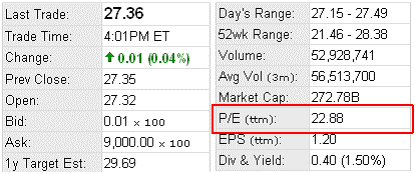
In the screens below, Company A has P/E (ttm) of 43.60, much higher than Company’s B reading of 22.88 for the same metric.
Company A
 Company B
 Source: TradingAcademy
Despite being a useful ratio for comparing the relative valuations of different companies, P/E does have some important nuances. For example, many early-growth companies have very high or negative valuations because they have yet to become profitable. Despite this anomaly, the market tends to assign high valuations to such companies because it expects them to continue growing rapidly for many years and eventually become profitable.
Other sectors such as internet and cloud companies that rely on a subscription model tend to have high customer acquisition costs that leave many in the red. They, however, tend to be high growers and eventually manage to grow into their high valuations. It might, therefore, still make sense to buy such stocks despite appearing to be relatively overvalued.
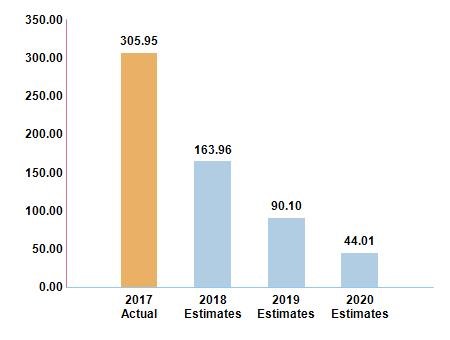
A good case in point is online retailer Amazon, whose expected P/E ratio of 163.96 for 2018 is nearly 10 times bigger than Walmart’s due to Amazon’s much higher expected growth. Amazon is expected to gradually grow into its high valuation as it continues to mature and its profits expand.
Amazon’s P/E
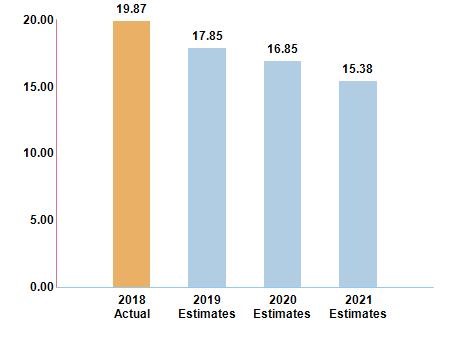
Walmart’s P/E
 Source: Nasdaq
- Price-to-Sales(P/S)
The price-to-sales ratio(P/S) is another useful measure for sizing up stocks. The P/S ratio tells you how much investors are paying for a dollar of a company’s sales rather than earnings as is the case with P/E. But just like P/E, a lower P/S is more desirable for value investors because it suggest that a company could be undervalued.
The P/S ratio = Stock Price per Share/ Net Sales (Revenue)per Share
P/S is a useful ratio for evaluating companies in highly cyclical industries such as semiconductors, or those that have suffered a temporary setback. For example, P/S ratio might be useful for evaluating a profitable company that makes a huge asset write-down and consequently takes a big loss.
That said, P/S should be used carefully because it can give a distorted picture when comparing companies in different sectors. For example, construction companies report high sales turnovers during a construction boom, though little of that trickles down to the bottom line. Contrast that to the high profit margins by on-premise software companies such as Oracle.
A trader should look at other metrics such as profit margins and debt when comparing the P/S ratios of two companies.
- Price-to-Book (P/B)
The Price-to-Book ratio, or P/B, is used to evaluate how much money investors are willing to pay for each dollar of a company’s assets. To calculate the P/B ratio, we divide a company’s market value by its net assets less intangible assets such as goodwill.
P/B Ratio = Market Price per Share / Book Value per Share
The book value per share= (Total Assets – Total Liabilities)÷Number of shares outstanding
P/B is a more highly refined ratio because it takes out intangibles from the equation and shows what investors are paying for actual physical assets and not harder-to-value assets like goodwill.
P/B is therefore considered to be conservative metric and tends to work well for investors looking for low-priced stocks that have been overlooked by the market.
A P/B ratio below 1 is considered ideal by value investors because it suggests a company is worth more than what the market is currently willing to pay for it. Such a company can potentially turnaround its fortunes in the hands of good management or can be broken up and sold to unlock its full value.
It’s important for traders to note that P/B does not carry much value for service-based companies. A company like Microsoft is highly valued for its intellectual property but has little in the way of physical assets. Microsoft’s P/B ratio of 9.3 is much higher than AT&T’s 1.5 because the latter owns much more physical infrastructure.
It’s also important to be aware of the fact that a company’s non-operating factors can change so much that the company’s market value no longer reflects the true value of its assets. For example, a company that authorizes huge volumes of share buybacks or takes cash and places it on a reserve fund to finance a pension plan will see a significant reduction in its book value with no significant changes in operations taking place.
- Price/Earnings-to-Growth (PEG)
The price/earnings to growth ratio (PEG) is a modified version of P/E ratio that takes into account a company’s expected earnings growth. The PEG ratio is simply the P/E ratio divided by earnings growth rate:
PEG ratio = P/E ratio / Earnings Growth Rate
Multi-year growth estimates(frequently five years) are usually used instead of one-year rates so as to smooth out volatility.
A PEG ratio above 1 means that a company’s stock price is expensive relative to its expected earnings growth and, consequently, could lead to the share price falling to reflect the slow growth.
A PEG ratio below 1 means the shares are priced cheaply relative to earnings growth and could rise to reflect this reality.
The greatest attribute about the PEG ratio is that it brings future growth expectations in the mix in a way that a simple P/E ratio cannot. Thus, it’s possible to find Company A with a higher P/E ratio than Company B but a lower PEG ratio based on its superior earnings growth profile, suggesting that Company A is in fact better value than B. Another big benefit is that PEG can be used to provide an apples-to-apples comparison between companies in diverse sectors.
For companies that are high dividend payers, PEG in its basic form can fail to give the true picture of a company’s valuation. A Dividend-adjusted PEG ratio is used instead, and calculated as follows:
Dividend Adjusted PEG Ratio = P/E / (Growth Estimates + Dividend Yield)
Using the adjusted PEG ratio allows you to spot companies with good total returns that you might otherwise miss when using a basic PEG ratio alone.
- Debt-to-Equity Ratio (D/E)
Debt-to-Equity ratio or D/E is a financial liquidity ratio that shows the percentage of a company’s financing that has come from creditors compared to what has come from investors.
The D/E formula is as follows:
Debt-to-Equity Ratio = Total Liabilities/ Total Equity
A D/E of 0.5 means that the company owes $0.5 for every $1 in equity.
Different industries have different D/E benchmarks since some industries tend to use more debt financing than others. In general, however, a lower D/E is desirable because debt must be repaid with interest to the lender entailing additional expenses and lower profits for the shareholders. This becomes a particularly big problem when interest rates are high, or the company is issuing a lot of junk bonds which normally come with steep repayment rates.
High debt levels are, however, not necessarily a bad thing. A company can borrow heavily to finance highly profitable operations in which case investors benefit from higher profits. If the rate of return on investment (ROI) is much higher than the cost of capital, then investors are likely to give the company a free pass.