
High-volatility stocks sound scary to people with an investment mindset.
Investors learn to look for stability in stocks. That’s fine if you want to make 7% or so — per year. But active traders are looking for more than that, and high-volatility stocks can be bread and butter for active day traders.
On the SteadyTrade Team, we look for high-volume, high-volatility stocks. These are the stocks that show up on our premarket stock screens for the biggest percent gainers…
They’re the stocks that have shown high volatility in the past. They’ve run on news catalysts and usually dropped at some point after.
High-volatility stocks are great for day trading because they often follow patterns. If you see a stock that’s run before on news … there’s a good chance it will run again on news.
Active traders aren’t just interested in the upside of high-volatility stocks. One of the patterns we cover most on the SteadyTrade Team is the dip and rip…
This looks to another part of the high-volatility equation. After one of these stocks runs, it often dips as traders take profits. Other traders will get stopped out, sending the price lower.
For dip buy traders, this represents an opportunity. The stock may continue to trend up. It might have a short bounce. Or it may continue its downward spiral. You can never be sure with high volatility stocks…
That’s why it pays to be prepared.
Table of Contents
- 1 What Are High-Volatility Stocks?
- 2 Why Is Volatility Important?
- 3 How to Find High-Volatility Stocks
- 4 How to Trade High-Volatility Stocks
- 5 Which Is the Best High-Volatility Stocks Screener?
- 6 Examples of High-Volatility Stocks
- 7 Bonus: What Are High-Volatility Penny Stocks?
- 8 High-Volatility Stocks: The Bottom Line
What Are High-Volatility Stocks?
Active traders often talk about high-volatility stocks — meaning stocks with big price moves. When I’m talking about a potential trade, I’m not talking about high daily volatility in a stock…
I’m talking about the highest volatility stocks today.
But we’ll get to that later. First, let’s talk about the concept of stock volatility…
What Is Stock Volatility?
Volatility is the measure of how much a stock’s price moves. It can be measured against the ups and downs of the market…
Or it can be plotted statistically against the average price.
That’s a bit more information than we need to trade volatility. But just so you know, there are technical ways to measure a stock’s volatility.
One way looks at standard deviation. This takes all the price points a stock hits over a given time … Then it measures them against the mean price.
A high-volatility stock has a higher deviation on average than other stocks. A more stable stock will have a lower standard deviation.
Traders with an investment mindset will often talk about volatility like it’s a bad thing. The traditional wisdom for investors is to go with a stock that charts a clean course over time.
A blue-chip stock like Coca-Cola (NYSE: KO) has relatively low volatility. Coke is a consumer staple, which means that people buy it even in a recession.
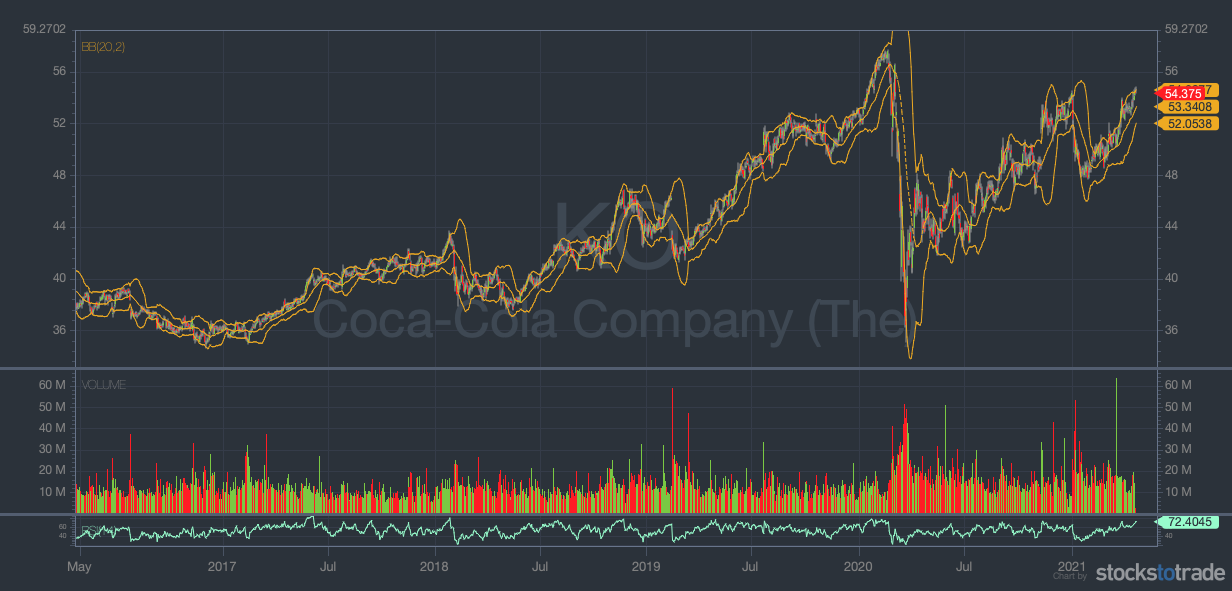
Coca-Cola (NYSE: KO) 5-year chart, Bollinger Bands (Source: StocksToTrade)
Bollinger Bands are the best indicator for measuring standard deviation.
This indicator is made up of three lines. The middle line is usually a 20-day simple moving average (SMA). The top and bottom lines usually measure two standard deviations from the SMA.
You can see that Coca-Cola’s Bollinger Bands were tight before the high volatility that affected all stocks in 2020. It’s worth noting that Coca-Cola’s volatility is lower than that of the market.
On the other end of the spectrum is Luckin Coffee (OTCPK: LKNCY). It was delisted from the Nasdaq and put under SEC investigation last year.
Look at all this volatility!
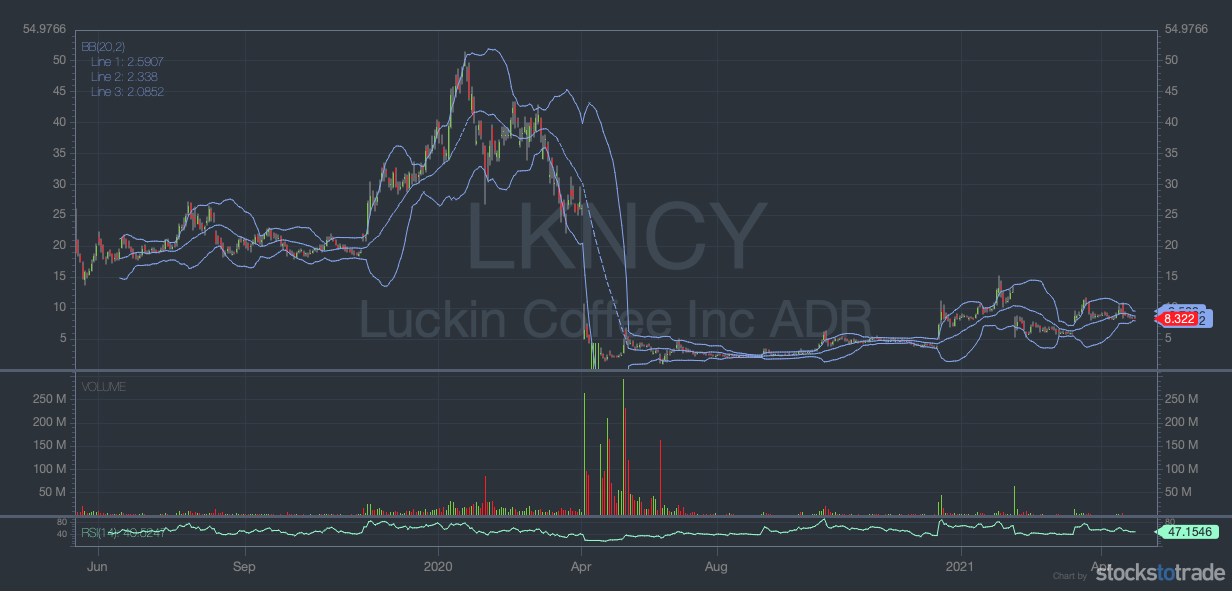
Luckin Coffee (OTCPK: LKNCY) 22-month chart, Bollinger Bands (Source: StocksToTrade)
Why Is Volatility Important?
Active traders look at volatility in a different way than investors do.
There are some high-volatility stocks I wouldn’t even hold overnight … But that doesn’t mean you can’t trade them for a profit — as long as you pay attention to risk.
When I do my morning scans for the biggest percent gainers, I’m looking for volatility. But I’m not looking for volatility in a stock’s Bollinger Bands…
I’m looking for volatility today.
This happens when you put the two most important market forces together — supply and demand.
On the SteadyTrade Team, we have a checklist that we run down for potential trades. At the top of the list? A stock’s float status — aka supply.
A stock’s float is the number of actively traded shares. Anything under 20 million shares might be considered low float … But I like to look for stocks under 10 million shares.
When unusual volume comes into a low-float stock, the price may spike. This is the demand side of the equation … and it makes for the kind of volatility WE LOVE.
The other part of this is setting your risk. This is where a great community like the SteadyTrade Team can help.
Any trade can go against you … It hurts when your trade idea worked, but your risk was set too tight.
We go over trading plans every morning on the SteadyTrade Team, and there are two live webinars a day. I’ll personally answer questions. And we have a great chat room for that, too.
High-volatility stocks can be great to trade, but you can’t go in there blind. Join us on the SteadyTrade Team today.
How to Find High-Volatility Stocks
When you’re creating a watchlist, include high-volatility stocks that have been runners in 2021. Study their charts, and you’ll be prepared when a catalyst comes their way.
One way to study is with my NO-COST weekly watchlist that I send out every Sunday. Each week you’ll get the stocks I’m paying attention to, delivered straight to your inbox.
They’re all high-volatility stocks. But what makes them worth paying attention to isn’t what they’ve done in the past…
It’s because of what I think they can do now.
I don’t have these ideas because I know something that you don’t. I have them because of what I’m paying attention to.
These are the things the whole market is paying attention to. All this attention can make high-volatility stocks run.
Keep Former Runners on Your Watchlist
If a stock is a former runner, you know that it’s already on the market’s radar. If it’s in a hot sector — even better. It’s already shown that it can run. There are a lot of boxes a stock has to check first … but if it’s in the chart, you know it’s possible.
You know that traders have already made money on this stock. They might be back to trade it again.
Looking at charts can also inform your risk. A lot of former runners are low-price, high-volatility stocks.
Wondering why they’re still low priced? That’s because they’ve fallen back to earth since their last run. And chances are there are still some bagholders from that last run.
I say it a lot: You have to let a stock prove itself.
One of the best ways a stock can prove itself is by breaking its previous highs.
Breaking the high of day gives you some confirmation. Breaking 52-week and all-time highs helps make sure all the bag holders are out before you get in.
Scan for the Biggest Percent Gainers on High Volume
This is the scan I do every morning before the market opens.
You can follow along on my NO-COST daily Pre-Market Prep session here.
I’m not looking for stocks with volatility in the past. I want to see it happening now. It’s a good sign if a stock is up big percentage-wise. It’s a better sign if it’s up on real volume.
Before 2020, I wanted to see a stock trade at least 10 million shares for the day … The most volatile stocks of 2021 regularly hit 100 million shares!
Next, check your scan against your watchlist. Your FOMO might get triggered by seeing these big gains … But chasing spikes and trading random stocks is no way to build your account. You want a stock’s volatility to work for you — not against you.
Check the Float
Remember to keep the stock’s float in mind. If a stock has a float of 10 million shares and it’s trading 10 million shares, that will tell you a few things.
First, its supply is being tested. This will often cause the price to go up.
Second, it’s had one float rotation. That means it has a lot of new shareholders. These traders aren’t bagholders — and their behavior will be different.
VWAP will give you a good idea of whether these new traders are making money or losing money.
Third, it may be headed for a short squeeze. When all the available shares are being bought up, shorts will think about covering … And this will send the price even higher.
How to Trade High-Volatility Stocks
You know how I said that I want to see a stock prove itself before I trade it? That’s why this pattern I’m about to share is one of my favorites.
I think this pattern has been the top pattern for part-time traders for a while…
I call it the ‘afternoon VWAP-hold, high-of-day break.’ It basically does what it says on the tin.
You’re looking for all the things I listed above:
- Former runners, in a hot sector, with news
- Up big in premarket
- High volume
- Low float
It might run up in premarket, then dip into a consolidation pattern into the afternoon…
You want to see it establish support no lower than 2% below VWAP. Then, as the 2 p.m. Eastern window approaches, volume should start to come in. If it breaks the high of day, it could keep running.
A lot of the time, I’ll use VWAP for risk here. Even if it pulls back, the fact that it’s above VWAP tells me it’s still in play…
But you should always respect your risk tolerance. Never risk money you can’t afford to lose. Your #1 goal is to protect the health of your account. It’s better to exit a trade too early than blow up your account.
Which Is the Best High-Volatility Stocks Screener?
StocksToTrade is built to pick up high-volatility stocks.
This powerful platform was designed by traders looking for volatility and high volume. It comes with several built-in stock screeners. One of the best for volatility scans is the biggest percent gainer.
Another valuable screener is the ‘new high of day’ scan. This scan will show you how many times a stock has hit a new high…
Other traders are seeing this too. And there’s a good chance it could keep hitting new highs.
There’s so much more you can use this platform for, like:
- A powerful news scanner
- Clean and customizable charts
- Your choice of add-on curated alerts
StocksToTrade has changed the way I trade. Grab your 14-day trial today — it’s only $7!
How to Scan for High-Volatility Stocks With StocksToTrade
This video gives a great breakdown of StocksToTrade’s high volatility scans…
But it doesn’t tell you one of StocksToTrade’s most important advantages. Stocks move on catalysts. And alert packages like Breaking News Chat can help — a lot.
Take a look at this alert on Ocugen Inc. (NASDAQ: OCGN) from February.
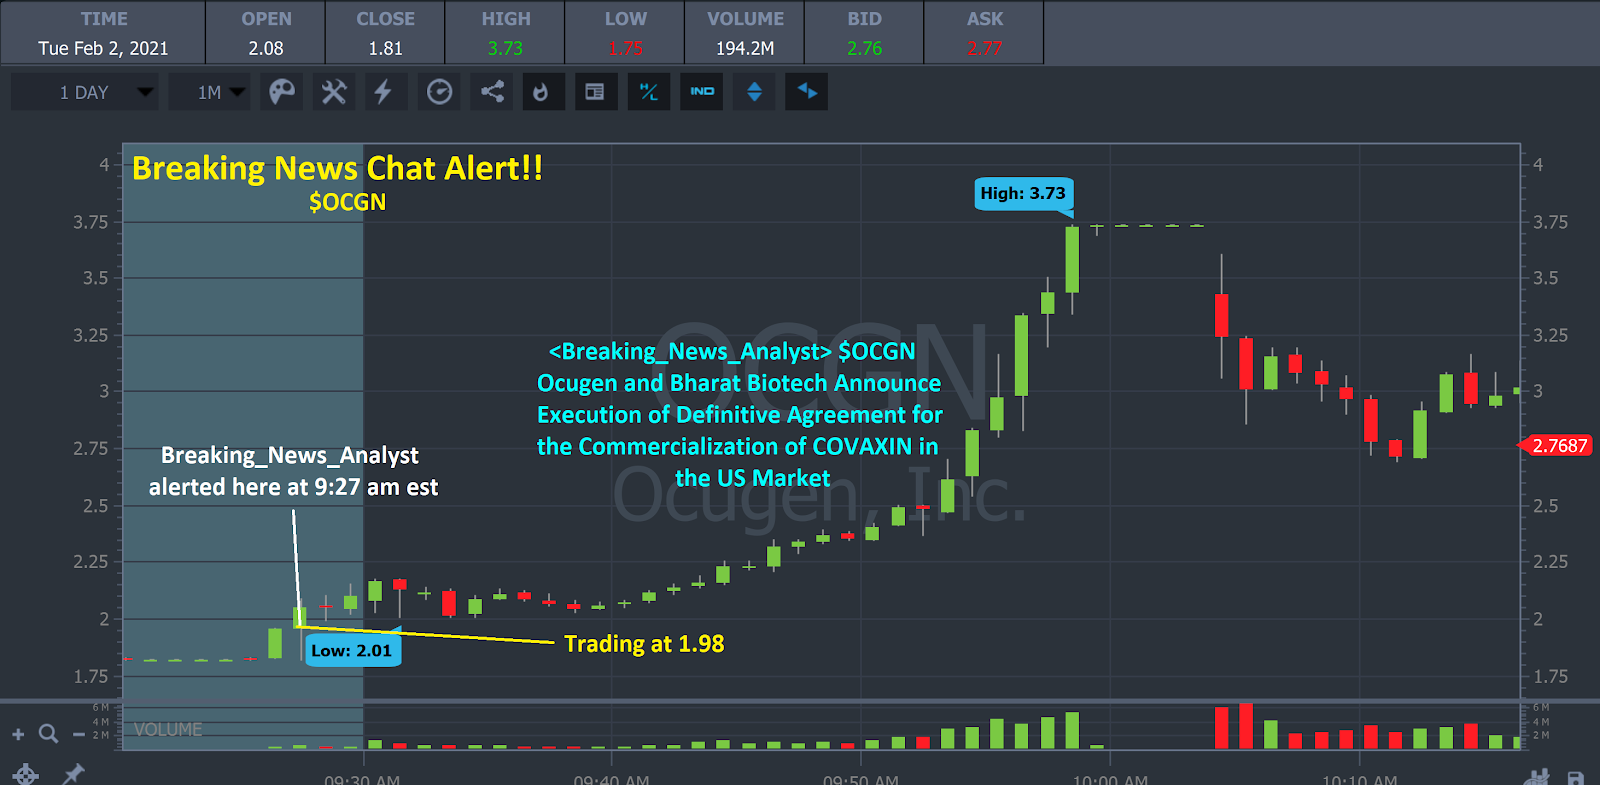
Ocugen Inc (NASDAQ: OCGN) one-day chart (Source: StocksToTrade)
The Breaking News guys caught this just as news was driving the price up. It had run on news before…
Breaking News alerted subscribers to the beginning of a multi-day run that would send the price as high as $15.81. (Note that past performance isn’t indicative of future results.)
Examples of High-Volatility Stocks
This list of high-volatility stocks shouldn’t shock you. Not if you’ve been following my watchlists and Pre-Market Prep…
These stocks have made moves in the past. And they could do so again.
I don’t want you to put these on your watchlist — not if they don’t make sense for your strategy. I’m showing you these stocks so you can see my thought process. Then I want you to start your list.
Microvision Inc. (NASDAQ: MVIS)
MVIS is a stock I’ve been watching for a year now…
It was below $1 a year ago. Since then it’s gone on a few nice runs.
It holds a bunch of patents around miniature projection and scanning. Doesn’t sound too exciting? I’ll put it another way…
One of MVIS’s products uses laser beams to form 3D images used for self-driving tech.
Now maybe you’ll get what WallStreetBets sees in this stock. Another thing WSB saw in mid-April: short interest over 30%.
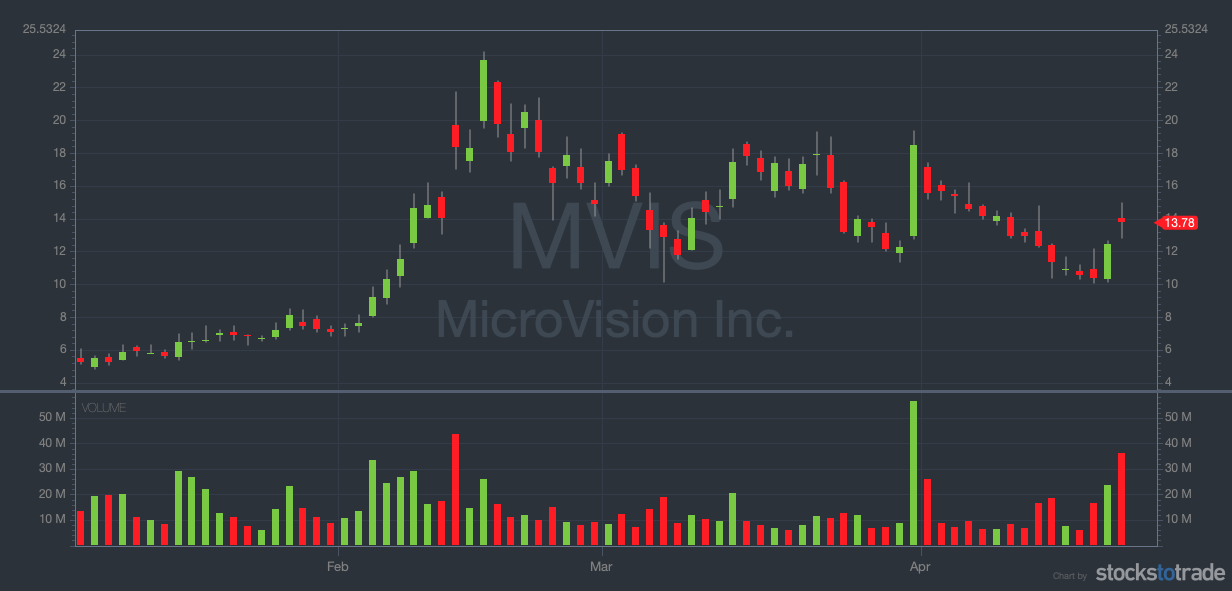
Microvision, Inc (NASDAQ: MVIS) YTD chart (Source: StocksToTrade)
Coinbase Global Inc. (NASDAQ: COIN)
A week after COIN’s direct listing, the stock had ranged from $287 to $429.
It was originally supposed to open at $250, not in the $380s. If you ask me, they got greedy.
It’s been a roller coaster for crypto lately. But Cathie Wood recently bought in … and like many others, I pay attention to what she’s doing.
If and when this stock starts to climb, I expect some fireworks.
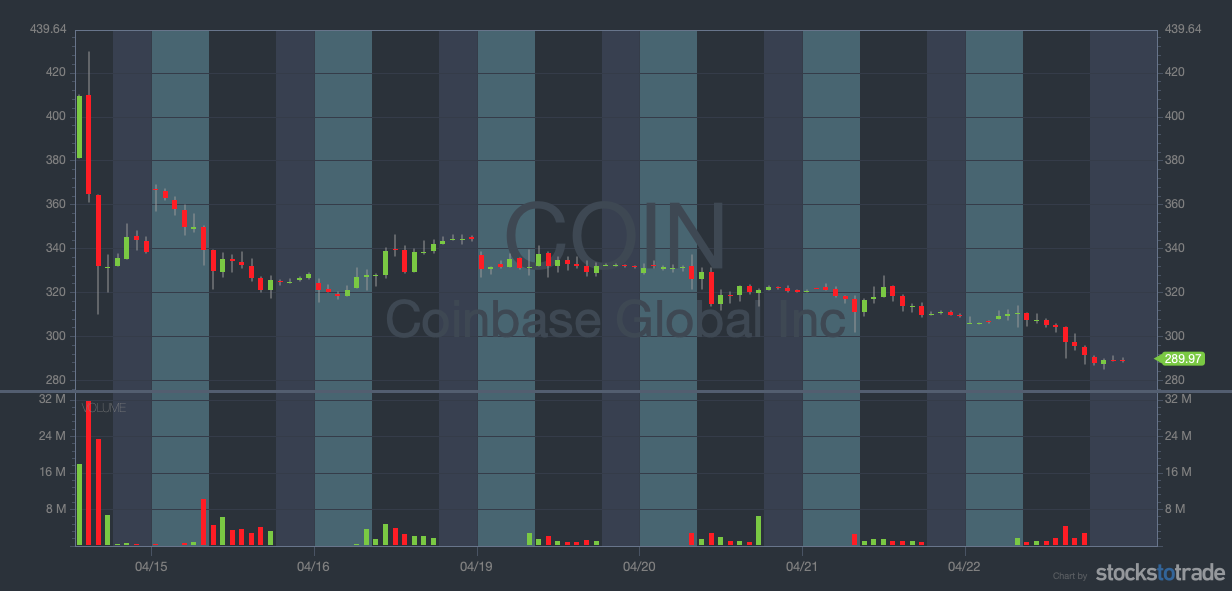
Coinbase Global Inc (NASDAQ: COIN) 7-day chart (Source: StocksToTrade)
DraftKings Inc. (NASDAQ: DKNG)
DKNG is another Cathie Wood buy and another stock I’ve watched off and on for a while.
It’s in a hot sector. And it’s got a quality catalyst — it recently announced that it will become an official betting partner of the National Football League.
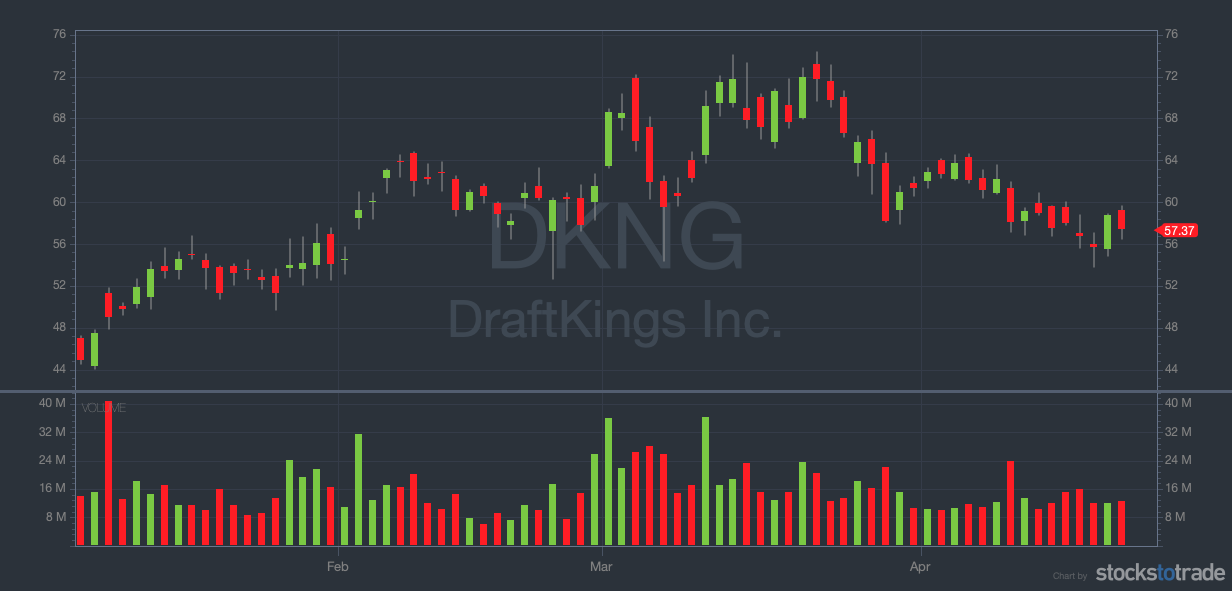
Draftkings Inc (NASDAQ: DKNG) YTD chart (Source: StocksToTrade)
Bonus: What Are High-Volatility Penny Stocks?
Take a look at where MVIS was a year ago. LKNCY, too. For OCGN, you only have to go back to the end of 2020.
All these high-volatility stocks were penny stocks. Now they’re not … but it’s anyone’s guess how long that will last.
Penny stocks tend to have boom-and-bust cycles. Be extra careful when you’re planning your exit.
High-Volatility Stocks: The Bottom Line
High-volatility stocks are what we look for as traders. The risk? It goes with the territory.
When you’re trading high-volatility stocks, it’s more important than ever to be disciplined. Stocks don’t just go up, despite what some forums might tell you.
That means that your trading plan is key. If you know what you’re looking for, high-volatility stocks can help get you there.
Do you trade stocks with high volatility? What do your trading plans look like? Let me know in the comments — I love hearing from my readers!