
When you’re trading or investing, you need to research every company that’s a potential trade.
Chart patterns and news catalysts are always necessary, but understanding the financial health of a company can also be a crucial step in weeding out less-than-stellar opportunities.
So how do you analyze a company’s financial health? Fundamental analysis. And don’t worry, you don’t need special accounting or math skills. It’s all pretty simple.
Today we’ll cover one of the most common fundamental ratios used in the markets: the earnings per share (EPS) ratio. Yawn, right? Wrong! This is an important piece of the puzzle …
You can use the EPS ratio to determine how much a company makes for its shareholders. You can then see if the company’s improving and even compare it to its competitors.
It’s all about your research and making more educated buying or selling decisions. Let’s get down to it!

Table of Contents
The EPS Formula
First, let’s clearly define what exactly the EPS formula is.
Earnings per share (EPS) is a financial ratio. It’s how much a company makes (its earnings) divided by the number of the company’s shares. Traders then use this ratio to analyze the company’s ability to produce profits for shareholders.
On its own, the EPS ratio doesn’t mean a great deal to a trader. Like we said, it’s a piece of the puzzle. It’s often used along with other fundamental and technical analysis, giving traders a broad perspective of a stock’s health.
EPS Calculation Formula
Now, let’s learn how to calculate the EPS using a simple formula. Don’t worry if you suck at math — this formula is super easy.
Before we begin our calculation, we need two pieces of information:
First, we need to know the net income and stock dividend amount, which can be found on the income statement. This number is effectively how much money the company makes.
Second, we need to know the number of common shares outstanding. This is found on a section of the balance sheet under stockholders’ equity.
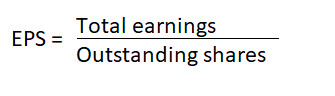
Now, subtract the dividends paid on preferred shares from the net income amount. That’s the company’s total earnings.
![]()
Next, divide the total earnings number by the number of outstanding shares.
Congratulations, you just calculated a company’s EPS!
Why the EPS Ratio Matters
The earnings per share metric is important to anyone evaluating a company’s financial health.
The number shows the company’s profits on a per-share basis. You can use it to track historical performance by comparing the EPS number over different years or quarters.
You may be wondering why you couldn’t just look at the company’s earnings … Why make things more complicated by calculating earnings per share?
The reason is that over time the number of shares in a company can change substantially. There can be buy-backs and new offerings.
That’s a big part of why calculating the EPS ratio matters. It gives traders a way to standardize the earnings number so they can compare apples with apples, regardless of a company’s size or structure changes.
Calculating the EPS formula is also a major step in some of the most common fundamental analysis techniques. If you analyze stocks, this is a very useful calculation to wrap your head around.
Here are a few fundamental analysis techniques that you’ll need the EPS for:
#1 P/E Ratio
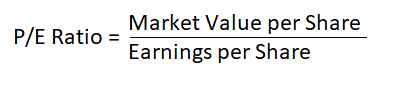
The price-to-earnings (P/E) ratio is the most old-school, granddaddy formula for determining a company’s valuation.
This ratio measures a stock’s current share price against its earnings per share. It’s also another simple calculation. Divide the stock price by the earnings per share.
Once you determine the P/E ratio for one company, you can calculate this ratio for several other companies, allowing you to compare the rough valuation of each company. You can then use that information to help you determine your next move …
For example, you may look to buy breakouts in stocks with low P/Es.
Why? A stock with a low P/E is possibly undervalued and the stock’s breakout implies that the market’s catching on. That could result in the stock price rocketing up until it reaches its fundamental value.
But remember — it’s all about your trading style and a slew of other factors.
#2 Other Valuation Methods
The EPS number isn’t just used in the P/E ratio.
There are other company valuation methods as well, such as the capital asset pricing model (CAPM) and the dividend discount model (DDM). These valuation techniques are complicated and well beyond the scope of this post. Plus, as an active trader, you’ll likely never use them.
Instead, it’s important to understand how earnings, especially earnings per share, can affect how investors value a stock.
Investors can buy a stock with the goal of making a return over time by holding onto an asset that makes a profit. Pretty simple, right?
Now, imagine that the asset grows its income and starts earning double the amount of profit. It’s pretty easy to imagine that the value of that asset has increased, maybe even doubled …
So, just keep in mind that the amount a company earns often has a direct effect on the market’s perceived value of that stock.
#3 Comparing Different Stocks
Knowing a company’s EPS can give you a snapshot of its current profitability and is useful in determining the company’s financial health over time.
But another common way to use the ratio when analyzing companies is to compare the EPS between stocks in the same sector. For instance, an investor might compare the EPS numbers of Ford and General Motors.
These companies are clearly in the same market and clearly major competitors.
But what if Ford has a substantially higher EPS than General Motors? This could be a hint that Ford is a better run company and potentially a better investment long term. As an active trader, you might not be thinking in terms of long-term investments.
But it’s a great idea to understand that changes in the earnings (and therefore the EPS) can cause money to flow into and out of stocks (especially during reporting seasons).
It’s good to have this in the back of your mind when looking for trades.
Types of EPS
We hope you’re enjoying this master class in all things EPS.
By now, you should be comfortable calculating the EPS of a company and hopefully have some ideas on how to use it in your trading strategy.
Next up, let’s run through the various types of EPS.
There are three types that differ, depending on which time period you’re looking at. Let’s take a closer look …
Current EPS
Current EPS is what we’ve focused on so far in this post.
It’s a company’s current earnings per share, determined by how much the company is currently earning and how many shares are currently outstanding.
This is the most commonly used EPS ratio — it gives the most up-to-date information without any of the subjective elements often involved in estimating future numbers.
So, if you learn how to calculate only one type of EPS, the current EPS is the one to pick.
Trailing EPS
Calculating the trailing EPS can allow you to see how a company’s EPS changes over time.
You can calculate a company’s EPS using the earnings numbers from previous quarters, usually using the four most recent quarters. At the end of a quarter, you can then recalculate the EPS using the latest financial information.
This can help you to analyze the trend of a share’s EPS numbers and also get an idea of the direction of a company’s financial health.
If the earnings per share grows over time, you get the sense that the company is doing well, then look for chart patterns that show good potential to the long-side. It all depends on your specific trading strategy.
Here’s a good way to think of trailing EPS: It’s basically a moving average for a company’s earnings per share.
Forward EPS
Forward EPS is another version of EPS analysis. It involves making an estimation of a company’s upcoming earnings.
Here’s how to calculate the forward EPS: Divide the company’s current share price by the estimated future earnings per share.
Careful … this can get a little tricky. Calculating future earnings can be very difficult if you’re not an absolute expert on the company. Heck, even experts can completely miss the mark on potential future earnings.
The upside — if you can do it correctly — is that you can spot a major change before the market. It’s that whole early-bird notion.
Big caveat: Average traders should be wary of trying to estimate the future earnings of a stock, but it’s important to know about this technique.
Using a Stock Scanner for EPS, P/E, and Other Analysis
You’re probably more comfortable using the EPS ratio to analyze stocks at this point. If not, remember to read more and study. And practice! You can always paper trade to hone your trading strategies and analysis.
Now, maybe you’re interested in using other fundamental ratios, such as the P/E ratio, to find trades or investments. Now what? Where, and how, do you start looking for stocks?
There’s a universe of tickers. Over 18,000 stocks are traded every day in the U.S. alone. It’s important to have a way to separate the wheat from the chaff, as quickly and efficiently as possible.
On our team, we use a stock scanner to help us build a list of compelling stocks. (It’s called a watchlist, and if you don’t maintain one already, there’s no time like now to start one.) Once we have our handy list, we start our analysis and research.
Side note on stock scanners: A stock scanner is software that a trader uses to scan the entire market, based on their exact criteria. The criteria can be related to EPS or P/E ratios and can also include specific chart patterns or technical indicators.
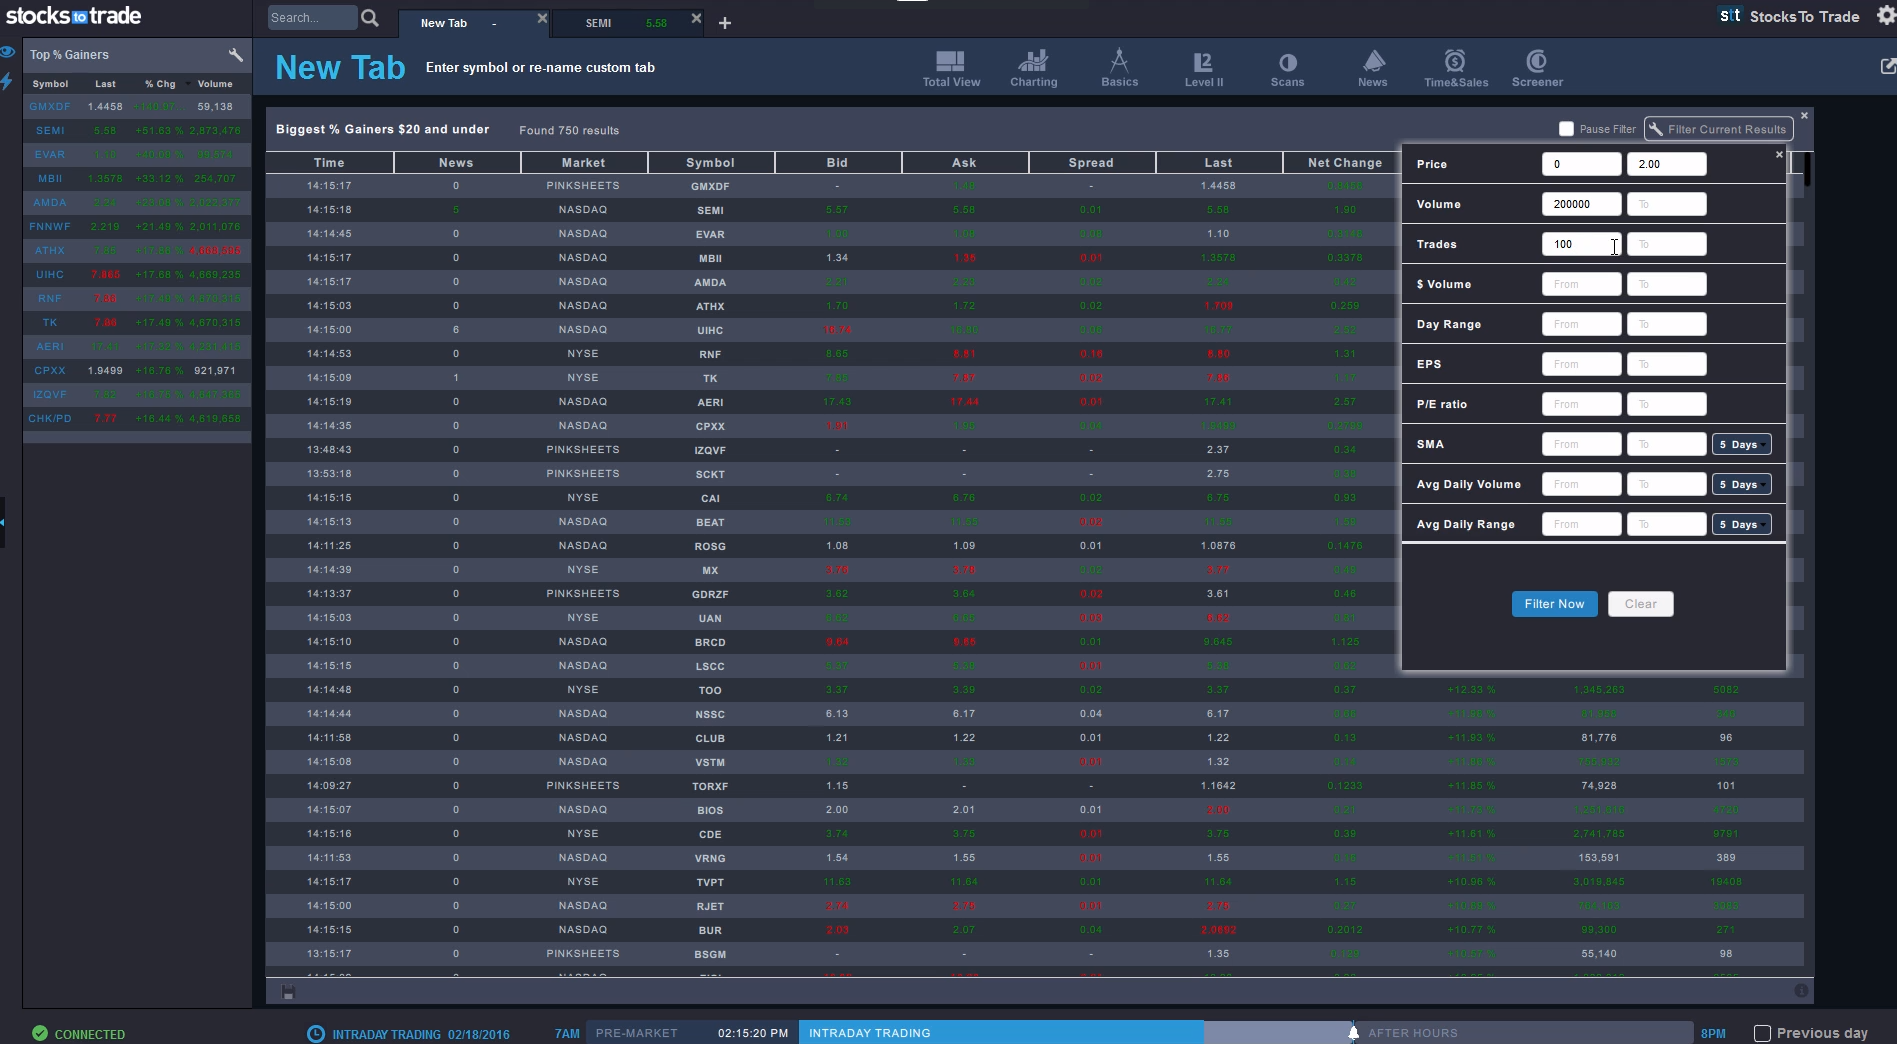
The comprehensive StocksToTrade scanning capabilities (Source: StocksToTrade.com)
A stock scanner can even alert you to the hottest action and the biggest moves in the market, by showing you things like the largest percent gainers for the previous day or stocks that suddenly increase in trading volume.
Using a stock scanner can help speed up your analysis process, allowing you to spend your precious time and energy on research, trading plans, and other trade details. Scanners are amazingly useful.
That’s why we’ve put so much work into the scanning capabilities of the StocksToTrade platform. With StocksToTrade, you can scan all U.S. stocks, including the pink sheets and OTC markets. It’s quick and simple to run a scan — absolutely no programming required!
You scan for almost limitless criteria: fundamental ratios, chart patterns, volume scans, technical indicators. Its all up to you, what you look for in each trade, and your trading style. You can even run your scans intraday, which can help you spot trade that’s ready to move. It’s all possible with our scanner.
Ready to start scanning? STT has just about every indicator you can think of. See why many of the world’s best stock traders start their day with StocksToTrade. Grab a 14-day trial for just $7 today!
Take Advantage of StocksToTrade Features
The markets are competitive, just like battle. Don’t be caught unarmed! Strengthen your strategy with the best tools available.
That’s exactly what the StocksToTrade platform is. Think of it as your fully equipped toolbox, helping you handle almost anything the market can throw at you.
We worked tirelessly to add in as many powerful features as possible, with a focus on elegant, easy-to-use design.
Here are just a few of the features included in the StocksToTrade platform:
- Ultra-quick, real-time connection to all U.S. equities for almost instant alerts.
- Powerful scans at the click of a button, to help you quickly and easily scan for your favorite criteria.
- Elegant charting abilities.
- The ability to build and maintain watchlists to help you track your go-to stocks and sectors.
- The ability to scan for news, SEC filings, and even social-media chatter in real time.
- Company profiles on each ticker to help you start your stock research.
- Streamlined paper trading features you can use to test strategies and develop skills without risking a cent.
There’s so much more on the StocksToTrade platform, too many features to list in this post.
But don’t just take our word for it. Take it for a spin! Get 14-day STT trial for just $7. Find out why so many top traders love us so much!
Conclusion
We hope by now you better understand and know how to use the EPS formula to analyze a stock.
This is a quick and simple formula — you just need a few numbers from the balance sheet. But, it can have an enormous impact on how you pick stocks to trade. How’s that for a risk/reward ratio?
Now, how about some homework? Pull up the financial reports for a few companies and practice calculating the EPS by using the formula in this post. Do it a few times to help you build confidence and familiarize yourself with the numbers and the process.
Once you have a handle on determining the EPS ratio, it’s time to research to help you learn more about the companies and your opportunities. Have we mentioned that a stock scanner can be a huge help here?
Seriously though, if you’re looking for stocks with a minimum EPS you could search all day, looking up balance sheets, using your calculator to work out the EPS ratio.
Or … you can click just a few buttons on StocksToTrade to run a scan and have a stunning list of stocks in under a minute. You just saved hours of work!
Not on board with StocksToTrade yet? See what a premium scanner can do for your daily stock analysis. Get a 14-day trial for $7 of STT now!
How often do you look at earnings per share? What are your go-to fundamentals for analyzing stocks? Tell us how you scan for stocks. Leave a comment below!