
Learning and testing different strategies is essential to your trading education…
There are plenty of ways to make money in the market — long, short, and options trading…
Add to those the number of different patterns and indicators traders use, and there are almost unlimited opportunities.
You just have to find what works for you and then hone in and refine it.
And different patterns and strategies make sense to different people…
So today I’m sharing some info from Bryce Tuohey’s SteadyTrade Team webinar last week.
See if his style of trading in Revlon, Inc. (NYSE: REV) and Inspira Technologies Oxy B.H.N. Ltd. (NASDAQ: IINN) makes sense to you…
Get in Bryce’s next live webinar here!
Table of Contents
The Trend Is Your Friend
Like me, Bryce loves to use VWAP. But he also incorporates a lot of trend lines into his trade ideas and plans.
As they say, the trend is your friend.
So here’s what that looks like for Bryce…
Learn how to analyze trends here.
How Bryce Uses Trend Lines In His Trade Ideas
On July 6, Bryce was watching REV and IINN for trend breakouts.
Here’s what each one looked like…
Revlon, Inc. (NYSE: REV)
REV had choppy price action as Bryce was watching it.
He took a position at around $6.25.
As Bryce sat through his trade, he didn’t love the level 2 action. But he noticed there were buyers soaking up the dips…
So even though it dipped below his lower trend line, he gave it some time and used $6.20 as his risk.
What Bryce liked about the pullbacks is that REV retested the lower trend line and VWAP and held support.
For Bryce, that’s a bullish sign. He says a failed bearish pattern is bullish.
So Bryce was looking for REV to push through $6.40 resistance and a retest of the $6.50 level.
He wasn’t sure it could break the high of the day because REV had already run for multiple days. And in Bryce’s eyes, that meant it was becoming a bit over extended. And shorts would probably be looking to enter and push it down at the HOD.
Check out Bryce’s trade on the chart…
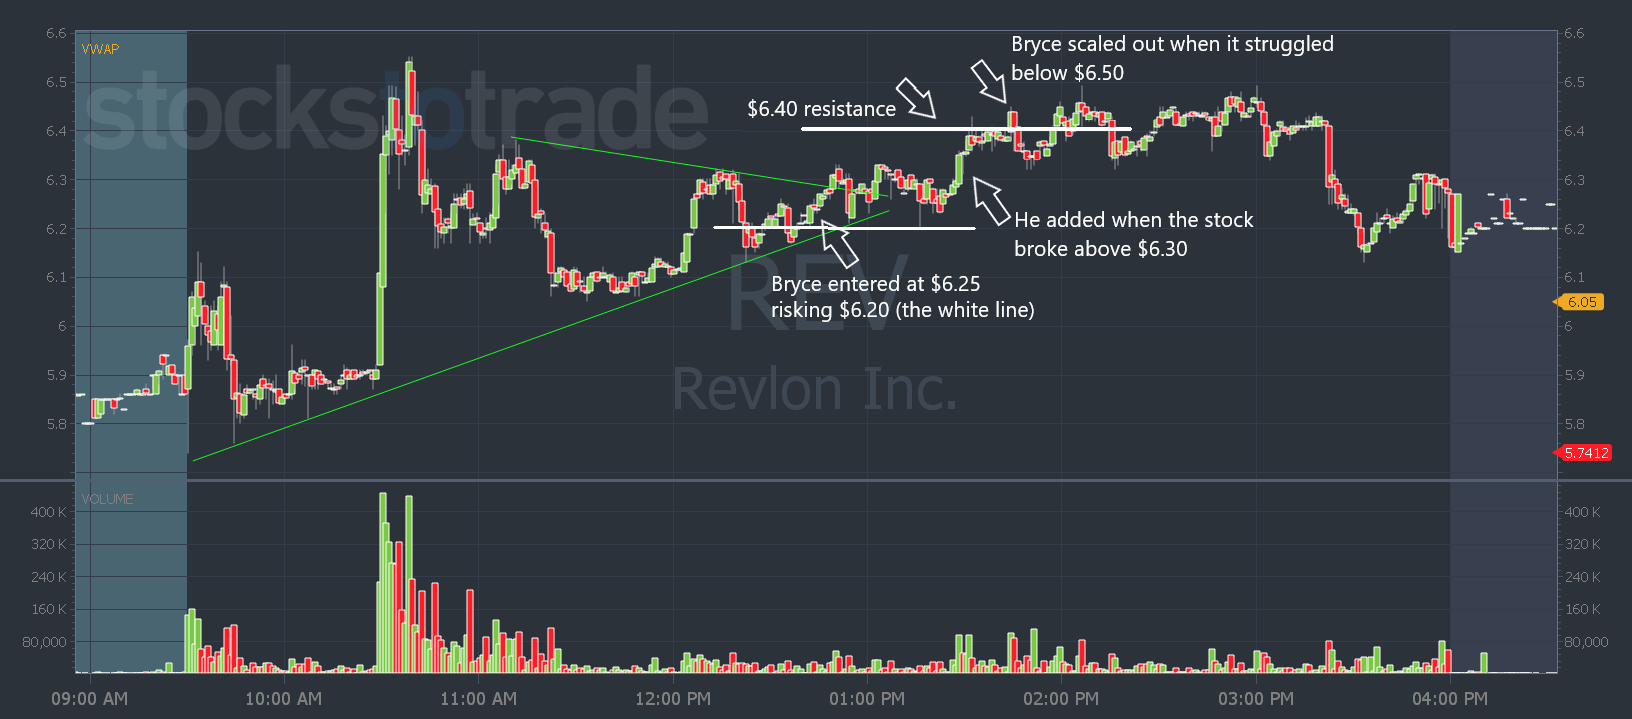
REV chart: July 6, 2022, 1-minute candle — courtesy of StocksToTrade.com
While Bryce was trading REV, he was also in IINN…
Inspira Technologies Oxy B.H.N. Ltd. (NASDAQ: IINN)
Bryce doesn’t play a lot of day one gappers. But IINN had cleaner price action than REV.
It was midday so he admits it wasn’t ideal. But his style is to take positions in setups he likes and wait for a potential push into power hour.
With IINN he was watching for volume to come through on a trend break and get a potential push through VWAP (not shown on the chart below).
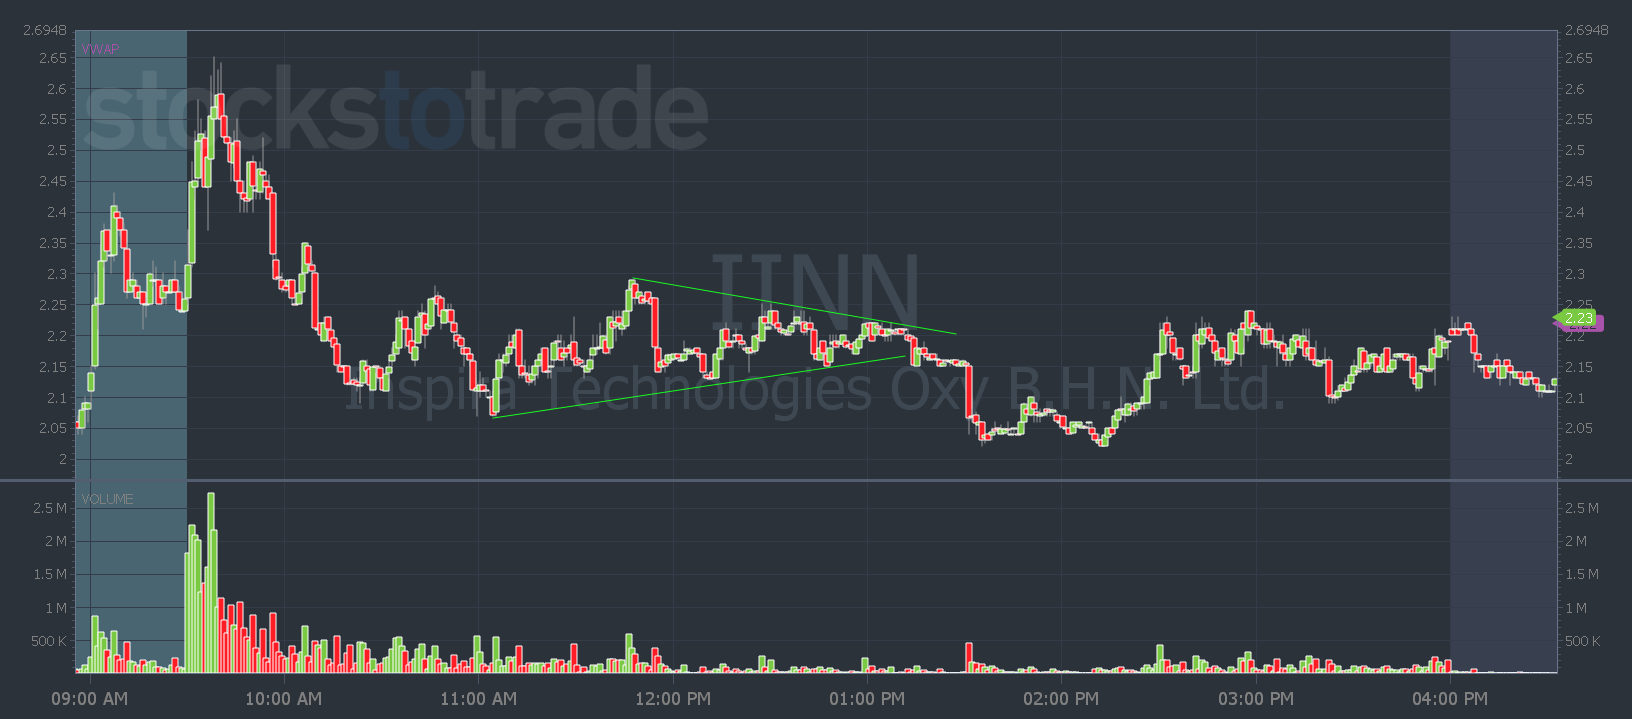
IINN chart: July 6, 2022, 1-minute candle — courtesy of StocksToTrade.com
Bryce cut his trade as it broke below the lower trend line. And as you can see above, it was the right decision as the stock continued lower.
You can see from the two charts that trend breaks and reversals can be a sign of where the stock is potentially headed next.
But there are multiple ways traders can draw lines to find trends. They can work on intraday charts and on long-term charts…
So, as Bryce says, it’s not an exact science. And you don’t get instant moves…
There are consolidation periods and fake-out moves. You just never know what can happen.
So make sure you combine your trend lines with other indicators like volume and VWAP.
If you want to learn more about how Bryce uses trendlines, his trades, and strategies — join the SteadyTrade Team. You’ll get access to all his weekly live webinars. Plus, they’re all archived.
Have a great Money Monday, everyone. I’ll see you back here tomorrow.
Tim Bohen
Lead Trainer, StocksToTrade