In the stock market, patterns repeat — and one of the most reliable is the dip and rip pattern.
Most traders don’t understand this part — patterns never repeat in the same way. History doesn’t repeat itself exactly … but it rhymes.
So rather than trying to memorize a pattern, it’s a smarter approach to understand its mechanics. The better your understanding of how a pattern works, the better you’ll be able to adapt when unexpected variations occur.
How do you begin to understand a stock pattern? That’s easy: study the pattern by observing when it plays out. Then break it down with some trading pattern analysis.
I talk about the dip and rip pattern a lot … recently, an incredible example of it came along that I wanna share.
DPW Holdings, Inc. (AMEX: DPW) was a picture-perfect example of the dip and rip … No joke, its chart could be pictured under the pattern’s dictionary definition, if it had one.
From premarket spiking to dip and rip realized, here’s an exploration of how this pattern plays out in real life … Follow along to learn and prepare for the next time an opportunity like this comes along!
Table of Contents
 What Is the Dip and Rip Pattern?
Unfamiliar with this pattern?
To really get the lowdown, you’ve gotta check out my in-depth post on the dip and rip. But for a quick refresher…
The dip and rip starts with a strong opening, followed by a brief dip right after the market open. That dip is quickly followed by a reclaim of the previous high, with room to grow from there.
The key to this pattern? Patience.
For me, the dip and rip is all about the entry at 9:45 a.m. Eastern. Waiting for about 15 minutes after the market open isn’t a method of torturing yourself. It’s about being disciplined enough to wait out the many traders who are stopped out at the open.
If you can buy on the dip and hold into the rip, you can potentially benefit from the pattern’s action if it plays out.
Of course, you’ve got to have the discipline to cut losses if it doesn’t work out the way you want. Like I said about patterns, they don’t play out the same way every time, and there are never any guarantees in the stock market. We’ll get into the dip and rip trading pattern analysis in a bit. But first…
A Quick Aside
It’s one thing to recognize a chart pattern, but what happens when you get scared during the trade? What happens when bad news comes out and you start justifying?
You’ve got to be mentally prepared for these challenges.
Kim Ann Curtin, one of the newest additions to the SteadyTrade Team, can help you develop the emotional intelligence necessary to stay level-headed in trades. (In case you missed it, we just rebranded StocksToTrade Pro to SteadyTrade Team — get the full scoop here.)
Kim originally came on the SteadyTrade podcast as a guest. Don’t miss this vital episode:
She has so much to offer that we brought her in the fold. Now, she’s offering regular webinars to the SteadyTrade Team to help you get smart about the emotional roadblocks that hold so many traders back.
Of course, Kim’s webinars are just one of the latest SteadyTrade Team offerings. As part of the team, you also get daily webinars, mentorship, access to chat, and plenty of other educational resources … Are you ready to join?
DPW: Trading Pattern Analysis of a Dip and Rip
It’s 9 a.m. Eastern. What’s the state of your watchlist?
Around 30 minutes before the market open on June 10, 2020, I was ready for action.
I was just starting my webinar, I had my iced coffee…
Long-time SteadyTrade Team members know of my disdain for air conditioning. I don’t turn it on in my home office … AC is for the weak! Sweat is weakness leaving the body!
Rant over. At 9 a.m., DPW was already on my radar. In a 48-minute webinar, I spent about 36 minutes talking about this ticker … Here’s how it went down.
9:03 a.m. — My Main Watch
Plenty was going on in the premarket. Runners a-plenty. Members were asking about all sorts of stocks in all sorts of sectors … APT. NIO. LAKE. Geez, Louise — so many tickers!
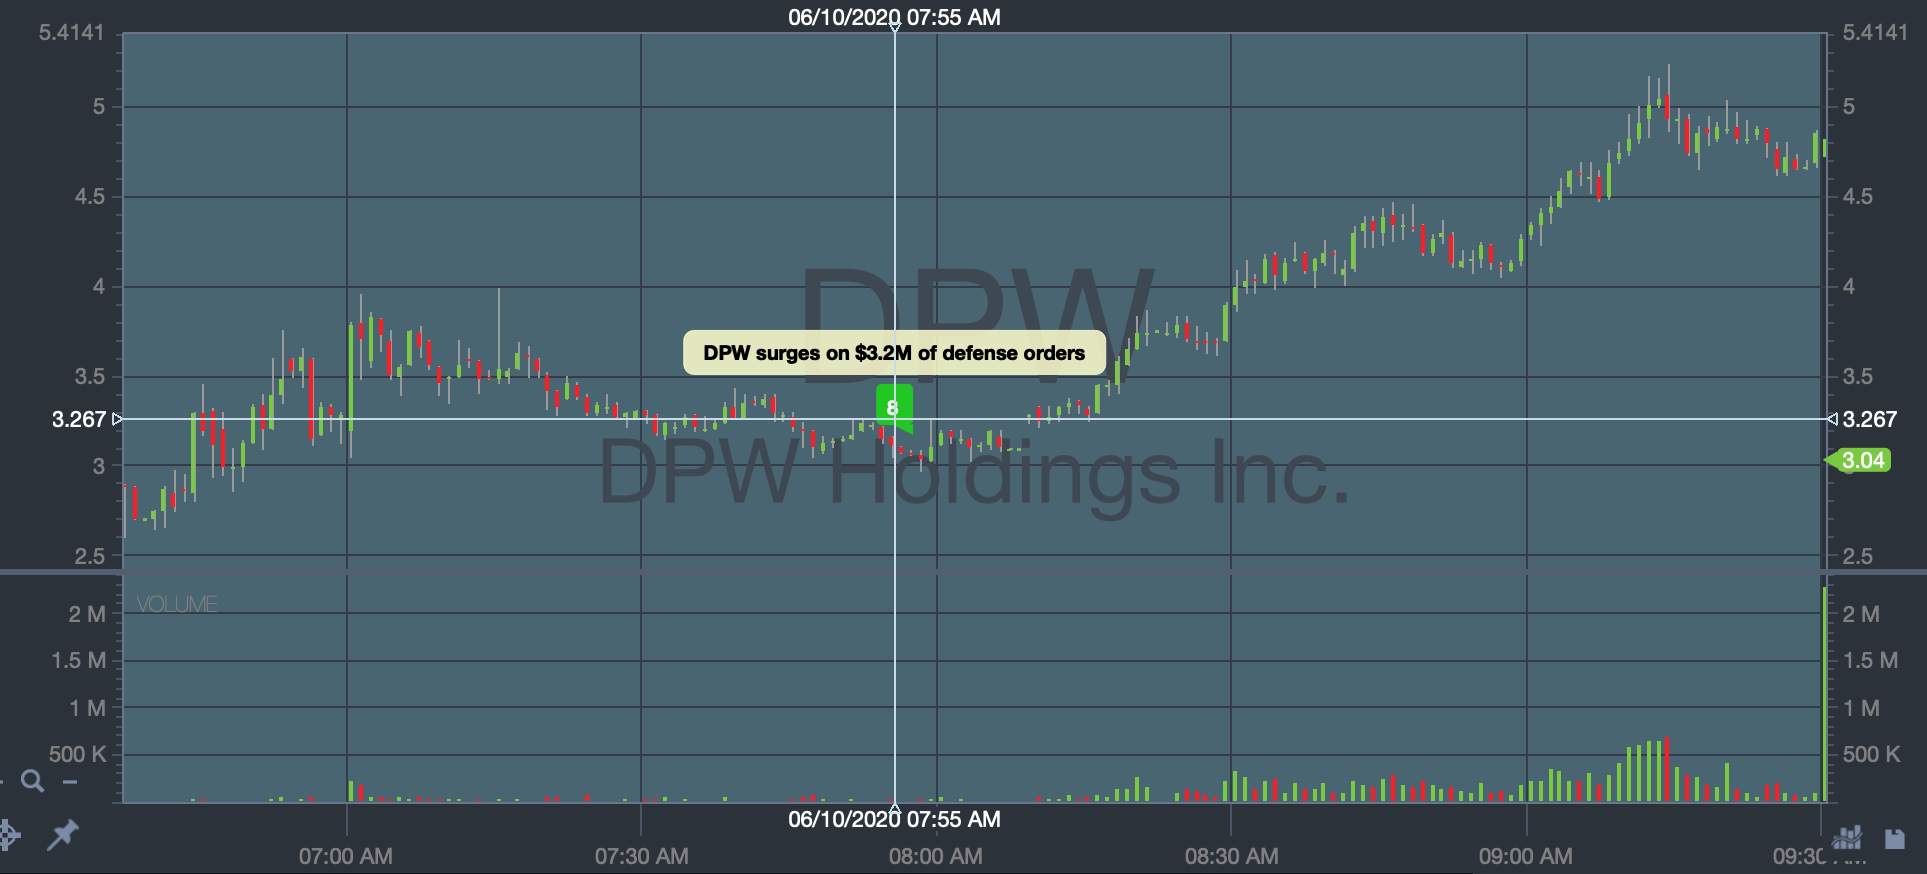
But I only had eyes for DPW. It was up on news, as you can see on the chart:
It just kept on going in the premarket, and I was hoping I’d get a dip and rip.
As of 9:03 a.m., it was my main watch. But as you know … I was gonna patiently wait until 9:45 a.m. Gaining isn’t good enough. It’s gotta prove itself.
I was also keeping my cool. I knew if it spiked too early, I could look for a late-day VWAP hold. No worry, no hurry — the whole trading day lay ahead.
Need a refresher on VWAP? Check out this video:
9:08 a.m. — Figuring Out Potential Entry and Exit
One of the SteadyTrade Team members asked how I’d figure out my exit point if I ended up getting in on the trade at 9:45 a.m.
Great question. Trouble was, it wasn’t something I could answer with any confidence at 9:08 a.m.
Why? Because there was no sign of DPW slowing down in the premarket.
When a stock is ripping to new highs in the premarket, it’s pretty much impossible to make a trading plan until closer to the market open. It’s hard to determine levels when you don’t even know the premarket high.
With the dip and rip setup, you need to know the premarket high or last night’s high.
It’s like if you wanted to figure out E = mc2 and not having the m. You need that variable to make the equation work.
You can probably tell from that comparison that I’m no mathematician. If you’re a high school math teacher, don’t yell at me.
The point is — that premarket high is an important variable. Without it, you can’t make a solid plan.
 The Perils of Premarket Trading
Once I started talking about premarket highs, another student asked if I had any lessons about premarket trading.
Well, I do — you can find them in my webinar archives, and I talk about it in this post.
But the short answer is that I don’t recommend it. Same goes for after-hours trading. Especially for new traders.
I know people in chat rooms will say, “hey, made a month’s salary before the market open.”
Well, I’ve been in this game for 15 years. I’ve seen thousands of traders come and go. What I have never seen, though, is anyone who’s been premarket trading with consistent profits over time.
Hey, maybe I’m wrong. Maybe you’ll be the one who will be consistently profitable.
But I have my doubts.
That said, all of the patterns we talk about are in play during the premarket. But the lack of liquidity makes it hard to play them.
So … trade in the premarket at your own risk!
9:26 a.m. — Timing Is Everything
Sure, you can (and should) start to assemble your watchlist in advance. But 9 a.m. is when you really start looking in earnest — especially in a volatile market like we’re in right now.
There are so many wild moves … so many of the patterns work best after 9:45 a.m. So why worry about the randomness of 9 a.m.?
Throughout the webinar, we were talking about plenty of plays … But I kept coming back to DPW.
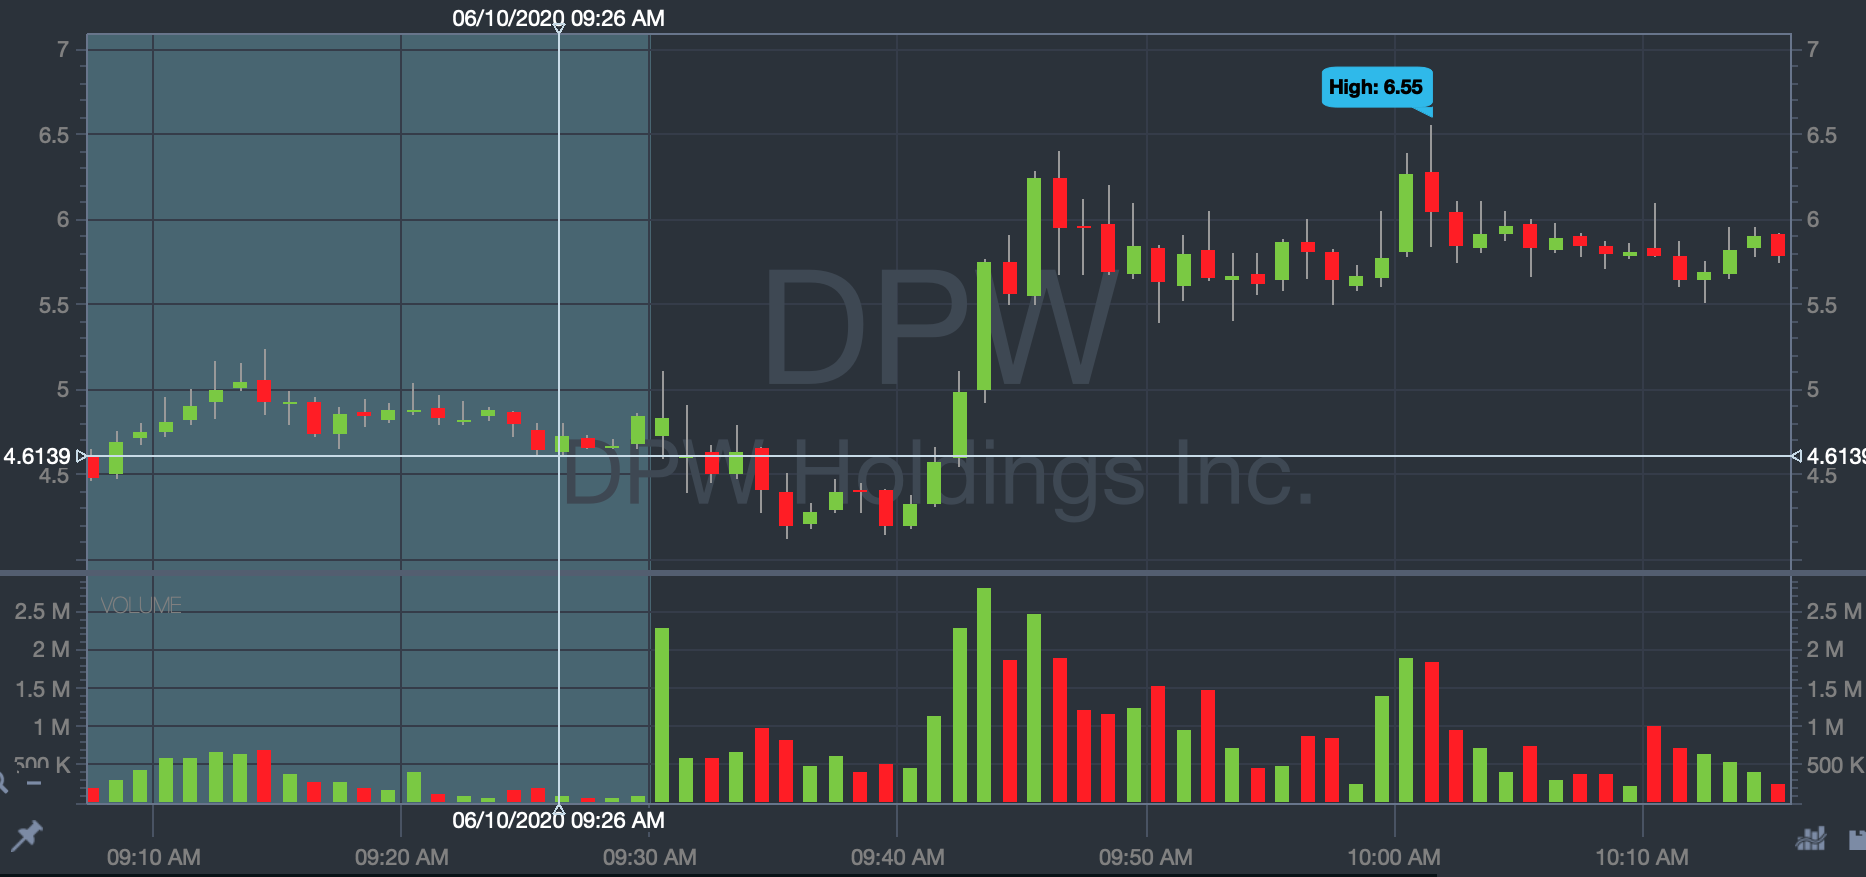
With the market open just around the corner, I felt more comfortable with a general plan for how a play like this might go, based on the chart:
So … if it broke out at $5, I might look at a risk level of about $4.50 and a goal of $6.50+.
Why a plan like that? It followed what the market was telling me, and I felt like $5 was a key point where shorts could panic.
9:35 a.m. — Here We Go
As the market opened, DPW did exactly what I wanted to see in the open…
By 9:35 a.m. it had traded 35 million shares.
With a stock like this, if it dies, it dies … But it was hanging out on SO much volume…
Even with the tempting distractions of $DGLY going green and $DUO getting halted, I’d chosen DPW and I was sticking with it.
When there are so many plays, you’ve gotta pick your favorites and stick with them. You can’t follow everything. If you try to, that’s usually when mistakes happen.
I try to lead by example, especially with a market like this. Focus is more important than ever.
9:40 a.m. — It’s Looking Good…
- Volume? 40 million shares.
- News? Yep, good catalyst.
- Breakout? Yep, multi-month.
… and I also felt confident that it was heavily shorted.
Still, I had to be OK if it broke down in the next five minutes … even if it meant that I missed out on other plays.
Remember: if you miss one trade, just wait another hour, another day, another few days. There will be another trade.
9:43 a.m. — Breakout Territory
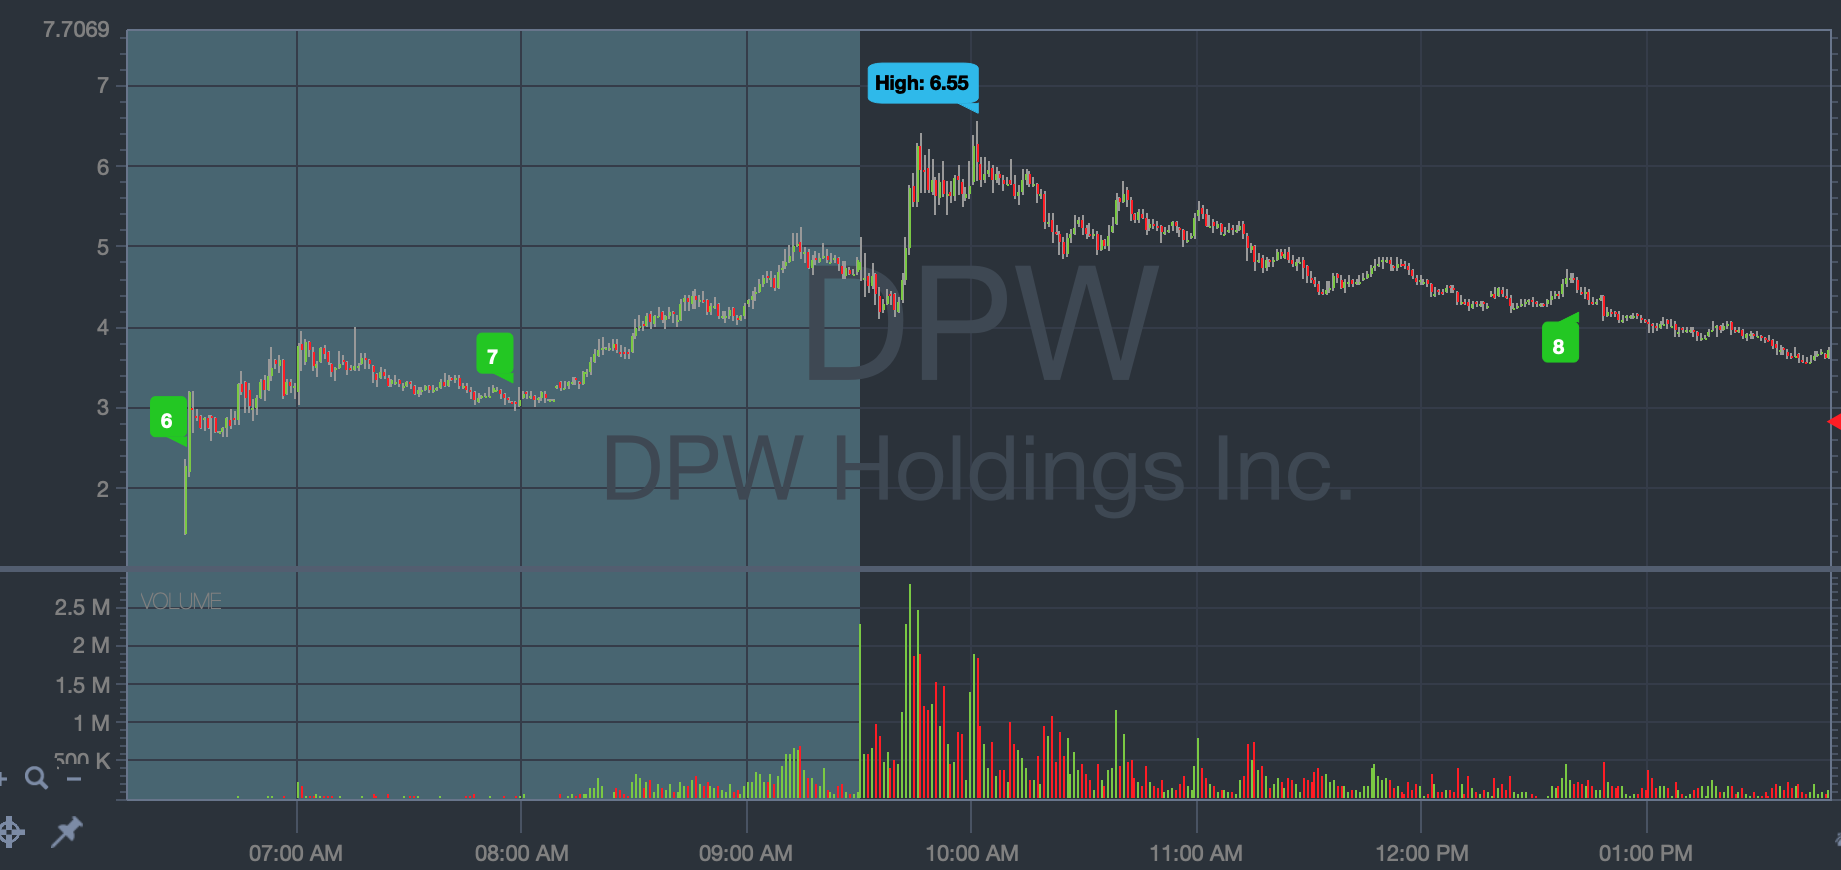
DPW soared above $5 just before 9:45 a.m. Volume went up to 54 million shares. It kept going, hitting an ultimate high of $6.55 at about 10 a.m. before starting to fade.
Dip and RIP, baby!
You might be thinking, ‘great, I missed this one.’
Doesn’t matter. Like I said, another dip and rip will come along. The point of this post is to demonstrate that if you’ve got a low-float stock with high volume, and you can wait till 9:45 a.m. … the dip and rip pattern CAN work.
Check out the entire cycle of this dip and rip:
It’s All About Knowing the Pattern and Trading Pattern Analysis
This was a pretty darned perfect example of a dip and rip pattern.
I’ll be honest: it doesn’t always play out so perfectly. I should also be upfront about this — there are no guarantees that these setups will work 100% of the time.
But do they work a significant amount of the time? Enough to make it worth learning them? Absolutely.
 As DPW showed so beautifully, that’s why it’s a great example for trading pattern analysis. This pattern CAN work. And if you’re prepared and focused, you can take advantage of it when it comes along…
In this insane market, I’ve seen this pattern sometimes three days out of every five! But remember, be patient. It’s all about that entry at 9:45 a.m.
With 40+ built-in scans, beautiful charts, news feeds, indicators, and so much more — StocksToTrade can help you find the stocks that fit your trading criteria. Take the full tour here and get your trial version here. See why so many top traders use the StocksToTrade platform every day. And check out this incredible new tool that traders can’t stop talking about. This can seriously change your trading day in the best way…
What do you think of this trading pattern analysis? What setups are working for you? Leave a comment!


