Getting stuck in a losing trade that you can’t get out of is every trader’s nightmare.
That’s why before you even consider putting on a trade, you need to consider how liquid the stock is.
So let’s examine what liquidity is and how to incorporate it into your trading plan…
Table of Contents
What is Stock Liquidity?
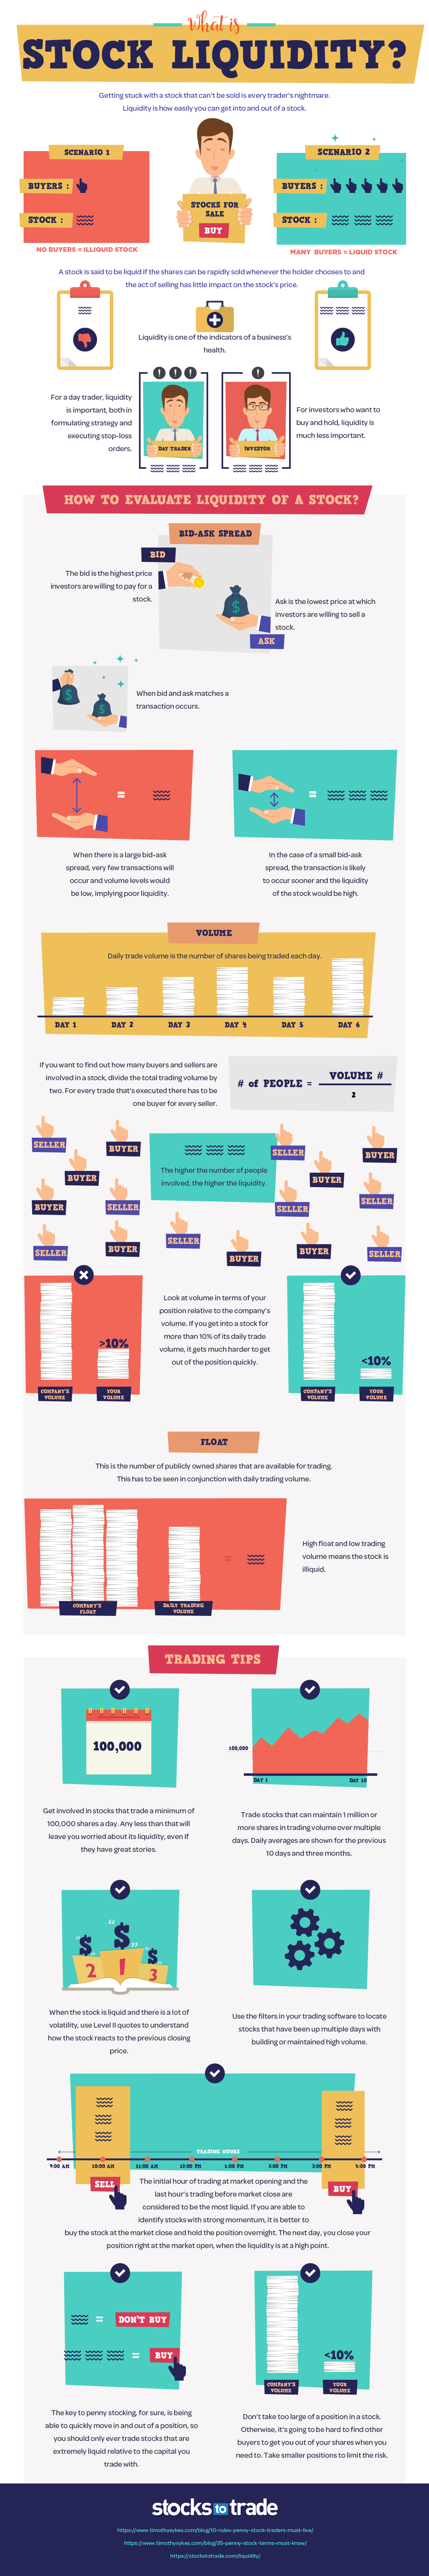
Liquidity is how easy you can get into and out of a stock. A liquid stock is one that has enough buyers and sellers on the bid and offer, so when you want to enter or exit your trade, you’ll always get a decent fill, without the price running off on you.
For a day trader or swing traders, liquidity is hugely important. These short-term traders are often dealing with only small moves in price, so they need their orders to be filled as close to their desired prices as possible — it can mean the difference between a losing day or a profitable day.
For longer-term traders or investors, liquidity is much less of an issue. Since they’re looking to be in the trade for a longer time, they can often afford to sit on the bid or offer of an illiquid, waiting for new buyers or sellers to eventually show up.
To get a close-up view of liquidity in a stock, you can look at the Level 2 stock quotes, where you’ll be able to see a current list of the highest bid and lowest offer prices and their corresponding volume amounts.
Download a PDF version of this post as PDF.
How Do You Evaluate the Liquidity of a Stock?
Now that we’re clear what liquidity in a stock is and why it’s important, let’s delve into a few ways to get an idea of how liquid a stock is.
Bid-Ask Spread
The bid is the highest price any trader currently has an order to buy. The ask is the lowest price any trader currently has an order to sell.
The difference between these two prices is referred to as the bid-ask spread.
An example of this may be a stock that is bid for $20.10 and offered at $20.20, this would mean there’s a bid-ask spread of 10 cents.
When the bid-ask spread is very tight, it implies that there are both buyers and sellers eager to get trades done and they’re competing with others for order flow, tightening the bid-ask spread.
When the bid-ask spread is much wider, it shows that there aren’t many traders eager to get transactions done. This means it may be hard to get in or out of your position without pushing the price up or down too much.
Volume
Daily trading volume is the number of shares being traded each day.
It’s perhaps the most straightforward way to determine the liquidity of a stock, but it’s important to consider it in conjunction with the price of the stock.
For instance, a $10 stock may have traded an average of 1 million shares per day, for the past two weeks. This means that average daily turnover would be $10 million.
A smaller penny stock with a price of 10 cents may average 3 million shares per day, but the average daily turnover would be much lower at $300,000.
When considering the trading volume before making a trade, you need to ask a few questions, such as:
- Is current volume expected to remain at this level? Perhaps there have been some corporate events that have temporarily increased the trading volume.
- Can the stock handle my position size? For a short-term trader, as a rule of thumb, you want to be much less than 10% of the daily turnover. If you’re too big, you could easily get yourself in the situation where you have no one to buy or sell to you when you really need it.
Float
The float of a stock refers to how many shares are available for the public to trade.
For instance, the founding team of a company may currently hold 80% of all shares, leaving 20% of all shares available to be actively traded. This is an example of a low-float stock.
A stock having a lower float means that there are fewer shares to be actively traded, often resulting in lower liquidity.
A low-float stock is often more volatile as it takes less buying or selling power to push the price around, due to the stock being less liquid.
When analyzing the liquidity of a stock, consider how much stock is held by company insiders and entities associated with them (investment banks, family, private equity firms, etc).
Want to check how much of a stock is held by company insiders? StocksToTrade makes it easy for you to get all the most up-to-date SEC filings.
Trading Tips
- Look for stocks that trade a minimum of 100,000 shares per day. Any less than that and you could see the order flow dry up at the exact time you need it most (when your stop or profit targets are hit).
- Scan, scan, scan. Use the filters on your trading platform to scan for stocks that have made price moves for multiple days with consistently high volume, or at least have increasing volume.
- Consider trades in stocks where your position size is small compared to the average daily turnover. You want to be quick and nimble compared to your competition, not the elephant in the room.
- The first and last hours of trading each day are where you can expect the most liquidity. If you’re excited to get a trade on, try to get it done just after the market opens or you might have to wait until it’s almost closing time for liquidity to pick back up.
- No matter how good a pattern or a trade looks, if the stock liquidity isn’t what you need it to be, stay away. Your trade may look amazing initially, but could effectively be a mirage, as you won’t be able to get any of your orders filled, which could result in frustration or even losses.
The Final Word
Now you know what liquidity in a stock is and why it matters.
Analyzing liquidity may not be as exciting as looking for your favorite chart patterns (like the Dead Cat Bounce), but it’s a crucial part of managing your risk and ensuring you can always get filled at good prices.
It’s true that liquidity matters more for traders with larger accounts and position sizes.
But, if you’re just starting out, you should definitely get yourself in the habit of keeping an eye on a stock’s liquidity, as you’ll develop a feel for the market and prepare yourself for potentially trading larger sizes after you’ve built your account up!
For help finding the hottest liquid stocks, check out StockToTrade Pro. Lead trainer Tim Bohen live-streams the market open every day — and you’re invited to join him. Build a watchlist and prepare a trading plan alongside Tim every day. He also streams the market close so you can exit positions and build a trading plan for the next day!
Have you ever had liquidity disappear while you were in a trade? What happened? Share your story below.