Are you looking for a way to quickly work out if a stock is trending up, down, or moving sideways? Ready to learn a few tricks for spotting those big trend moves?
You’re in luck — moving averages can help you with just that.
Moving averages are a simple but powerful tool that can help you smooth out a stock price. It can help you gain insight into trends and general price behavior.
You’ve probably heard of moving averages, but do you know how to use them? This post will help get you up to speed.
Download the key points of this post as a PDF
Table of Contents
What Is a Moving Average?
First, let’s make sure you know exactly what a moving average is …
A moving average (MA) is a type of technical indicator that can be helpful in determining trends (or lack of) in a stock.
MAs work by averaging the prices for a set time period, for example, 10 days.
After you calculate the average price, you plot the moving average on a chart. Then you can recalculate (and replot) each day. What you end up with is a simple line that loosely follows a stock’s trend.
The Types of Moving Averages
Before you get to plotting an MA on your chart, it’s important to know the difference between the major types of moving averages.
The two major types are the simple moving average and the exponential moving average. They look pretty similar on a chart, but each has some distinct advantages and disadvantages.
Let’s take a closer look …
Simple Moving Averages (SMA)

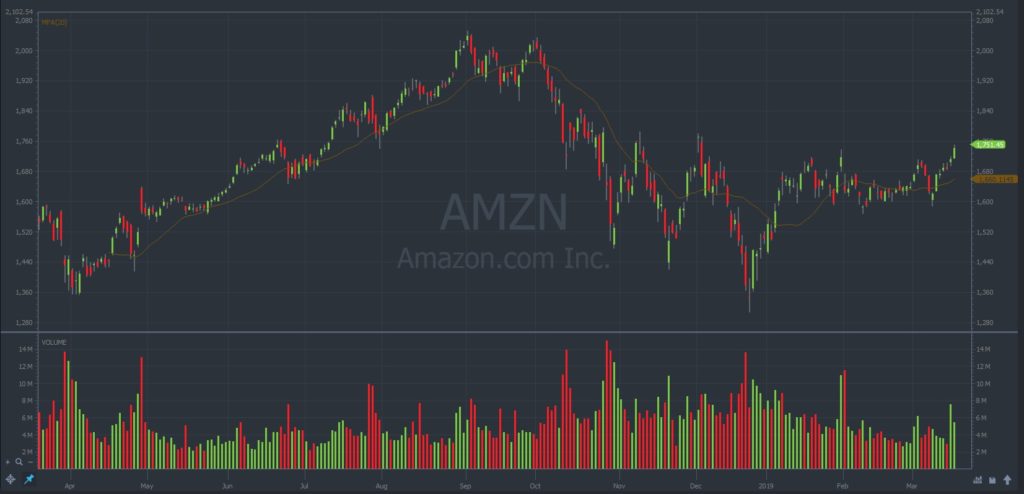
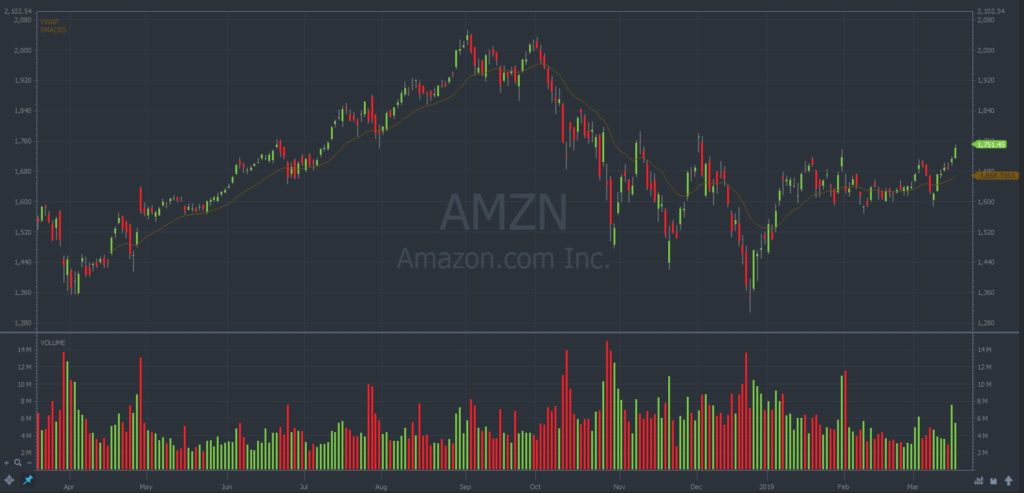
Amazon (NASDAQ:AMZN) Chart showing the 200-day SMA. (Source:StocksToTrade.com)
The simple moving average (SMA) is the most basic MA to calculate. It’s simply the mean of a set time period. That time period could be 10 minutes, 5 days, or 10 years.
Here’s a quick refresher on averages (in case you missed that day in math class): Tally all the prices you want to average, then divide them by the number of prices that you’re averaging.
Exponential Moving Averages (EMA)
Now let’s move on to the exponential moving average (EMA), which gets a little more tricky.
The EMA uses a somewhat involved math formula to place more weight in the more recent prices.
For example, if you’re calculating a 10-day EMA, the 10th-day price will have more weight and affect the EMA more than the first-day price.
This weighting effect essentially speeds up the indicator when it comes to explosive price moves. If a stock is in an uptrend, then suddenly starts to collapse, the EMA will pick up this trend change quicker than the SMA. But, be warned, this comes at a risk of getting more false trade signals.
What Can Moving Averages Tell You?
At its most basic, a MA can tell you which way a stock is trending. If the MA is facing upward and the price is consistently staying above the MA, then it can be fair to assume the stock’s in an uptrend.
Moving averages aren’t just about trend analysis, though. You can use a MA to tell you if a stock isn’t in an uptrend. A way to do this is by looking at multiple moving averages, let’s say the 20-day and 50-day. If the moving averages are bouncing up and down, with each one consistently crossing over, you can usually assume the stock is in a price range (not trending).
Traders also commonly use the MA as a basic frame of reference on a chart. They don’t always take trade signals from the MA, but they usually have a few plotted on their charts. It can be a quick way to eyeball a chart to help determine a recent trend and momentum. If they like what they see, they can then delve further into analyzing the chart.
How to Calculate Moving Averages
Warning: Another math lesson us coming right up! Don’t worry, we’ll keep it as simple as possible.
Let’s look at how to calculate both the SMA and EMA. Your charting platform will probably do it automatically for you, but it’s always good to know how things work under the hood.
First, we’ll tackle the simple moving average. Let’s calculate a 10-day moving average.
Say that for the previous 10 days, the closing stock prices are $1, $2, $3, $4, $5, $6, $7, $8, $9, and $10. Yep, it gains $1 each day.
To calculate the MA number, add all of the prices: $1 + $2 + $3 + $4 + $5 + $6 + $7 + $8 +$9 +$10 = $55. Then divide the total by the number of prices in the sample, which is 10.
$55 divided by 10 means that the current SMA level is $5.50. The price is well above that — looks like this stock is currently in an uptrend!
Now, let’s check out the exponential moving average calculation. This one’s a little more complex. When calculating the EMA, you first need the SMA number. Let’s use the above example where the SMA is $5.50.
Here’s where it can be tricky. You need to calculate the multiplier so the EMA weights the recent prices more than older prices.
Here’s the formula:
2 ÷ (selected time period + 1)] = [2 ÷ (10 + 1)] = 0.1818 (18.18%)
So, we now know the SMA is 5.5 and the multiplier is 0.1818
Next, we punch all the data into the EMA formula:
EMA = Price(t) x k + EMA(y) x (1-k)
Here’s what the letters in the formula mean:
- t = today
- y = yesterday
- N = number of days for the EMA
- k = 2 ÷ (N+1)
What you see in this calculation is that the 10th day has a price weighting of just over 18%, while the 10th day would be weighted at 10% with the SMA.
Are you keeping up? There’s a quiz later. We’re kidding. But seriously, don’t stress over this stuff, because traders don’t really need to calculate MAs anymore — a charting platform can do it for you.
If you don’t have a charting platform yet, check out the top-of-the-line charting on the StocksToTrade platform. Grab a 7-day trial for just $7.
How to Plot Moving Averages
Since almost everyone uses modern charting packages that plot MAs automatically, it’s not so important to know how to plot one manually. But there are some people who like to keep hand-drawn charts, so let’s take a quick look at how to plot a MA.
Let’s assume you have a bar (or candle) chart drawn up with all the correct prices, and you calculated that day’s specific moving average. In this example, let’s say that the day’s closing price is 100, and the moving average price is 98. You simply mark the level at 98, then draw a line from the previous day’s MA level.
In time, you’ll have a consistent MA line overlaid on the chart. It can be tedious to keep up with this, but it’s definitely simple.
Using Moving Averages for Forecasting
If you’re plotting a moving average on your chart, you’re probably doing so to get some insight into a stock’s possible future movements. So, let’s run through some basic ways to determine trading signals and insight from MAs.
Once you plot your MA, it’s wise to consider whether the price is currently above or below the MA. This can give you some idea as to the very recent price momentum.
Next, you can look at which direction the MA is facing — upward or downward (or even dead flat). This can tell you the overall trend in that time period, but be sure to look for some further confirmation such as swing highs and lows on the chart.
Another thing you might do is to plot two or more moving averages. When the faster-moving average (e.g., 10-day) crosses above the slower moving average (e.g., 50-day), you can start looking for reasons to buy the stock. The crossover implies that recent price behavior is bullish compared to the longer time period.
It’s not just about buying or selling when the price starts to move — you can also use MAs to trade pullbacks. A pullback is when a stock makes a solid move, then pulls back a little, before continuing its overall trend. It’s common for traders to find trade signals when a stock pulls back to a significant MA.
There are lots of ways you can use MAs. Use the indicator however you determine it works best for you. Just make sure to backtest and paper trade it first to help you build confidence in your strategy.
The Most Common Moving Averages for Traders
By now you’re probably thinking, “Enough with the math lessons! Give me some dang MAs to plot!”
Here’s the thing: No one can tell you which MAs to use. There’s no right or wrong answer. But for traders, there are some MA settings that are more popular than others.
The 200-day moving average placed on an end-of-day stock chart might be the king of MAs. With approximately 200 trading days in each year, this moving average gives the overall yearly trend of a stock and is watched by a huge percentage of the stock market community.
Stepping down in a timeframe, the 20-day moving average is commonly used. There are roughly 20 trading days in a month, so traders use this as a way to gauge the recent month’s price behavior of a stock.
It may seem odd, but the 9-period and 18-period EMAs can also be common among traders. This can be for short-term charts (1-minute or 5-minute) or even daily and weekly charts.
There’s a reason for the 9-period and 18-period combination. It’s due to a classical technical analysis book from the early part of the 20th century that extols the virtues of this MA combination. If a lot of traders are watching that specific combination, it may be a good idea to keep an eye on it, as it can give you insight into the psychology of other traders.

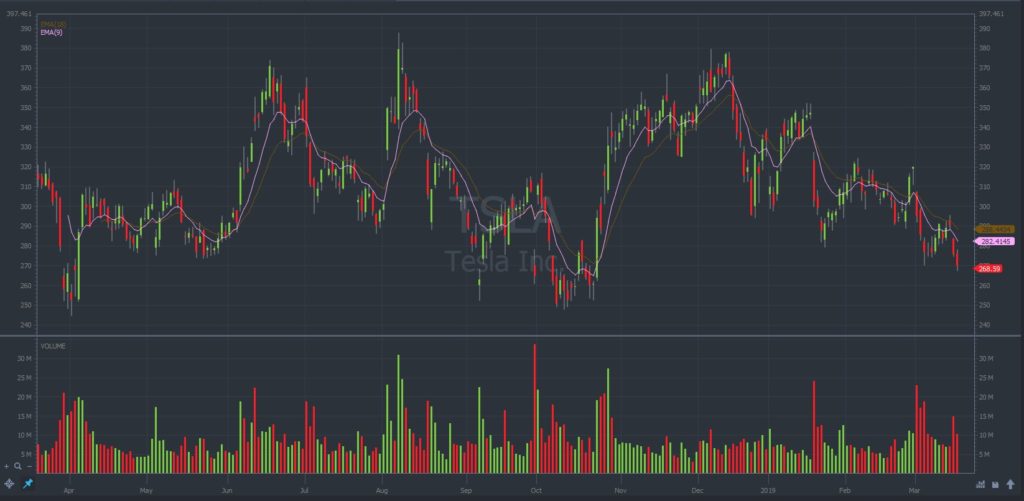
Tesla (NASDAQ:TSLA) with a 9- and 18-day EMA combination. (Source:StocksToTrade.com)
Those are some common MAs, but again, you need to experiment. Mix and match to find what works for you. Play around with your charting platform. Try changing the MA settings and look for specific settings that stand out to you. Then, of course, paper trade those settings before you risk a cent!
If you don’t have adequate charting or an easy way to paper trade, StocksToTrade can help you. Our platform has top-of-the-line, user-friendly charting and paper trading capabilities. See for yourself … get a 7-day trial of StocksToTrade for just $7!
Take Advantage of StocksToTrade Features
Does it sound like it’s time to bust out your new knowledge of moving averages and start looking at some charts? MAs are so common that most charting packages probably offer them.
But … you could probably use more tools to help you find trades that fit YOUR strategy and criteria …
What tools? Check out some of the features included in the StocksToTrade platform.
- The ability to scan for specific trading criteria of just about every stock in the U.S., including those on the Nasdaq, NYSE, and OTC markets — and even pink sheets.
- Premium, ultra-modern charting. Clean, simple and powerful.
- Want to find stock market hype when it’s happening? Use STT’s advanced scanning for news stories, SEC filings, or even Twitter mentions to help you stay informed!
- Want to test a strategy without risking a cent? Check out the paper trading feature. We make it easy to help you learn how to use the platform and get plenty of practice before you start live trading.
There’s more. A lot more. Check out this list of features. See? We told you there’s a lot more.
StocksToTrade is a world-class trading platform for the U.S. stock market. It wasn’t built by a bunch of accountants or marketers just looking for a product to sell — we’re real-world traders, and we created the exact platform we were looking for to help us in all the right ways, every single trading day.
Ready to Start Trend-Spotting?
We hope you now have a solid grasp of the ins and outs of using MAs.
Make sure to think through which type of MA and timeframe you’ll use. If you use settings that are too quick, you can get false signals. Too slow, and you can risk missing trading opportunities.
The next step: Load up your charting platform and try out a bunch of different MA settings. Remember, you can learn this without risking a cent — start out with some paper trading first while you get better acquainted with MAs, then when you’re ready to take it to the next level, dive in.
Which moving average settings work best for your trading setup? Please leave a comment below and share.

