
The average true range won’t tell you when to go long or short in trades … It doesn’t even care what your bias in the market is.
What the average true range is all about? Market volatility. If you’ve been watching the markets in 2020, you know just how volatile they’ve been.
Were you able to spot momentum in time to take advantage of all the insane moves?
If not, good news! The average true range indicator can help you do that and more.
Read on to learn how you can navigate the ins and outs of the average true range and use this trading indicator in real time.
Let’s get to it.
Table of Contents
- 1 What Is the Average True Range?
- 2 How Does the Average True Range Work?
- 3 What Is Average True Range Used For?
- 4 How to Calculate ATR
- 5 Average True Range and Stop Loss
- 6 How to Read Average True Range in Forex
- 7 How to Trade Using ATR
- 8 Examples of How to Use the Average True Range in Trading
- 8.1 Kaixin Auto Holdings. (NASDAQ: KXIN)
- 8.2 SPI Energy Co. Ltd. (NASDAQ: SPI)
- 8.3 Tesla Inc. (NASDAQ: TSLA)
- 9 How to Use Average True Range Indicators to Find Breakout Trades Early
- 10 How to Use the Average True Range Indicator to Find Trends
- 11 How to Find a Stock’s ATR on StocksToTrade
- 12 Disadvantages and Limitations of Average True Range
- 13 Conclusion
What Is the Average True Range?
The average true range (ATR) can be a powerful technical analysis tool. You’ll see it featured in the book “New Concepts of Trading” by J. Wells Wilder.
ATR is a trading indicator that measures market volatility. It then averages this volatility over a stock’s price range for a specified period.
The ATR takes into account gaps up and down often seen in stocks. It helps capture “missing” volatility between daily stock movements.
(As an Amazon Associate, we earn from qualifying purchases.)
Absolute ATR
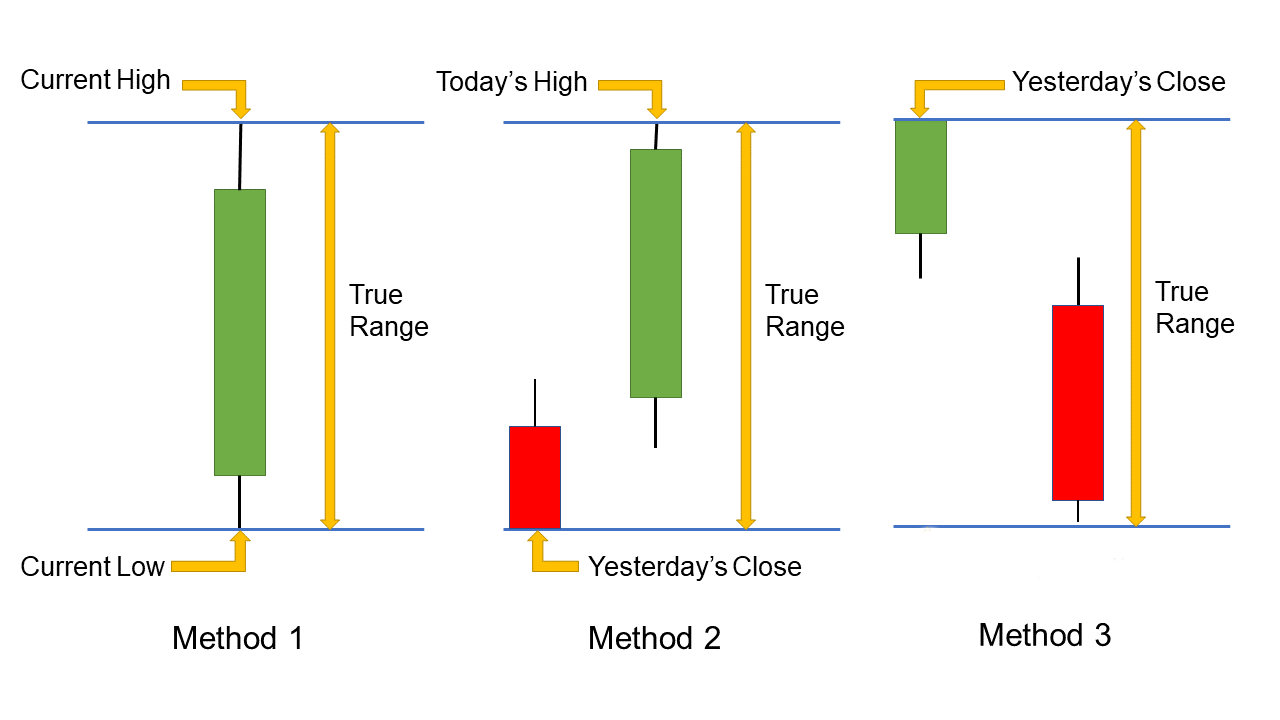
A stock’s true range serves as the basis for the average true range. You can spot true range by studying candlesticks on a chart.
I say it all the time … You gotta study charts till your eyes bleed. It’s an exaggeration, I know. But charts provide a ton of information.
You can use these three methods to determine the true range of candlesticks:
1) Subtract the current low from the current high.
2) Take the current high and subtract the previous close.
3) Subtract the previous close from the current low.
Methods two and three account for gaps and inside days in price action. You can see this in the image below.
© 2020 StocksToTrade.com
How Does the Average True Range Work?
It looks at a stock’s true range and averages it over a set period of time.
Again, the ATR is a volatility measurement tool. Volatility comes in the form of momentum.
This indicates lots of buying or selling pressure behind an asset or stock. Smaller candles on a chart are periods of consolidation where the stock isn’t as volatile.
A rising ATR shows you a stock is moving and that there’s strength coming into the move. But it won’t show you the direction of the move.
What Is Average True Range Used For?
This indicator shows increasing volatility. Traders need stocks to be volatile to find potential trades and help make calculated trading decisions.
The ATR can signal if volatility is present and strong enough for a trend to potentially form.
The ATR can also help in identifying where to set stops and price targets. Of course, that has to be within your trading plan and overall strategy.
But you can’t really use it for buy or sell signals.
How to Calculate ATR
To calculate the average true range, take the true range and average it over a set time frame. Remember, the true range is the highs minus the lows.
The time frame many traders tend to use the most is a period of 14 days. You can use shorter periods. It all depends on how you trade.
Calculate Volatility With Average True Range
Changes within the average true range show a change in volatility. You’ll see this with a sharp rise and fall in price action.
A new reading of the average true range will calculate each time a period passes.
Given this, it’s like an exponential or simple moving average indicator. For example, a one-minute chart would calculate a one-minute change in the average true range.
Average True Range and Stop Loss
You’ll often hear me say that you need a trading plan in place before taking any position.
One of the most important parts of any trading plan is your stop loss. You gotta know what your stop is.
The average true range can help identify where to place your stop with a multiplier of the ATR. This multiplier can be 2%, 10%, or 20% of the average true range. This depends on your goals and risk tolerance.
Keep in mind that placing a stop loss may not trigger in full at your price point. That’s what we call slippage.
Any successful trading plan always comes down to risk management.
What Is a Stop Loss?
A stop loss is an order you place with your broker to sell a stock or asset at a specified price point.
The goal is to limit your loss on a trade in the event of an unexpected move in price.
There’s not a trader around who trades with 100% accuracy. You will be wrong at times. But how you manage the trades when you’re wrong is key. And stops can help you do that.
The most popular stops traders use include mental stops and stop-limit orders. Check out this video for more on how to use stops to protect your assets:
How to Use the Average True Range for Stop Loss
As a trader, it’s smart to seek out tools that can help you separate your emotions from trading decisions. I think the ATR is a tool that can help you with this.
It’s critical to keep your ego and emotions in check as you decide how much to risk and when to cut losses.
That’s where the ATR indicator and stops can help you.
A big issue a lot of new traders struggle with is getting stopped out too soon. Then minutes later, they watch in agony as the stock grinds back into action.
The solution? Setting smarter stops. The average true range can help you find a level that’s outside the normal range of volatility.
How to Read Average True Range in Forex
The foreign exchange market (forex) is where national currencies trade in pairs.
The forex market trades with “pips” — that stands for percentage in profit. A pip measures the amount of change in the exchange rate of a currency pair.
The ATR works the same way as it does on other markets and platforms. The main difference is that volatility is measured in pips.
Inside the SteadyTrade Team community, we trade on the U.S. markets but love talking about all things market-related. Looking to expand your trading network and knowledge? Come join our SteadyTrade Team for daily webinars, live chat, and mentorship today!
How to Trade Using ATR
Now let’s check out some strategies that can help you trade using the average true range.
Determine a Profit Target
There are many ways you can set profit targets in trading.
You should know that the average true range doesn’t account for buy and sell signals or imply in which direction the stock is moving.
But a rising ATR can suggest that there’s momentum coming into the stock. And you can look at the average true range indicator value to set your profit target.
But remember, the potential for profit doesn’t outweigh risk. Always trade according to your personal risk/reward ratio.
Chandelier Exit
The chandelier exit is another strategy based on the average true range. The chandelier exit uses the ATR to set a trailing stop order.
This can potentially help you manage the risk of getting stopped out too early. It’s designed to help you avoid exiting the trade on a temporary reversal in price action.
The chandler exit strategy allows you to set small trailing stops to exit trades near the tops of price moves and potentially improve profit targets.
Swing Trading
Swing trades last longer than day trades. You can hold a swing trade for a few days, weeks, or maybe even months.
In swing trading, the average true range can help capture fluctuations in volatility. So, again, you can use the ATR to set smarter stops so you potentially stay in the trade according to your plan. The range you set will depend on your risk, the stock, and market volatility. Be sure to do your research.
Examples of How to Use the Average True Range in Trading
The average true range indicator can help you identify volatility. Let’s look at some examples…
Kaixin Auto Holdings. (NASDAQ: KXIN)
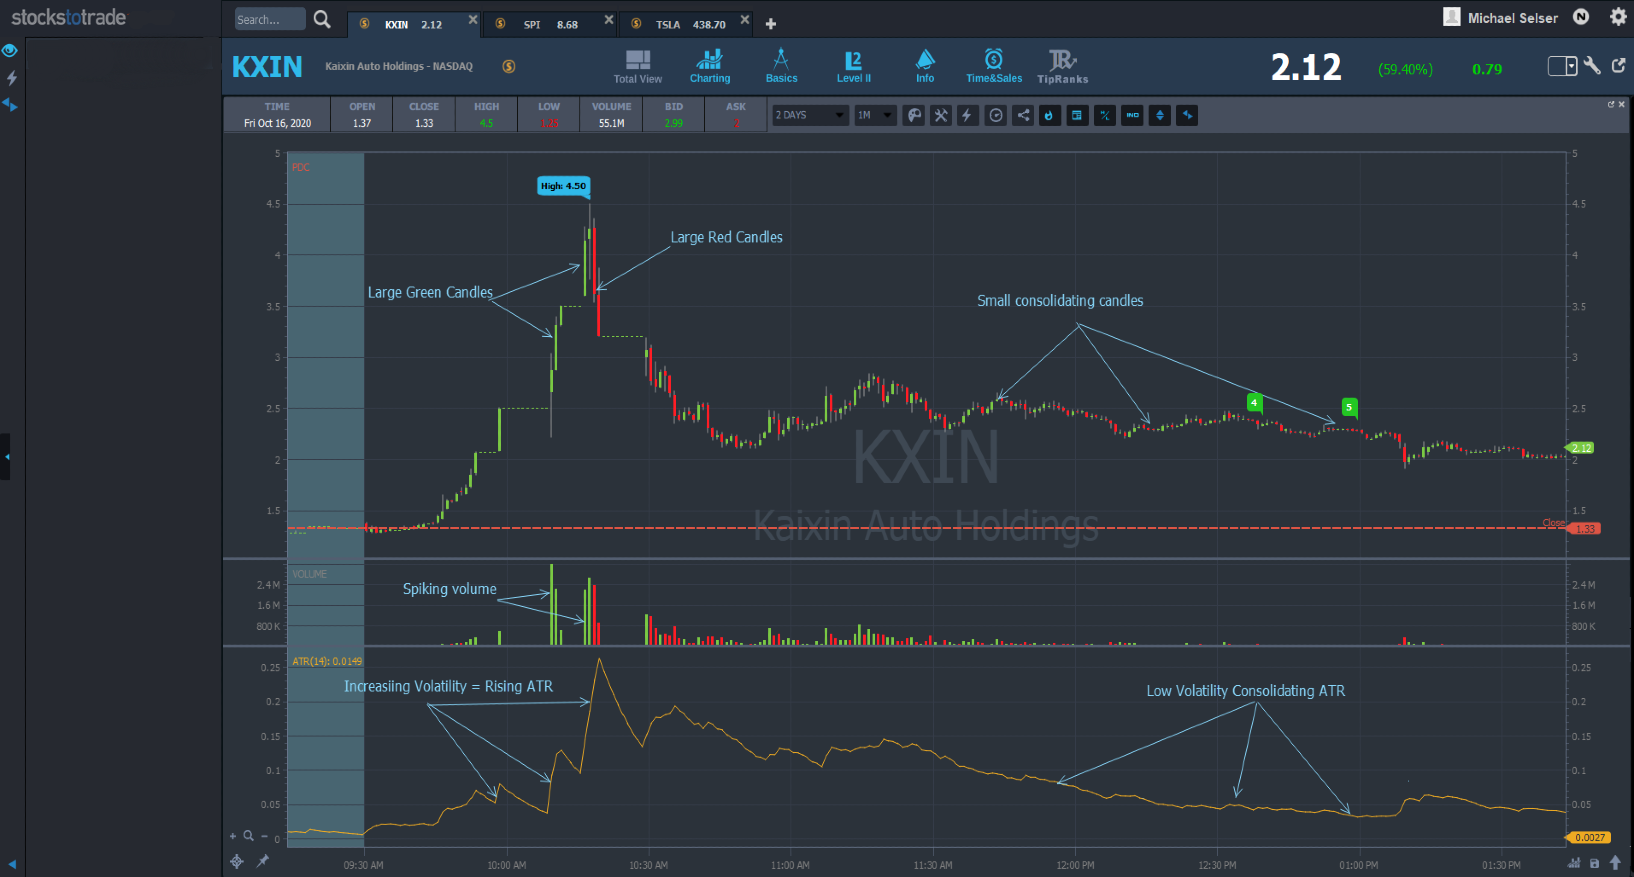
KXIN chart, intraday Average True Range October 16, 2020 (Source: StocksToTrade)
KXIN didn’t have a catalyst behind this spike. It was a technical setup that broke out on this day.
Notice the rising ATR values correlating with the large candles.
SPI Energy Co. Ltd. (NASDAQ: SPI)
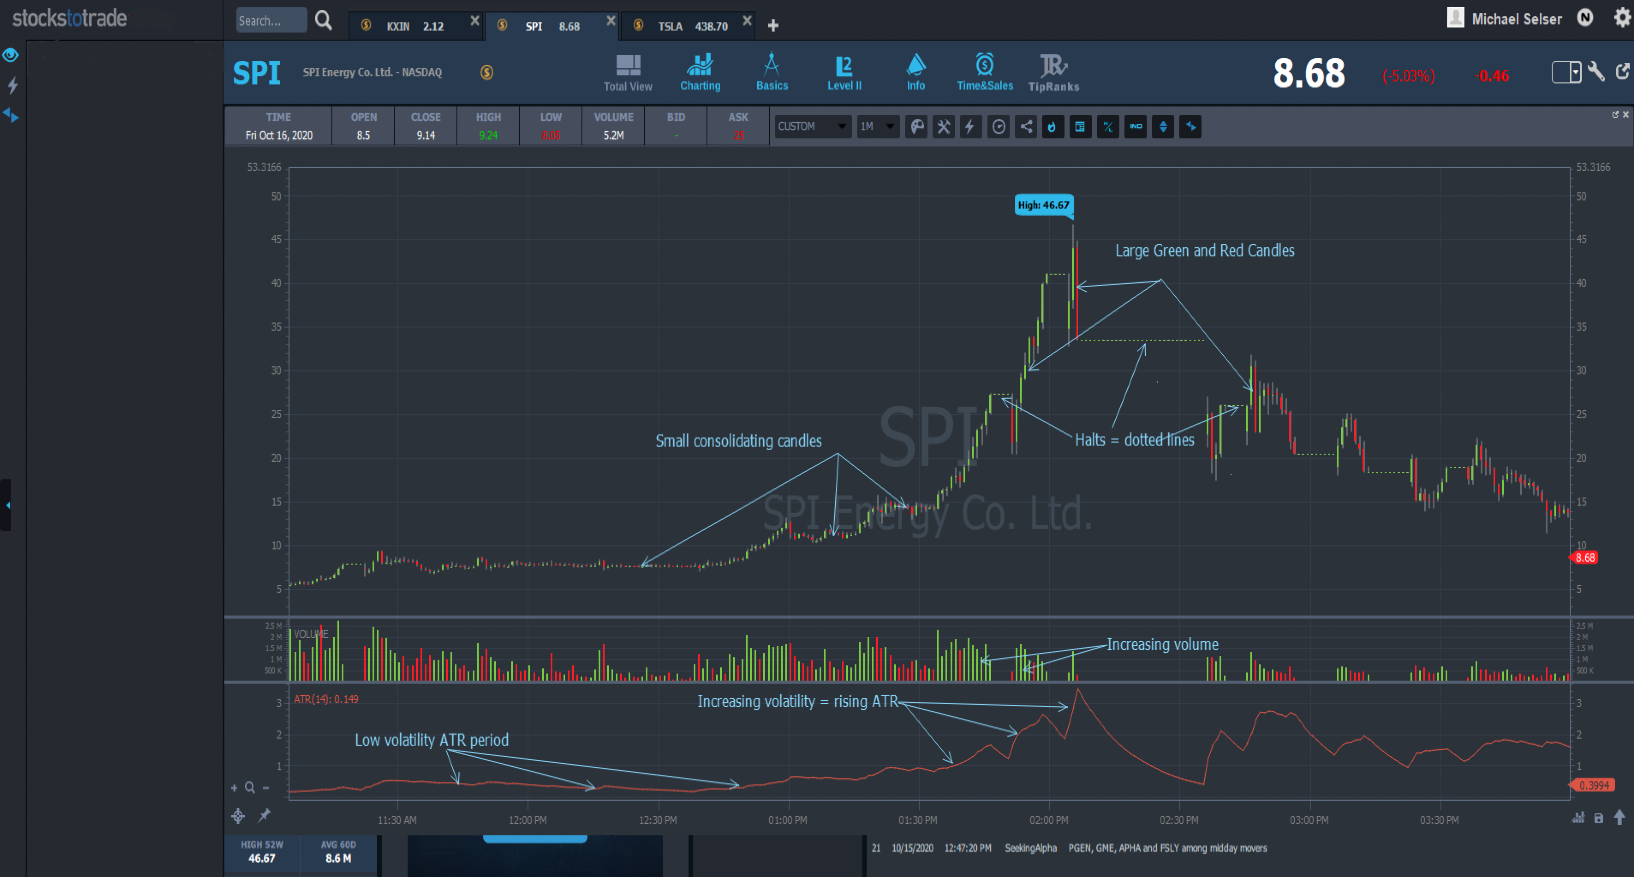
SPI chart, intraday Average True Range September 23, 2020 (Source: StocksToTrade)
Here’s a taste of some of the volatility we’ve seen in 2020. SPI intraday went from $3 a share to $46 a share at its highs! Talk about life-changing…
Notice the low ATR while SPI consolidated. And note how ATR rose as volume started coming in on SPI.
Tesla Inc. (NASDAQ: TSLA)
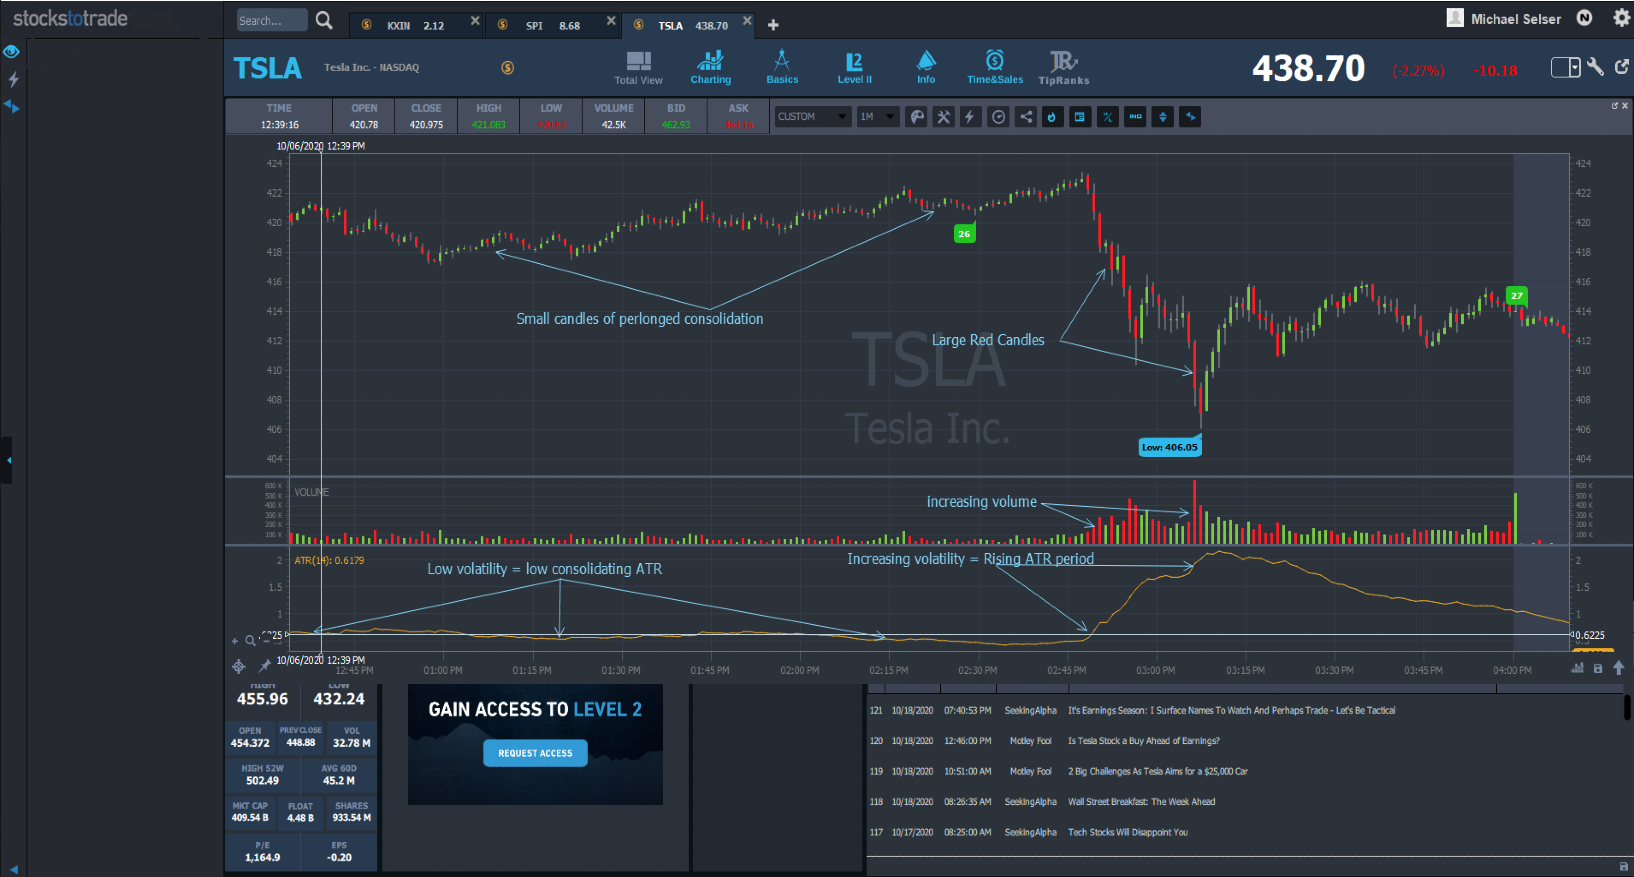
TSLA chart, intraday Average True Range October 06, 2020 (Source: StocksToTrade)
In this example, TSLA shows you that a rising ATR doesn’t show directional price action.
Notice the downward collapse of TSLA here. ATR rises in that volatility and keeps rising on the bounce.
How to Use Average True Range Indicators to Find Breakout Trades Early
The markets are ever-shifting from hot to cold and back again.
The average true range can help identify a breakout early as volume and momentum begin to pick up.
An increasing ATR means higher volatility. Be prepared when you see this — this could mean a breakout is coming.
And you could use the ATR to help you enter or exit trades. But that comes down to your risk management strategy.
How to Use the Average True Range Indicator to Find Trends
The ATR won’t show you if a stock’s trending the direction you want to trade.
So if you use this indicator, keep in mind that volatility can be low and the stock can still trend up or down.
This is when using a trailing stop order can be key. Your stop can then follow the price movement after your entry. And you’re out once the stock price falls to your stop order.
How to Find a Stock’s ATR on StocksToTrade
I mentioned that you take the true range of price and average it out over a specified time to calculate the ATR.
You can place this indicator on your chart like other trading indicators.
And good news! It’s simple to do on the StocksToTrade platform. The ATR will appear at the bottom of the chart as a single line. See why so many top traders use StocksToTrade every day. Check it out for yourself with a 14-day trial for $7.
Disadvantages and Limitations of Average True Range
The ATR can assist you in making your trading decisions … But just like anything, it comes with limitations and disadvantages…
As I mentioned, the average true range doesn’t account for the direction in which a stock is moving or if the stock’s trading in a trend. It’s subjective and best used with other indicators and a well-crafted trading plan.
Conclusion
The average true range is a great tool to use in determining market volatility. If the stock isn’t moving, it’s tough to profit, right?
Understand that this indicator is another tool to aid your trading. You need to have a sound trading plan and strategy in place above all else. The rest is there to help you spot opportunity and confirm what you already researched.
Come learn how to build strategies and great trading plans — join our SteadyTeam mentorship community today!
And see how beautiful the charts and indicators are on StocksToTrade. Get your 14-day trial for just $7 today!
How do you use the ATR in your trading? Leave a comment below. It’s always great to hear from you!


 (8 votes, average: 1.50 out of 5)