Friday’s squeeze action didn’t disappoint…
While Fed Jerome Powell’s remarks on rate increases and inflation tanked the market, you had the chance to capitalize on a 50%+ gainer!
And you had no excuse to miss it…
I highlighted the stock and catalyst here the day before. So it should’ve been on your radar.
But just in case you missed it, I’m going to share why you need to keep day one runners on your watchlist.
Plus, I’ll dissect this setup and explain why it’s such a powerful pattern to have in your trading toolbox…
A Textbook Pattern and Squeeze
This isn’t some new exciting pattern or strategy…
If you’re a regular Daily Accelerator reader, in Pre-Market Prep, or the SteadyTrade Team — you know that a lot of these concepts and patterns repeat.
That’s why we’re able to capitalize on the moves…
But learning how to trade the patterns also requires repetition.
I need to repeat the same lessons until I drill them into you, and your process becomes a habit.
Understanding the mechanics of why patterns work can help you better plan your entries and stops the next time you see this setup.
So today, I’m breaking down the day-three surge pattern we saw in Minerva Neurosciences, Inc. (NASDAQ: NERV) on Friday.
NERV first had a big green day on Wednesday. And once a stock has a big run and closes near its highs, it should be on your watchlist the next day.
You can see from the chart, NERV didn’t do much the next day.
But it also didn’t die…
Which is exactly what we like to see before a potential day-three surge.
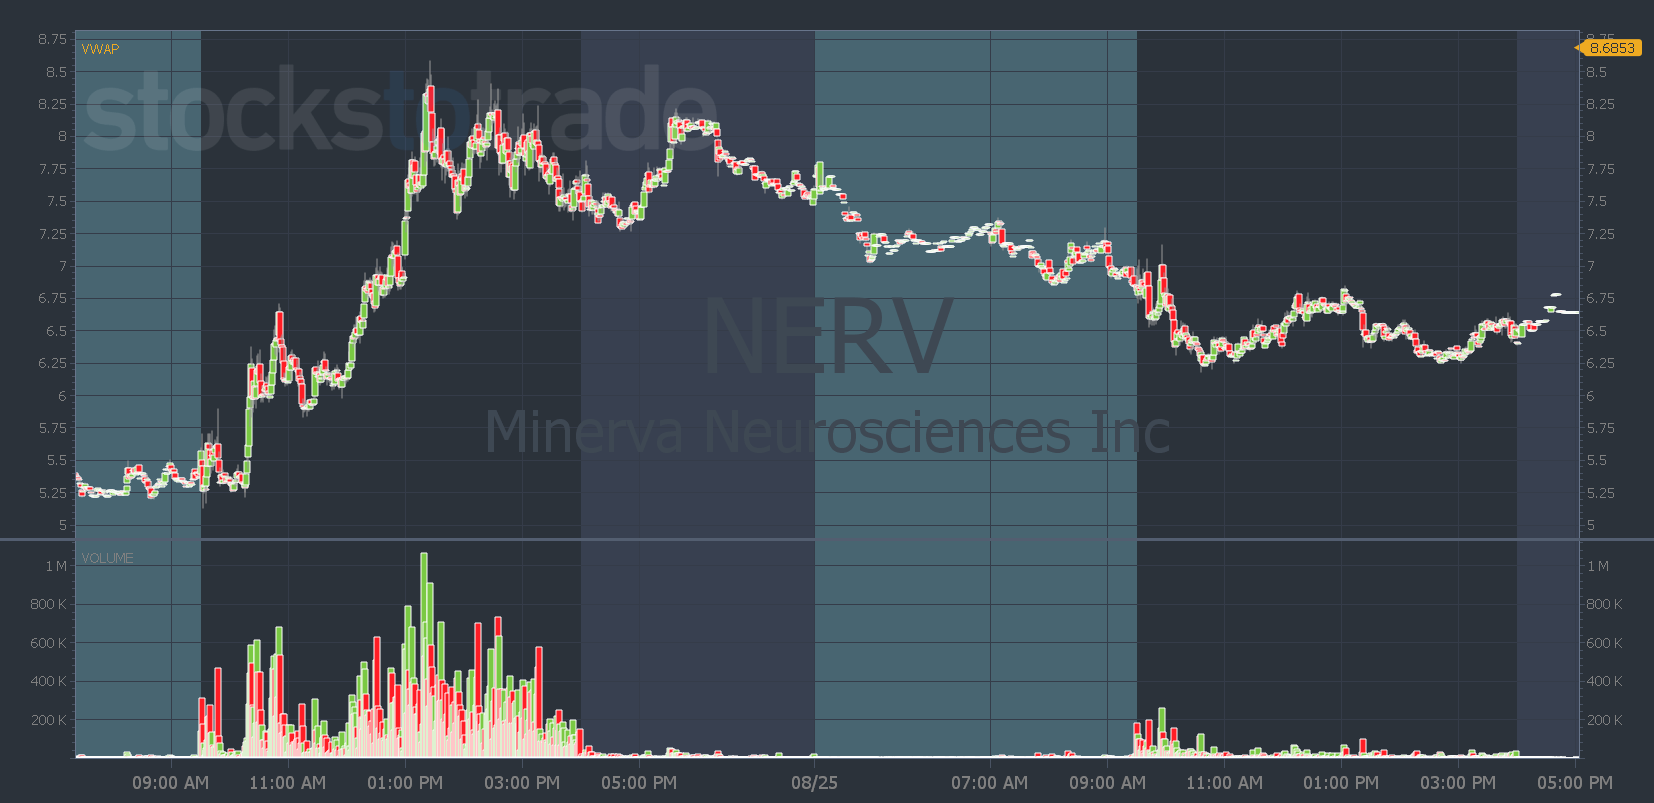
The stock went sideways and collected shorts. Then on Friday, it blew them up.
Here’s the breakdown of why the pattern works…
The Day-Three Surge
When NERV opened on Friday and was basically green (above the previous day’s close).
That’s what sparked the signal for shorts to start getting out.
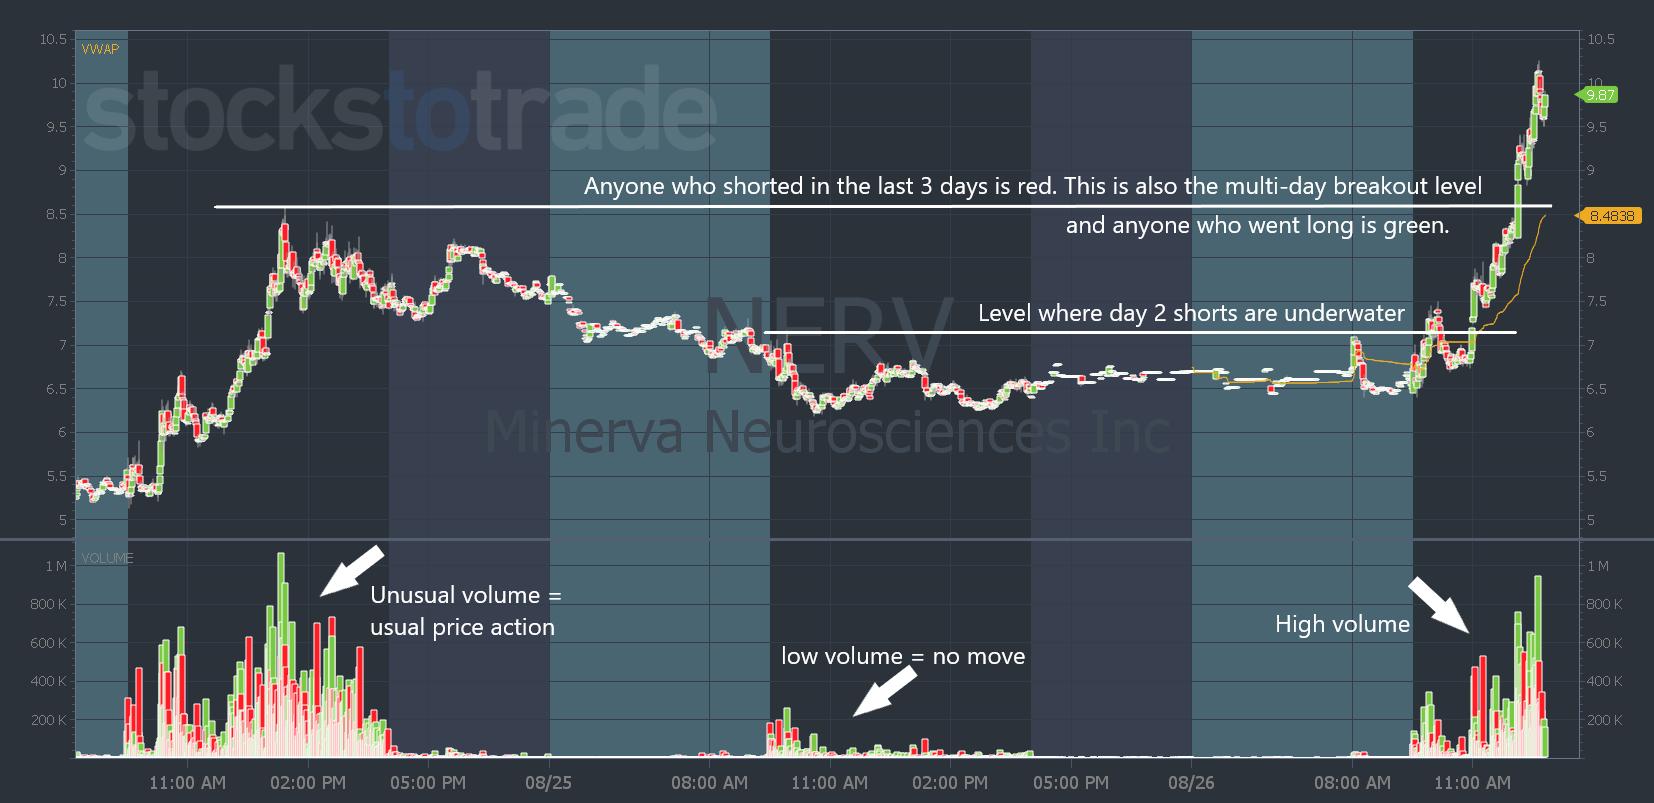
Then when NERV climbed above $7.20, anyone who shorted it the previous day and held their position was underwater.
That means more shorts are buying…
You can see the volume in the morning was higher than the previous day when it just went sideways.
And when it was over $8.60 anyone who shorted it and held it over the last two days was in a losing position. And anyone who went long is green…
That means there are no bag holders from the high volume day to sell and pressure the stock lower.
It’s also a similar chart pattern to the multi-day break out on the daily chart. Now, you have people who trade that pattern entering the stock…
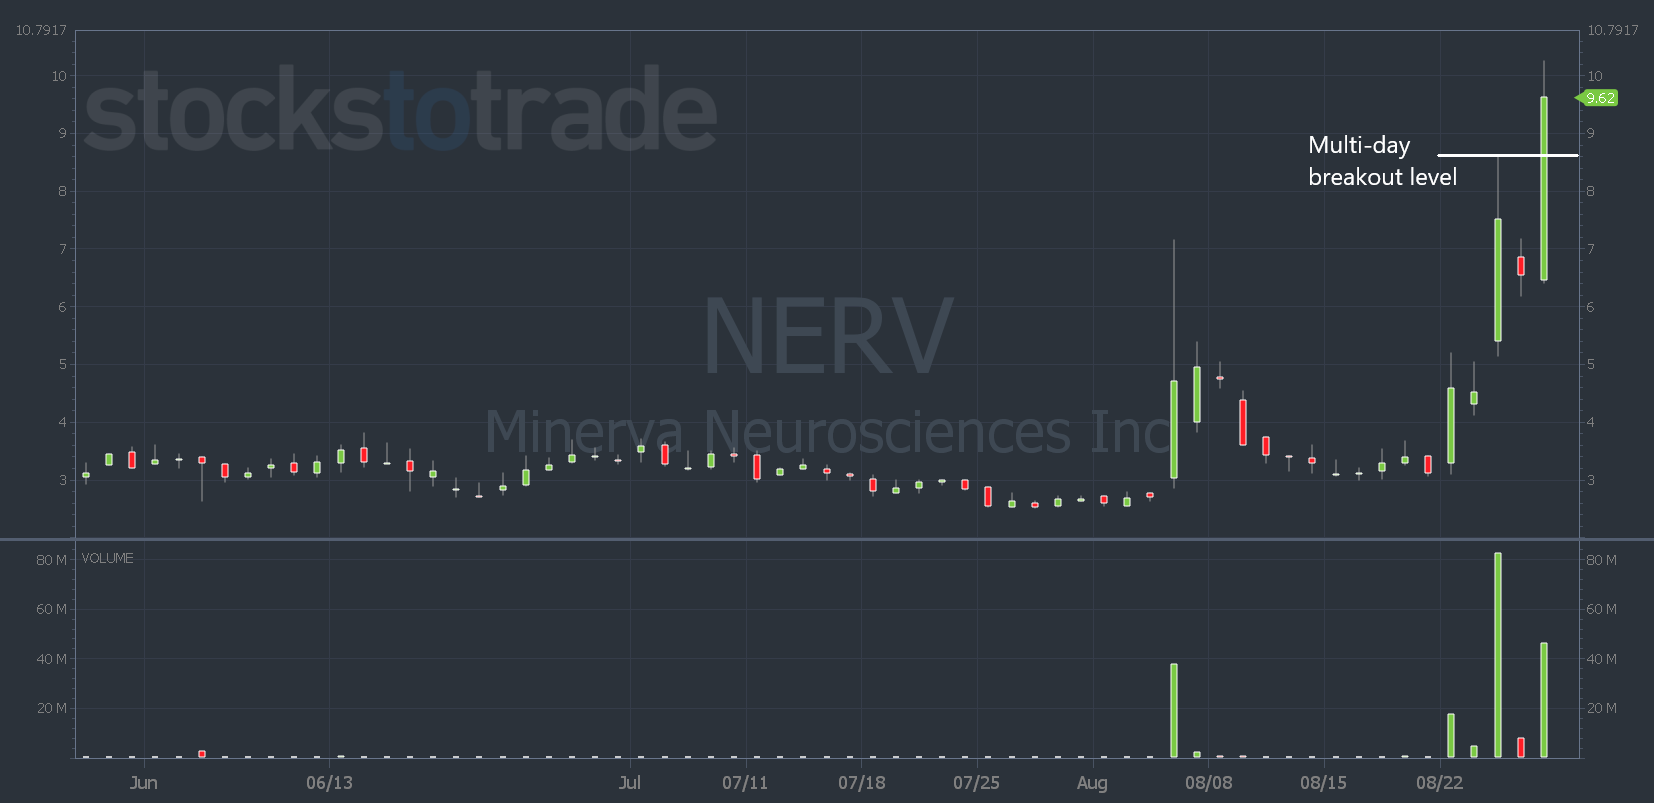
And the more eyes, interest, and buyers you get in a stock, the bigger the potential moves.
Unusual volume creates unusual price action.
And price action is all that matters.
So if you’re planning a trade and wondering if a stock can continue higher near a breakout level — watch the volume.
And watch this video to learn more about the day-three surge pattern.
Have a great Money Monday, everyone. See you back here tomorrow.
Tim Bohen
Lead Trainer, StocksToTrade