When it comes to trading, timing matters.
There are definitely prime times for trading — hours of the day and times of the week when stocks tend to make the most and biggest moves.
But what if you’re new to trading and have a job and can only trade part-time?
Don’t worry — it doesn’t mean you can’t be a trader. You just need to focus on the patterns that work best with your schedule.
Here, I’ll share my top two patterns for new traders who may be on a time budget. One’s best for trading in the morning, and the other works best in the afternoon.
The patterns I teach in this post are adapted from the lessons in my NO-COST Day Trading 101 series — just one of the many no-cost resources I offer.
Table of Contents
A Crucial Reminder
Before I get into my top two patterns for new traders, here’s something every new trader needs to know…
These patterns aren’t intended for long-term trades. In the world of day trading, traders should not treat tickers as long-term investments. Honestly, I just think of them as a bunch of letters and a chart.
I know this can sound strange, especially if you came to trading from a ‘buy and hold’ investment mindset. But with day trading, holding too long usually only leads to disappointment.
Day trades are all about the chart, price action, and making sure a stock checks all the boxes.
Be discerning with your watchlist — and be quick to cut losses if trades go against you.
Note: Want access to my weekly watchlist? Sign up for my NO-COST weekly watchlist here!
My Top Morning Pattern For New Traders
Are you able to carve out some time early on in the trading day? If so, this is my top pattern for new traders, period.
Yep — I play favorites! I’ll openly admit that I think this one is the best pattern for new traders, but the afternoon pattern that follows is a close second.
The Dip and Rip
Since I already have a detailed post on the dip and rip, I won’t go into great detail here. I’ll just give a brief overview.
For a more detailed review of the pattern, check out this post on the dip and rip and this video…
Let’s break it down in brief…
The dip and rip is a confirmation-type pattern. It’s a stock that’s a big gainer. It’s a multi-day or multi-week runner with a catalyst.
Basically, it will meet a lot of the criteria I check for every trade. And his part is important … While you’re watching the stock at the open, you don’t trade right away.
Typically, there’s a mania around stocks when the market opens. Instead of rushing in, with this pattern, you wait a little while. Not too long — usually only until 9:45 a.m. Eastern or so.
What you’re hoping to see is a brief period of consolidation. That’s the dip. Then you wait for the trend to resume — the rip.
Not only does waiting give you a better entry — but it also lets the stock prove itself so you can see which direction it’s headed.
Here’s a real-life example…
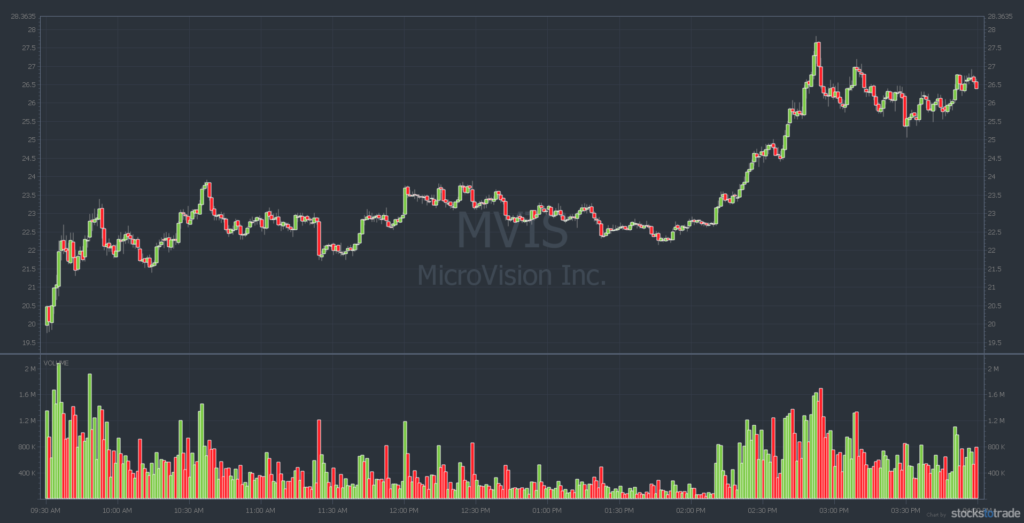
Dip and Rip Example: Microvision, Inc. (NASDAQ: MVIS)
This example is from April 26, 2021. Yes, the moment’s passed on this trade. However, it’s not necessarily the ticker I want traders to pay attention to — it’s the setup. This type of setup can repeat over and over in the market!
As of late April, Microvision, Inc. (NASDAQ: MVIS) had a lot going for it. First, it was in a hot sector — augmented reality.
It was also a sympathy play to a big-name company. Microsoft Corp. (NASDAQ: MSFT) had recently landed a contract with the army for augmented reality displays along the lines of what MVIS produces.
There were also some loose ties between MSFT and MVIS. In the stock market, that can be enough to create a stock run. It doesn’t matter if anything comes to fruition.
It also had an incredible breakout chart. MVIS has a long history of running. I remember putting it on my watchlist way back in December 2020 when it was a breakout at $4. As of April 2021, it was at 52-week highs in the $20s.
On April 26, it was a dip and rip.
The stock had been uptrending the previous week. Then on April 26, the stock gapped up in the premarket, then pulled back and consolidated at VWAP (volume-weighted price average). That’s the dip at the open…
Then it then re-broke the high of the day into the 9:45 window. Yep, that’s the rip.
In this case, waiting for the dip and seeing the reclaim of the high would allow a trader to potentially buy into that confirmation move and avoid playing guessing games.
Remember — no trade’s guaranteed. It might not work, so always have a stop-loss in place.
Check out my full commentary on the MVIS dip and rip:
My Top Afternoon Pattern for New Traders
Don’t have time in the morning? Don’t sweat it. Honestly, every time the dip and rip pattern doesn’t work out, there’s almost always a second chance in the afternoon with this pattern…
The VWAP Hold, High-of-Day Pattern
It’s a mouthful, I know. VWAP-hold, high-of-day pattern is not as catchy as dip and rip. I’m totally open to suggestions if you’ve got a better name…
Once again, I’m wont’ to go into the nitty-gritty of the pattern here, because I already have a detailed post about this pattern. Check it out here. It’s also in my e-book, and you can check out this video:
But to review…
For this pattern, you’re looking for a recent runner. Everyone’s watching it.
This part is important — it’s also heavily shorted. That means traders are betting against the stock, hoping it will go down. The longer these heavily shorted momentum stocks hold up into the afternoon, the more shorts want to beat a hasty exit.
That could actually create a spike. Sucks to be a short seller — but if you’re trading this pattern, that’s a great thing.
Here’s an example…
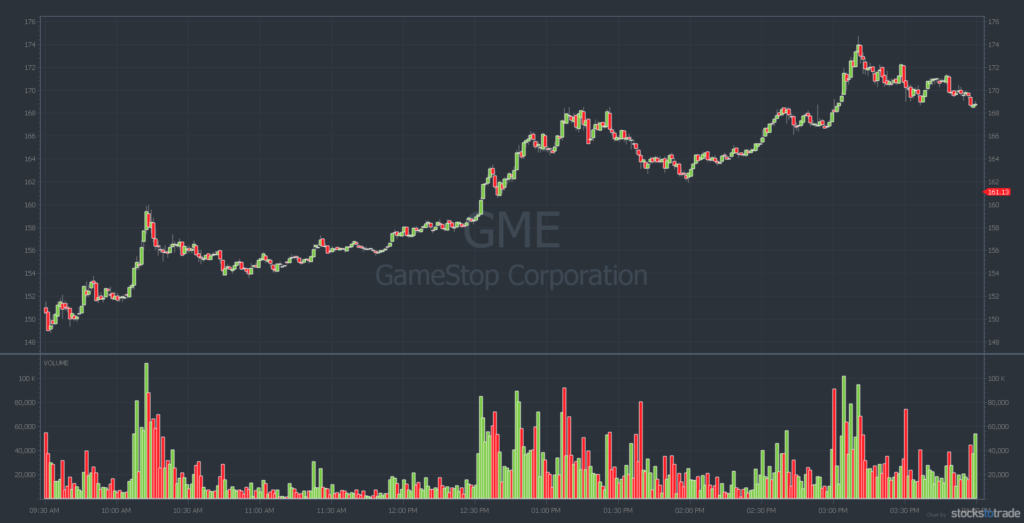
VWAP-Hold, High-of-Day Pattern Example: GameStop Corp. (NYSE: GME)
This is the OG meme stock! You may remember GameStop Corp. (NYSE: GME)’s epic run. In December 2020, it was trading for about $4. Thanks to an epic short squeeze, it went all the way up to the high $400s.
On the day in question, April 26, 2021, it was trading in the $150 range.
The stock opened flat, around the previous day’s closing price.
It chopped around, then spiked big at around 10 a.m. from $151 to $160 or so. It was a big gainer. It was in play. That’s what put it on traders’ radars.
This afternoon pattern is like the dip and rip in that you’re waiting for a confirmation move.
In this case, GME ran in the midday, then held VWAP at around 2 p.m. That was the bullish type of sign you look for in this pattern. If it was below, it would be considered bearish.
Once it broke that high of the day, it spiked, then ripped in after hours. It never touched VWAP.
Check out my full commentary on the GME VWAP-hold, high-of-day pattern:
How Do I Find Stocks To Trade?
Curious about how I find stocks that fit these patterns?
I use StocksToTrade, of course.
With built-in scans and customizable scans that you can set up to fit specific criteria, it’s easy to find the types of stocks you want to trade.
As an added bonus, STT charts feature links to news and social media mentions. That can help you see potential catalysts and buzz…
Additionally, STT’s Breaking News chat tool can alert you to of-the-moment news that could move stocks right now.
A screener like STT can make your life so much easier when it comes to filtering down the many stocks out there. But I think you should see it for yourself … Try StocksToTrade for 14 days — it’s just $7.
Pick Your Pattern…
If you ask me, one of the best things about day trading is that you can make it work with your schedule.
Even though my life revolves around the stock market, I’m actually a part-time trader. I’m teaching, doing webinars, and living my life — I don’t have time to trade all day.
But you don’t have to trade all day. By focusing on a few key patterns, you can choose the best time of day for you and stick to it.
By familiarizing yourself with these two patterns, you’re giving yourself two amazing time zones and strategies to trade.
Ready to keep learning? Level up your trading education by joining my mentorship program, the SteadyTrade Team. We’re all working on getting a little better every day…
Have you checked out my Day Trading 101 course yet? Do you find lessons like this helpful? Please share with your trading buddies and leave a comment below!


