Table of Contents
Moderna Stock: Key Takeaways
- The hottest stock on social media right now is down 21% in just three trading days — should you buy the dip in Moderna stock?
- The critical technical indicators that could help traders spot Wednesday’s explosive blow-off top.
- New chart signals could suggest a dip-buy opportunity for Moderna bulls.
High-flying pharmaceutical stock Moderna, Inc. (NASDAQ: MRNA) has been on a rip-roaring momentum surge for weeks.
But the past several days have brought the stock back down to earth. The chart’s now a volatile work of art, leaving traders to wonder: should they buy the dip?
Moderna Stock Goes Haywire
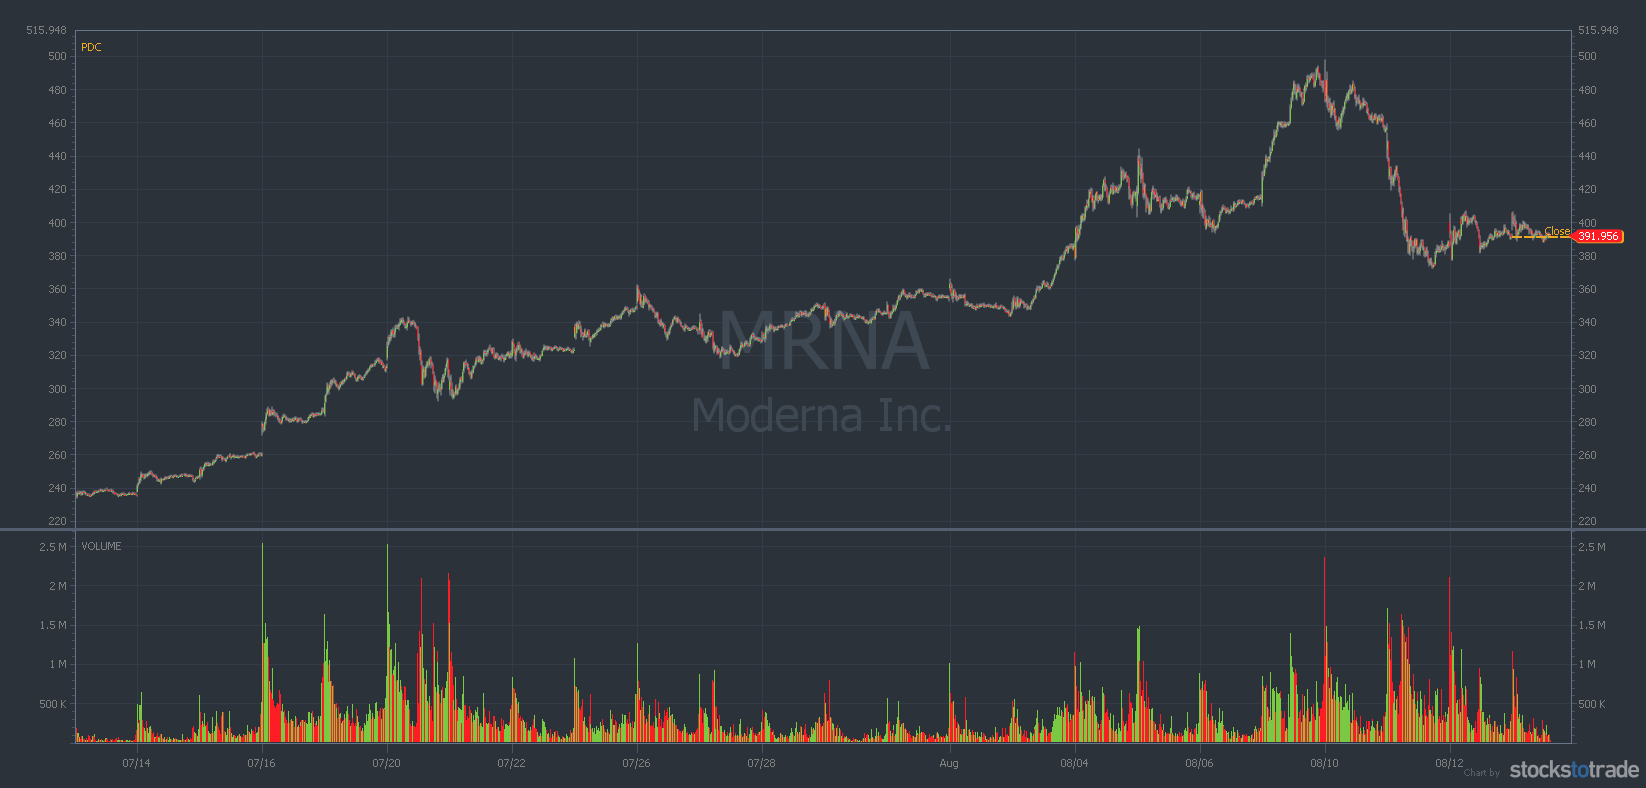
MRNA 1-month, 5-minute chart (Source: StocksToTrade)
Over the past month, a perfect storm of bullish headlines sparked a face-ripping rally in Moderna stock…
The most notable news cycle began on July 15, when it was announced that Moderna would join the S&P 500 index.
The stock was trading for around $250 when the fund inclusion news hit. Less than a month later, Moderna had rallied nearly 100%. At its near-term high on Tuesday, August 10, one share of Moderna cost $497.49.
If you think it’s a coincidence that Moderna stock began to sell off just $2.51 before hitting a BIG round number, you may want to reconsider your outlook…
Bearish Signal #1: Price Resistance at $500

MRNA 1-month daily chart — a purple horizontal line marks resistance at $497.49. (Source: StocksToTrade)
Moderna’s inability to crack the $500 level proved to be its near-term downfall…
On Thursday, August 11, Moderna stock finally pulled back. And it pulled back HARD. It was an epic dump, sending shares down a whopping 17 points at their lows.
Zoom out and think about this … For a month, the stock had been consistently reaching new highs day after day. Many smart traders will have been holding the shares for weeks, patiently waiting to hit certain price targets for profit-taking.
But when a chart’s way above historical averages, making fresh all-time highs in a “blue sky breakout,” it can be difficult to find near-term price context to establish levels of support and resistance.
This is when traders must look to nearby round numbers for key levels. A milestone round number (like $500 per share) is an obvious goal post for traders across the world to bookmark. But different traders with conflicting mindsets or trading plans will eye these prices for different reasons…
Bullish swing traders will be looking for the exit door, while eager short sellers will be licking their chops to borrow shares above $450. Consider both of these factors no matter which side of the trade you’re on.
Even the biggest of Moderna bulls should have approached the $500 mark with extreme caution. A level of strong psychological resistance is never a good place to add to long positions.
Conversely, anyone looking to buy puts options or sell shares short should have been slamming their finger on the trigger near $500. As the share price began to struggle near $500, the daily trading volume was flashing parallel warning signs for bulls…
Bearish Signal #2: Volume Resistance at 42 Million
While many traders are experienced at setting support and resistance on a share price, there’s another occasionally misinterpreted metric — volume.
Many traders simply track volume surges and trade around them. That’s OK, but there’s a more specialized way to look at the daily trading volume on certain charts that can help to see near-term topping signals.
In the case of Moderna, looking at the volume bars through the lens of volume resistance could have been key.
Specifically, the average daily trading volume of a stock can sometimes reach resistance just like the share price.
Again, think about this logically. There are only so many available shares to trade on a given stock (also known as the total float).
A certain portion of the total float is usually held by institutions and long-term investors. In other words, that portion of shares remains locked in big-money vaults, rarely trading hands with any other market participants.
That leaves the remaining shares in the total float to be actively traded. And remember, there are only so many of these shares out there at any given time…
So if you notice the volume bars on a chart regularly backing off around the same level, pay close attention. Bulls should run, while bears should sharpen their claws.
With Moderna stock, the volume number that sticks out like a sore thumb is 42 million daily shares traded. Now take a look at the same chart, but notice the notations on the volume bars.
Just like the price resistance at the $500 level, this isn’t a coincidence…
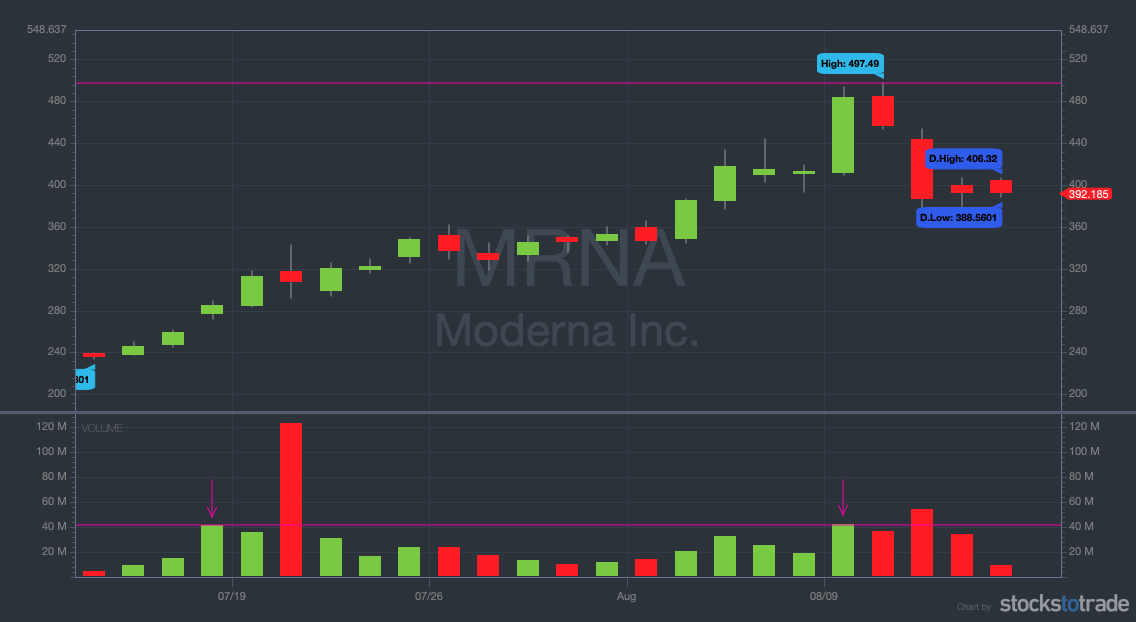
MRNA 1-month daily chart with blue horizontal line and arrows showing volume resistance at 42 million (Source: StocksToTrade)
In the volume window, notice the horizontal line drawn at the 42 million level. Moderna stock’s total daily trading volume hasn’t exceeded 42 million shares all month. It hasn’t cracked this level on a single green day year-to-date.
The two times Moderna did trade north of 42 million shares in a day were both ultimately red closes surrounding monumental news headlines.
The first was on Tuesday, July 20 — the day the stock joined the S&P 500. Over 120 million shares traded.
The second was just this past Wednesday, August 11 — a classic first red day reversal pattern. More than 50 million shares traded.
Now imagine that you were trading Moderna stock on Monday, August 9. As the closing bell draws near, with shares up more than 17%, you notice the daily volume bar is pressing right up against the 42 million resistance…
Knowing what we just laid out, what would you do?
Hopefully, you’d sell or short Moderna at that moment. Had any trader seen these indicators and done so, they could have made a pretty penny, as Moderna stock dropped more than 20% over the following two days.
This brings us to the current trading conditions in Moderna stock. After plummeting off its incredible momentum surge, certain signals are now looking more bullish than bearish…
Bullish Signal #1: Bouncing Off the Uptrend
In any face-ripping rally over a sustained period, charts will form into visible uptrends.
Even amateur technical analysts can usually draw a trendline that gives a broader picture of a stock’s move. This is known as trend analysis. Bullish trendlines (aka uptrends) are most commonly visualized by drawing a line from a rally’s low point to its current high point (or beyond.) See the chart below…
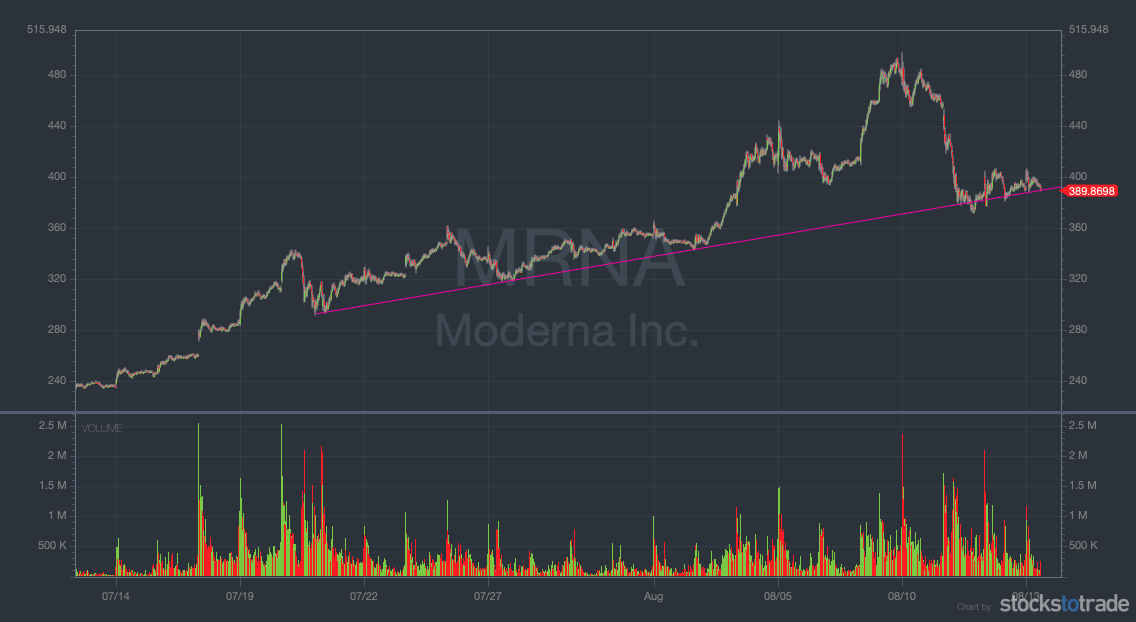
MRNA 1-month, 5-minute chart with purple line (and arrows) showing the primary 1-month uptrend (Source: StocksToTrade)
Uptrends are further substantiated when a share price bounces off of the line multiple times throughout its rally. That indicates that the analysis is correct and that the price does indeed respect that trendline (for the time being).
The Moderna chart is a particularly elegant example of this concept. Six times in a row, the price bounced at or near the primary one-month uptrend — like clockwork.
On the other hand, uptrends can also help show when a stock’s elevated above its current trendline.
Charts always revert back to the trend. It isn’t a question of if, only when.
If you have an accurate uptrend established on your charts, you can potentially avoid entering long trades at elevated levels.
You only need to move your eyes a few days back on the Moderna chart to see how far off the trendline the share price was.
But for long traders, assessing uptrends is critical after a huge up-and-down move like we’ve seen in Moderna over the past four trading days. If your technical analysis is on point, you can use a strong bounce off of the uptrend as a potential dip-buy opportunity.
That being said, we haven’t seen a really strong bounce with Moderna yet. But we have seen the stock hold the uptrend with remarkable strength.
And just like the $500 level was a spot for bears to get aggressive and for bulls to take profits, now we have a spot where their roles could likely reverse again.
The Bottom Line: Should You Buy the Dip in Moderna Stock?
Enough with the technicals — should traders buy this dip?
This is a question only you can answer for yourself. Moderna stock is extraordinarily volatile. So approach any trade (long or short) conservatively.
The relative strength of the uptrend is intriguing … But the bounce back up isn’t compelling enough to warrant a true conviction in a bullish reversal.
The signs are there, but traders should wait for confirmation.
Remember, there are no guarantees in the stock market. Be prepared for anything. If the price action proves any of your indicators wrong, cut your losses IMMEDIATELY.
Stay tuned to Moderna stock, but trade with caution.