

T1 Energy Inc. stocks have been trading up by 11.52 percent after securing a transformative long-term LNG supply contract.
Key Takeaways
- TE has bounced from a recent low near $2.08 to close around $2.84, showing steady short-term momentum.
- Intraday action in T1 Energy Inc. is tight, with most trading holding between $2.80 and $2.90, signaling consolidation after the bounce.
- T1 Energy Inc. is still losing money, with negative margins and heavy debt, but revenue is sizable at roughly $755.3M.
- TE shows strong asset turnover and growing inventories, hinting at aggressive expansion that traders must weigh against cash burn.
- Risk remains elevated in TE as leverage is high and free cash flow is deeply negative, favoring short-term, rule-based trading plans.
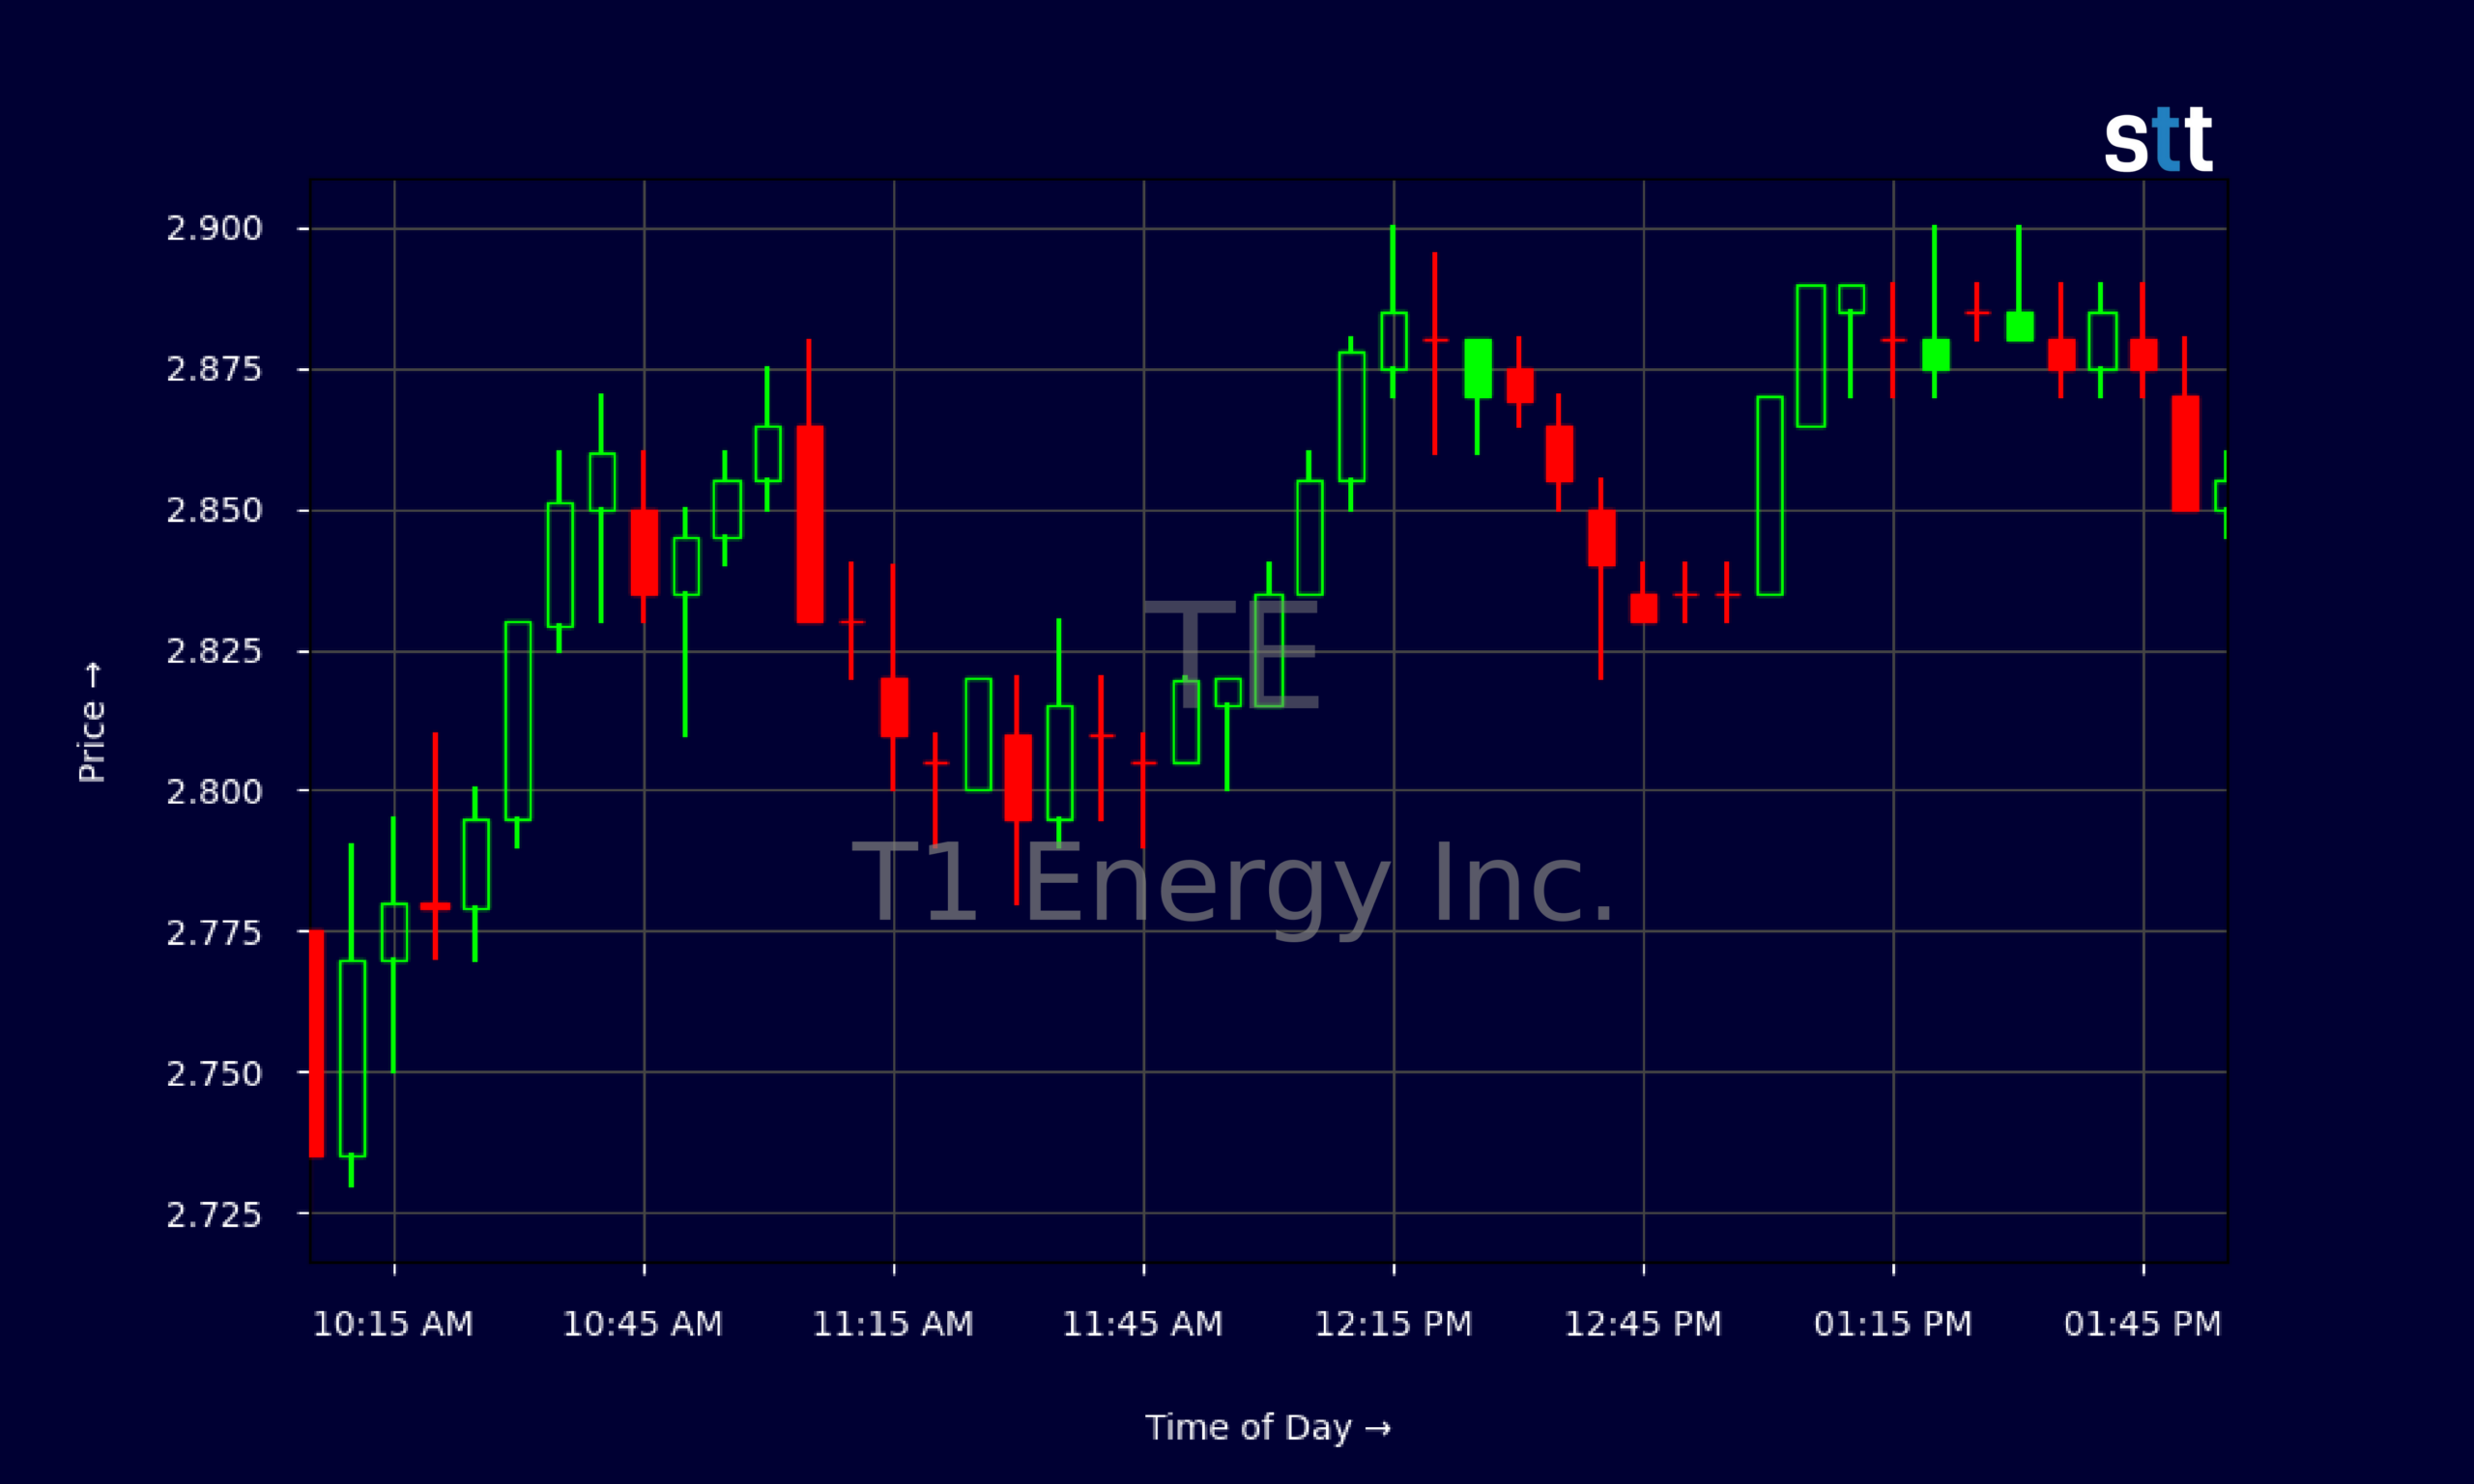
Live Update At 14:02:24 EST: On Tuesday, November 03, 2026 T1 Energy Inc. stock [NYSE: TE] is trending up by 11.52%! Discover the key drivers behind this movement as well as our expert analysis in the detailed breakdown below.
Quick Financial Overview
TE is a classic high-reward, high-risk small-cap story. T1 Energy Inc. is moving a decent amount of revenue, about $755.3M over the trailing period, yet the company is still bleeding cash. Profit margins are deeply negative, with an EBIT margin near -28.8% and overall profit margins below -30%. For traders, that means TE is being priced more on growth hopes and momentum than on current profitability.
T1 Energy Inc. carries significant leverage. Total debt-to-equity is roughly 2.83, and the leverage ratio sits near 6, which is high for a company with negative earnings. The balance sheet shows about $79.1M in cash plus $70.2M in restricted cash, but free cash flow last quarter was around -$131.2M. TE is leaning on debt issuances to keep pushing its strategy.
More Breaking News
- Bentley Systems Stock Pops As Analysts Back Eliis Deal
- NOK Stock Slides As Traders Question Q3 Strength
- ONDS Stock Slides As Traders Gauge Cash, Volatility
- CoreWeave Falls 4% Today
On the plus side, T1 Energy Inc. has a current ratio of 1.3, so it can cover near-term bills. Asset turnover around 0.7 and receivables turnover of 15 suggest TE is actually moving product. For traders, this mix of real top-line activity and weak bottom line creates fertile ground for sharp price swings.
Why Traders Are Watching TE’s Price Action
TE has been in a volatility pocket that momentum traders love. From 2026/10/09, T1 Energy Inc. slid from around $3.39 to a low near $2.08 on 2026/10/26. That’s a heavy pullback. Since then, TE has fought back, climbing from the $2.10s to close near $2.84 on 2026/11/03. This kind of V-shaped action can attract day traders hunting for continuation or sharp reversals.
Look at the recent daily closes for TE: $2.12, $2.46, $2.63, $2.86, $2.70, $2.56, then $2.84. T1 Energy Inc. is making higher lows and mostly higher closes, even with intraday shakeouts. That pattern tells traders that dip buyers are active and shorts are being forced to cover on strength.
Zooming into the intraday chart, TE traded most of the day between $2.80 and $2.90, with only a brief morning push down toward $2.73–$2.77 before reclaiming the open. T1 Energy Inc. then spent hours grinding sideways to slightly higher, with tight 5‑minute candles. That’s classic consolidation after a run, as both long and short traders wait for the next push.
Because T1 Energy Inc. has a low share price, heavy losses, and plenty of debt, any hint of good or bad macro energy headlines can amplify these moves. TE is the sort of ticker that rewards traders who track support and resistance closely, respect risk, and avoid getting stubborn when the trend flips.
Conclusion
TE sits at the intersection of strong price action and weak fundamentals. T1 Energy Inc. has real scale in revenue, yet its negative margins, large debt load, and deeply negative free cash flow make it a speculative trading vehicle rather than a steady compounder. When traders crowd into a name like TE, the moves can be fast in both directions.
The recent bounce from roughly $2.08 to around $2.84 shows that T1 Energy Inc. still attracts momentum capital. If TE holds above recent support zones in the low $2.60s and keeps building higher lows, short-term breakout traders may continue to target the $3.00–$3.20 range. If those levels crack, the same leverage that lifts TE can accelerate the downside.
For newer market players watching T1 Energy Inc., the key is discipline. TE’s financial profile — high leverage, negative returns on equity, and ongoing losses — demands strict risk rules. As Tim Sykes likes to say, “The best traders aren’t the ones who find the biggest winners; they’re the ones who cut losers the fastest.” As Tim Bohen, lead trainer with StocksToTrade says, “I focus on what a stock is doing, not what I want it to do. Let the stock prove itself before you make a move.”. Applied to TE, that means using tight stops, trading the chart instead of the story, and always sizing small enough that one bad candle doesn’t end your trading career.
This is stock news, not investment advice. StocksToTrade News delivers real-time stock market updates tailored to highlight the key catalysts driving short-term price movements. Our coverage is designed for active traders and investors who thrive in fast-moving markets, with a focus on volatile sectors like penny stocks, AI stocks, Robinhood stocks and other momentum plays. From earnings reports and FDA approvals to mergers, new contracts, and unusual trading volume, we break down the events that can spark significant price action.
Looking to level up your trading game? Explore StocksToTrade, the ultimate platform for traders. With powerful tools designed for swing and day trading, integrated news scanning, and even social media monitoring, StocksToTrade keeps you one step ahead.
Check out our quick startup guide for new traders!
- How to Read Stock Charts: A Guide for Beginners
- Trading Plan: 6 Steps to Create One
- How To Create a Stock Watchlist
Ready to build your watchlists? Check out these curated lists:
Once your watchlist is set, take the next step and trade with confidence using StocksToTrade’s robust platform. Don’t miss out — grab your 14-day trial for just $7 and experience the edge you need to thrive in today’s fast-paced markets.