

Nokia Corporation Sponsored stocks have been trading down by -7.75 percent amid heightened concerns over weakening telecom infrastructure demand.
Key Takeaways
- Nokia stock is down more than 7% despite reporting higher Q3 comparable earnings and net sales.
- The stock joined a group of European ADRs that dropped between roughly 2.4% and nearly 10% on a day the S&P Europe Select ADR Index fell just 0.96%.
- Shares also sank about 3.2% on a day when the broader European ADR index slipped only 0.3%, underscoring stock-specific selling pressure.
- Telecom equipment peers Nokia and Ericsson were notable decliners, falling around 3% and 1.7%, pointing to sector stress.
- NOK has repeatedly ranked among the largest European ADR decliners even when the broader index was only modestly lower or outright strong.
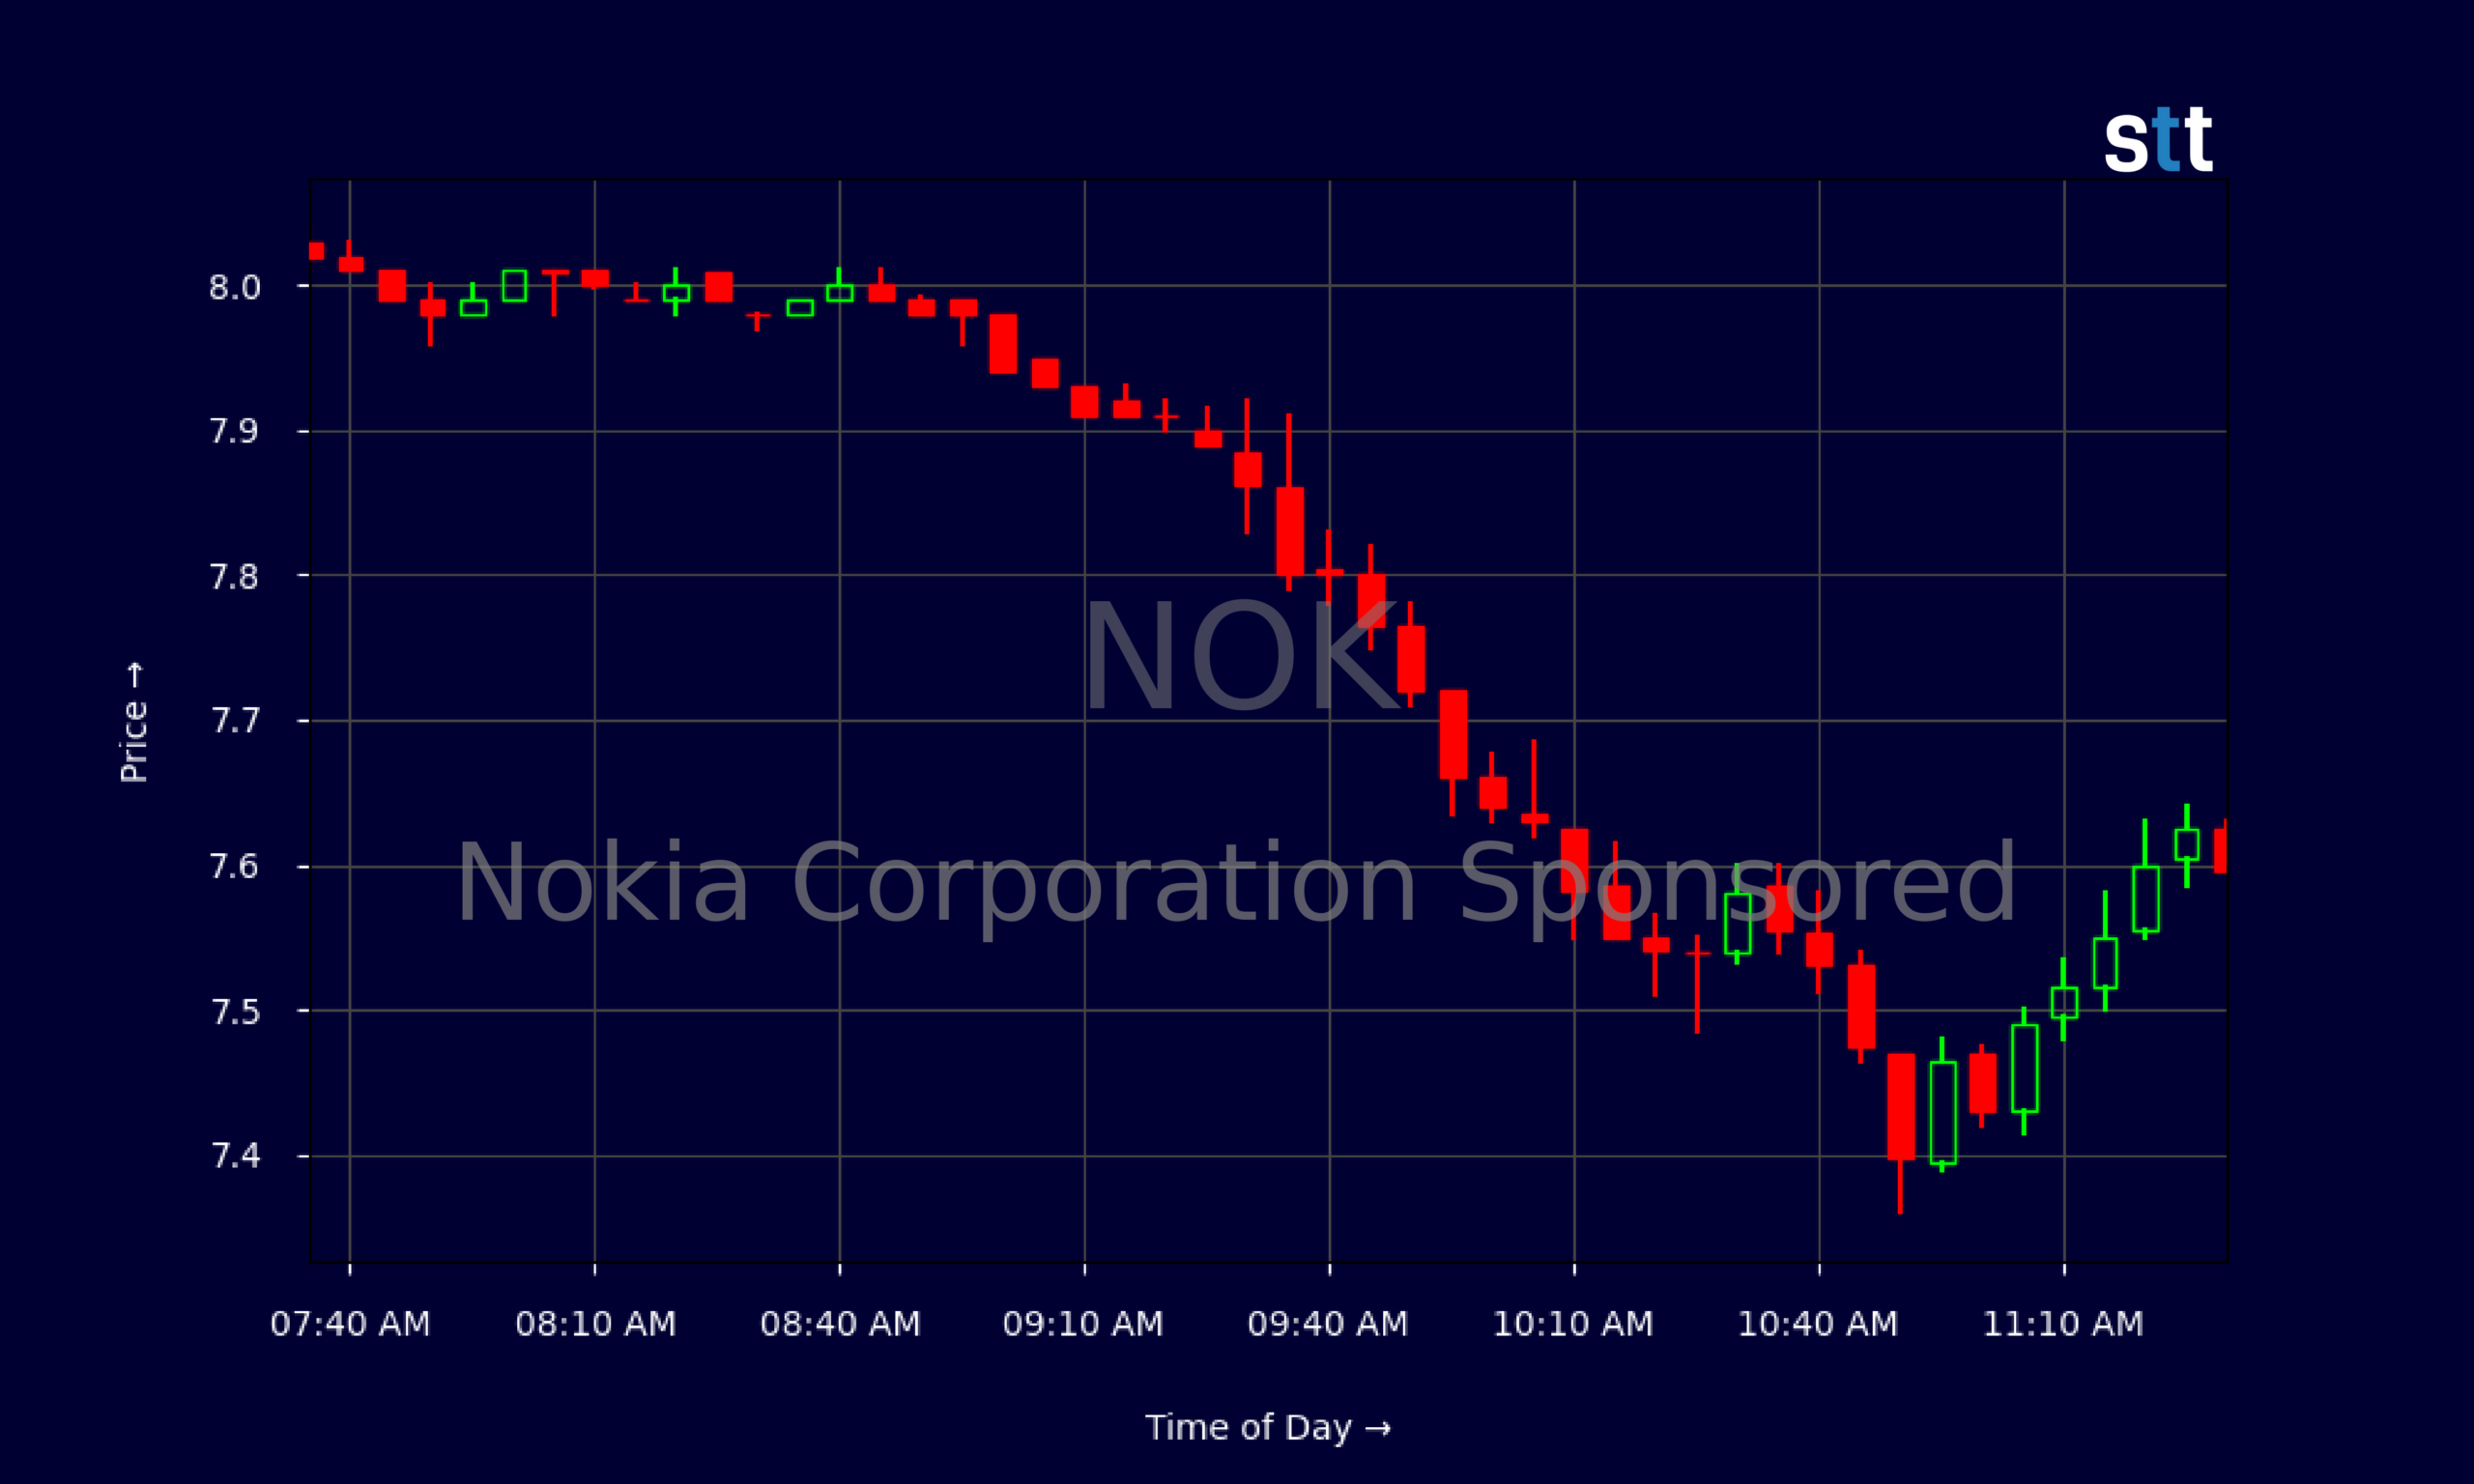
Live Update At 11:33:33 EST: On Thursday, November 05, 2026 Nokia Corporation Sponsored stock [NYSE: NOK] is trending down by -7.75%! Discover the key drivers behind this movement as well as our expert analysis in the detailed breakdown below.
Quick Financial Overview
NOK has been trading like a name under pressure. Over the recent stretch, Nokia ADRs slid from around $10.31 to near $7.60, a drop of roughly 26% in a few weeks. That is not normal churn; that is a repricing. Daily candles show a steady series of lower highs from mid-October, with NOK failing to hold bounces near $9.50–$10 before rolling over toward the mid-$7s.
Intraday, the 5‑minute chart highlights choppy but controlled selling. Nokia opened around $7.88 and quickly lost altitude, trading mostly below $7.70 and hitting lows near $7.36 before stabilizing around $7.59. This type of action tells traders that dips are being bought, but not aggressively. Supply still outweighs demand.
More Breaking News
- FTCI Stock Whipsaws As Liquidity Deal Meets Solar Tech Tailwind
- Sunrun Stock Jumps As Q3 Earnings Crush Expectations
- AEHL Stock Slides As Volatility Fades, Traders Eye Next Move
- EOSE Stock Rises As Q3 Revenue Jumps And U.S. Capacity Ramps
Fundamentals paint a mixed picture. Nokia generated about $19.22B in annual revenue, yet carries a rich price-to-earnings ratio near 74.4 and a price-to-sales near 2.58. Return on equity is a modest 5.82%, with return on assets at 2.94%. NOK has decent balance-sheet strength, with roughly $6.76B in cash and short-term investments against about $2.33B in long-term debt, but the high multiple and modest margins make any growth wobble dangerous for late longs.
Why Traders Are Watching NOK’s Persistent Underperformance
NOK is on traders’ screens because the price action is screaming “distribution.” The most striking headline: Nokia stock dropped more than 7% after its Q3 report, even though it delivered higher comparable earnings and net sales. When a company like Nokia prints better numbers and the stock still gets hit, that tells you expectations were higher, or the market doubts how long the improvement will last.
On 2026/10/22, NOK did not fall alone. It was part of a cluster of European ADRs that sank between roughly 2.4% and almost 10%, while the S&P Europe Select ADR Index was down only 0.96%. That is broad risk-off in select names, but Nokia still stood out on the downside. Earlier in October, Nokia dropped around 3.2% on a day when the same index slipped just 0.3%. That points to Nokia-specific selling, not just macro jitters.
NOK has also lagged on days when traders were buying Europe. On 2026/10/15, a subset of European ADRs, including Nokia, declined in an otherwise strong session for European stocks in U.S. trading. A week later, telecom equipment names Nokia and Ericsson both ranked among notable decliners, with Nokia falling around 3%. By 2026/10/30, Nokia again showed up among the largest losers while the index was only modestly lower and flat on the week.
For short-term traders, patterns matter more than single headlines. The pattern here is clear: Nokia keeps getting sold harder than the market. That persistent relative weakness can become a self‑fulfilling trade as chart-focused players lean short into bounces, while longer‑term traders hesitate to step in until momentum changes.
Conclusion
For active traders, NOK is a textbook case of why price action always sits at the top of the checklist. Nokia has rising comparable earnings and net sales, a solid cash position, and a recognizable global brand. Yet the stock has been hammered, dropping more than 7% on its Q3 release and continuing to underperform European ADR benchmarks on multiple dates. The message from the tape is that Nokia is out of favor right now.
NOK’s elevated valuation ratios amplify that message. When a stock trades around 74 times earnings and over 2.5 times sales, the bar for future performance is high. Any concern about demand for telecom equipment, carrier capex, or the quality of Nokia’s backlog can push traders to the exits fast. That is exactly what recent selloffs across several sessions suggest.
For momentum traders, this setup demands discipline. Clean support and resistance levels around the recent lows near $7.36 and prior supply zones above $9 offer clear risk points. The goal is not to predict where Nokia will be a year from now, but to react to what the chart is telling you today. As Tim Sykes likes to remind his community, “The market doesn’t care about your opinion; it cares about your discipline. Cut losses quickly and only trust what the price action confirms.” In the same spirit of disciplined trading, as Tim Bohen, lead trainer with StocksToTrade says, “Time and experience have taught me that missed opportunities are part of the game. There’s always another setup around the corner.” This article is for educational and research purposes only and should never be taken as investment advice.
This is stock news, not investment advice. StocksToTrade News delivers real-time stock market updates tailored to highlight the key catalysts driving short-term price movements. Our coverage is designed for active traders and investors who thrive in fast-moving markets, with a focus on volatile sectors like penny stocks, AI stocks, Robinhood stocks and other momentum plays. From earnings reports and FDA approvals to mergers, new contracts, and unusual trading volume, we break down the events that can spark significant price action.
Looking to level up your trading game? Explore StocksToTrade, the ultimate platform for traders. With powerful tools designed for swing and day trading, integrated news scanning, and even social media monitoring, StocksToTrade keeps you one step ahead.
Check out our quick startup guide for new traders!
- How to Read Stock Charts: A Guide for Beginners
- Trading Plan: 6 Steps to Create One
- How To Create a Stock Watchlist
Ready to build your watchlists? Check out these curated lists:
Once your watchlist is set, take the next step and trade with confidence using StocksToTrade’s robust platform. Don’t miss out — grab your 14-day trial for just $7 and experience the edge you need to thrive in today’s fast-paced markets.