

Ondas Inc stocks have been trading down by -11.19 percent amid heightened investor concern over its latest financial performance.
Key Takeaways
- ONDS has dropped from the $7 area to below $5, signaling a sharp pullback after a strong prior run.
- Intraday trading shows ONDS fading steadily from a $5.09 open, with lower highs and heavy selling pressure.
- Ondas Inc carries low debt and high liquidity, but burns significant cash, putting focus on future execution.
- High price-to-sales and negative earnings keep ONDS firmly in speculative territory for active traders.
- Short-term traders are watching whether ONDS stabilizes above recent lows or cracks to fresh downside.
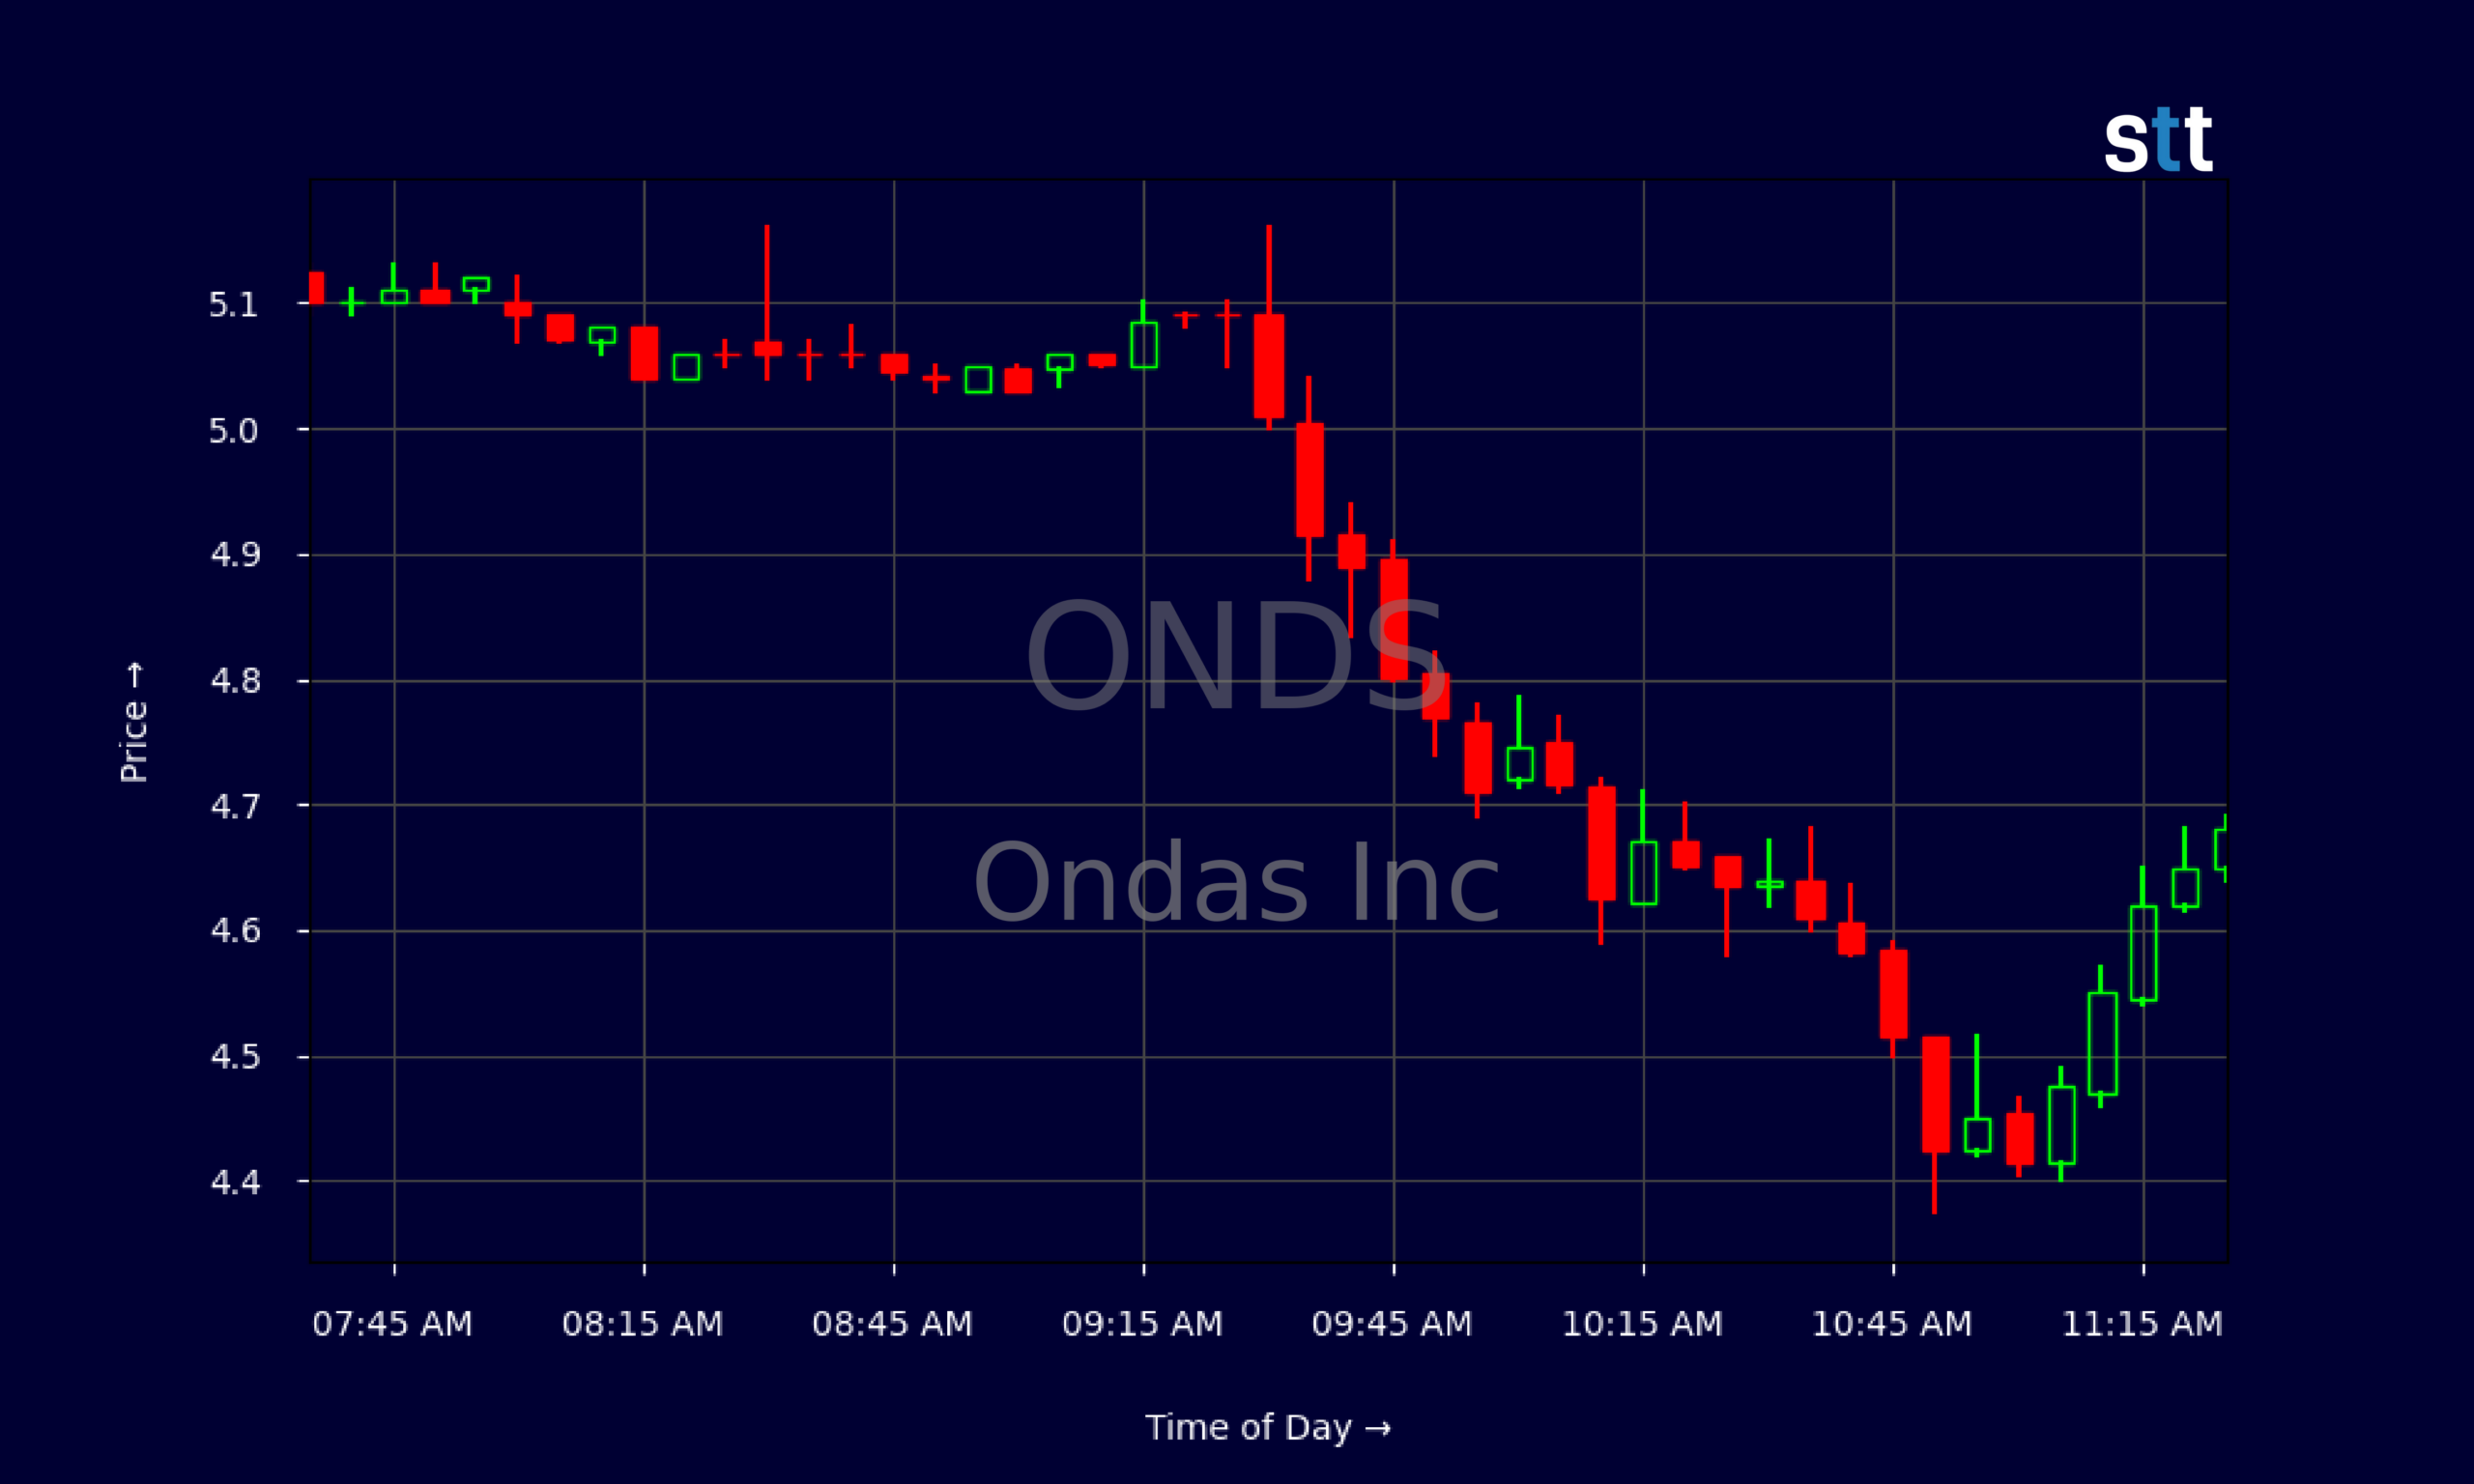
Live Update At 11:32:34 EST: On Thursday, November 05, 2026 Ondas Inc stock [NASDAQ: ONDS] is trending down by -11.19%! Discover the key drivers behind this movement as well as our expert analysis in the detailed breakdown below.
Quick Financial Overview
ONDs is trading like a classic story stock: big revenue growth on paper, but serious losses and cash burn under the surface. Over the last few sessions, Ondas Inc has fallen from the mid-$6 range to a recent close around $4.68, a sizable drawdown from its recent $7.08 high. That’s the kind of volatility momentum traders hunt, but it also demands tight risk control.
On the fundamental side, ONDS reported roughly $50.7M in revenue, with revenue growth running triple digits over the last three to five years. That looks impressive at first glance. But the income statement shows a net loss of about $88.6M in the latest quarter and negative EPS around -$0.19. ONDS is spending heavily on operating costs, research, and stock-based compensation.
More Breaking News
- AEHL Stock Slides As Volatility Fades, Traders Eye Next Move
- Duolingo Stock Jumps As Q3 Growth And Guidance Top Expectations
- SOFI Stock Slips As Analyst Warns Of $1B Headwind
- SK Hynix Rises 6% After Recent Pullback
The balance sheet is strong on liquidity. Ondas Inc lists about $1.38B in cash and short-term investments, tiny debt, and a current ratio near 9.9. That suggests ONDS has runway to keep funding operations. Still, with a price-to-sales ratio around 22.5 and negative cash flow near -$93.8M, traders need to remember they are dealing with a high-risk, high-reward profile.
Why Traders Are Watching ONDS Price Action
The ONDS chart is doing exactly what captures day traders’ attention: big swings in a short window. Over the past couple of weeks, Ondas Inc pushed up toward $7, then rolled over hard, closing recently at about $4.68. That’s roughly a 30%+ pullback from the high, showing buyers lost control and sellers stepped in aggressively.
Look at the intraday tape. ONDS opened near $5.09, briefly pushed to $5.16, and then bled lower all morning. By late morning, the stock was trading in the mid-$4.60s, with a series of lower highs and lower lows in the 5‑minute candles. That’s classic intraday downtrend structure. Every bounce in ONDS got sold, telling traders that short‑term sentiment has flipped defensive.
For pattern traders, this ONDS action looks like a potential breakdown from a recent high base. The daily closes stepping down from $6.88–$6.86 to the low‑$6s, then into the $5s, and now under $5, show a clear shift from momentum to distribution. At the same time, this sort of washout in ONDS often sets up emotional bounces if the selling gets overextended.
Fundamentals add another layer. ONDS carries huge derivative liabilities on the balance sheet and a sky‑high valuation relative to revenue. That makes Ondas Inc sensitive to any change in risk appetite. In a risk‑on tape, traders may chase ONDS for its growth story and cash pile. In a risk‑off tape, those same traits turn it into a prime target for profit‑taking and short pressure. That tension is exactly why active traders keep ONDS on watch.
Conclusion
Right now ONDS sits at an important crossroads. The stock has given back a big chunk of its recent run, with price sliding from the $7 area down into the $4s. That tells traders sentiment has cooled, at least for the moment. For Ondas Inc, the strong balance sheet and rapid revenue growth are positives, but they are battling serious losses and heavy cash burn.
For short‑term traders, ONDS is all about levels and behavior. Does it find support near recent lows and start putting in higher lows on the intraday chart? Or does Ondas Inc continue to fade, confirming a broader trend reversal from its prior spike? The 5‑minute candles show clear selling pressure, so any bounce in ONDS needs confirmation before traders get aggressive.
This is the type of name that rewards preparation, not hope. As Tim Sykes likes to say, “The market doesn’t care about your opinion, only your preparation.” And in a similar vein, as Tim Bohen, lead trainer with StocksToTrade says, “For me, trading is more about managing risk than finding the next big mover.” With ONDS, that means knowing the key support and resistance zones, understanding the cash and risk profile of Ondas Inc, and being ready to cut losses fast if the trade turns. This article is for educational and research purposes only, and every trader must make independent decisions based on their own research and risk tolerance.
This is stock news, not investment advice. StocksToTrade News delivers real-time stock market updates tailored to highlight the key catalysts driving short-term price movements. Our coverage is designed for active traders and investors who thrive in fast-moving markets, with a focus on volatile sectors like penny stocks, AI stocks, Robinhood stocks and other momentum plays. From earnings reports and FDA approvals to mergers, new contracts, and unusual trading volume, we break down the events that can spark significant price action.
Looking to level up your trading game? Explore StocksToTrade, the ultimate platform for traders. With powerful tools designed for swing and day trading, integrated news scanning, and even social media monitoring, StocksToTrade keeps you one step ahead.
Check out our quick startup guide for new traders!
- How to Read Stock Charts: A Guide for Beginners
- Trading Plan: 6 Steps to Create One
- How To Create a Stock Watchlist
Ready to build your watchlists? Check out these curated lists:
Once your watchlist is set, take the next step and trade with confidence using StocksToTrade’s robust platform. Don’t miss out — grab your 14-day trial for just $7 and experience the edge you need to thrive in today’s fast-paced markets.