

Stewards Inc stocks have been trading up by 31.39 percent after announcing a transformative strategic partnership expected to boost growth
Market Insights For SWRD Traders
- Stewards Inc has swung from $3.35 to $4.10, then collapsed near $2.08, showing extreme weekly volatility that trend traders can target.
- Recent intraday action spiked from roughly $2.50 to $5.50 in one session before closing under $3.00, signaling heavy momentum and potential short-term traps.
- Revenue is about $6.39M annually, but deep losses and a pretax margin near -117% make SWRD a high-risk, story-driven trade.
- A price-to-sales near 136 and price-to-book above 230 show Stewards Inc trades at stretched valuations that can unwind quickly on any shift in sentiment.
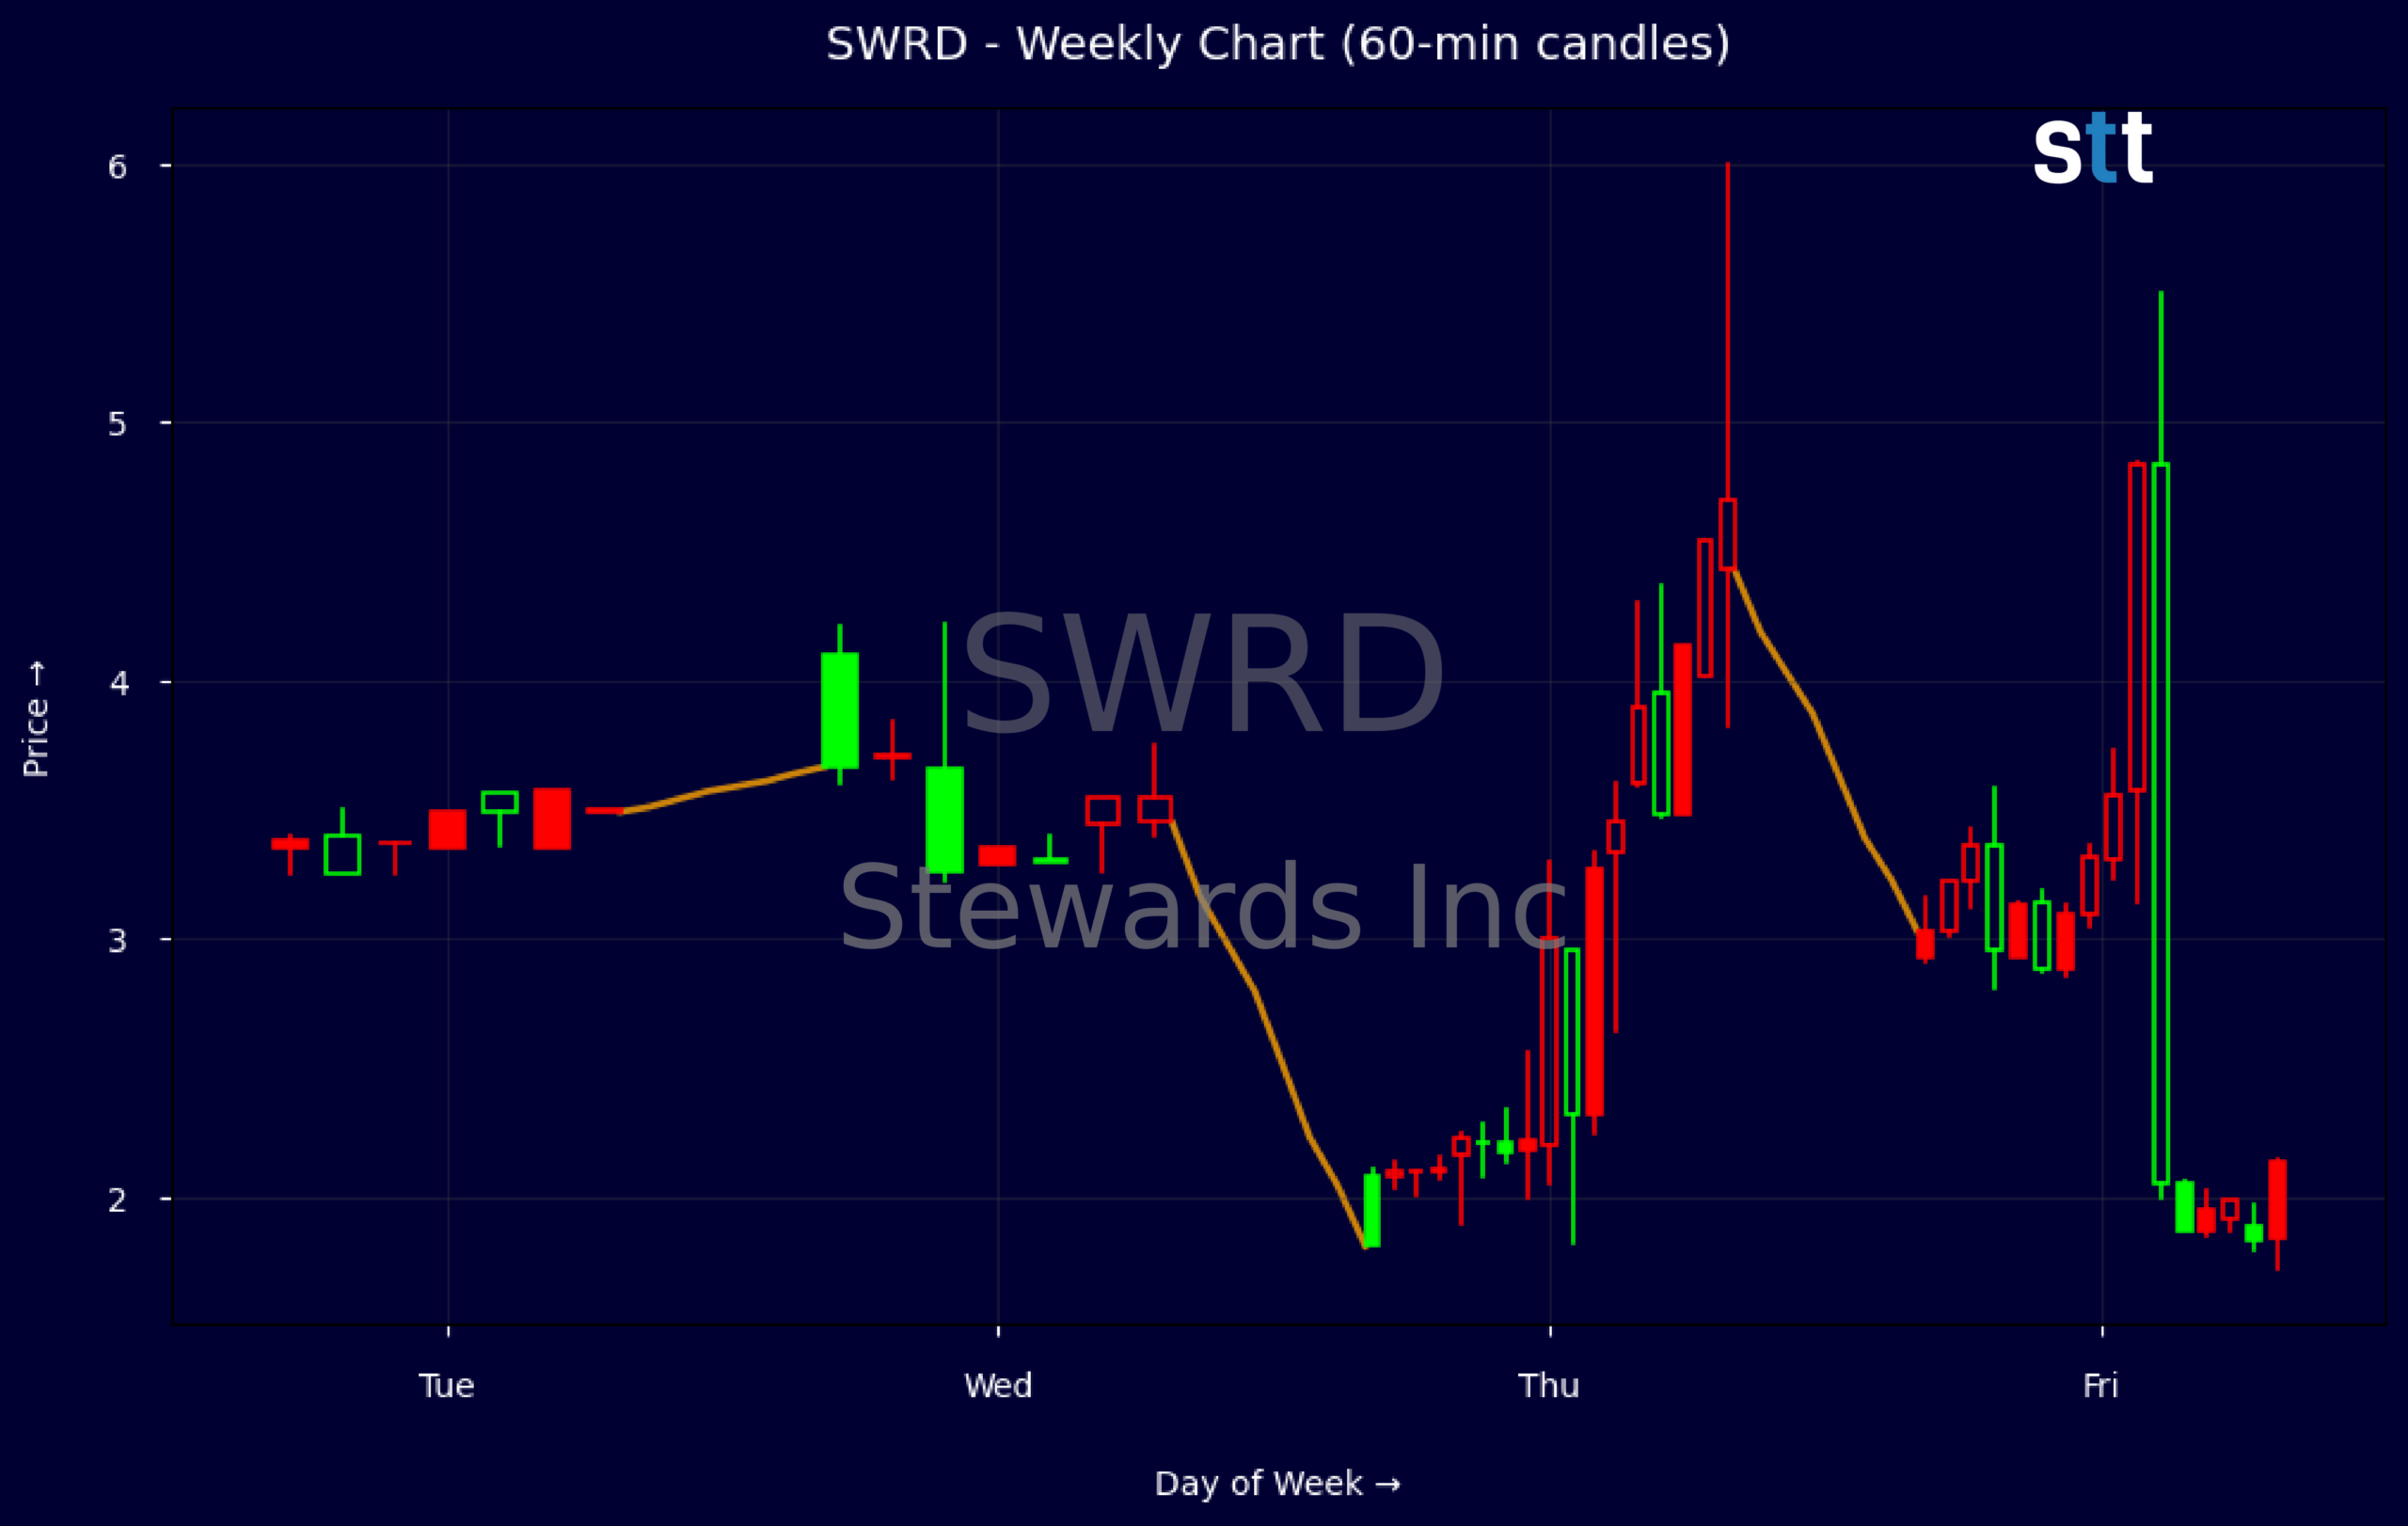
Weekly Update Sep 07 – Sep 11, 2026: On Saturday, September 12, 2026 Stewards Inc stock [NASDAQ: SWRD] is trending up by 31.39%! Discover the key drivers behind this movement as well as our expert analysis in the detailed breakdown below.
Finance industry expert:
Analyst sentiment – negative
SWRD operates as a highly speculative, early‑stage finance platform with weak fundamentals and an extreme valuation. Revenue is only ~$3.5m for the latest quarter and ~$6.4m TTM, against an enterprise value of ~$740m, driving an unsustainable 135x price‑to‑sales and ~33x price‑to‑free‑cash multiple despite persistent losses. Q2 2026 EBIT of –$3.9m and pretax margin near –117% underscore structural unprofitability. Leverage is heavy (LT debt ~$116m, leverage ratio 86.8x), equity is thin (~$2m), and working capital is negative.
Technically, SWRD is in a high‑volatility, short‑term trading regime rather than a stable trend. The weekly tape shows violent price dislocations: a spike from ~3.35 to 4.10, then a gap down to 1.81–2.08, followed by a rebound toward 2.93, indicating aggressive speculative flows and likely short‑covering. Intraday 5‑minute candles (with expanding ranges and volume around the 2.80–3.00 zone) suggest a battleground level. The key actionable level is $2.80: below it, downside momentum likely resumes; above $3.50, a sharp squeeze is possible.
More Breaking News
- SNAP Stock Slips As Ads, Regulation And Insider Selling Weigh
- BBAI Stock Pops As BigBear.ai Lands $225M In Federal AI Deals
- SPCX Slides As Headline Risk And Competition Hammer Sentiment
- WULF Stock Climbs As AI Data-Center Funding Risks Mount
With no material news catalysts disclosed and no clear path to profitability, SWRD badly lags Finance and Credit Finance benchmarks on quality, balance sheet strength, and earnings visibility. The stock is trading purely on liquidity and sentiment. I view fair speculative value closer to $1.50–2.00 near term, with resistance at $3.50 and secondary resistance around $4.00; support sits at $2.00, then $1.50. My decisive stance: avoid as an investment; only highly tactical traders should engage.
Quick Financial Overview
Stewards Inc (SWRD) is a classic high-volatility, high-risk trading vehicle. Weekly data shows price lifting from $3.35 to $4.10, then collapsing to around $2.08 before rebounding near $2.93. That kind of range, combined with thin structure, tells traders they are dealing with a momentum name where entries and exits matter more than long-term conviction.
The intraday 5‑minute snapshot reinforces this. Price ripped from roughly $2.50 to $5.50 and then faded back under $3.00 into the close. That is a textbook blow‑off move: early longs are rewarded, late chasers get trapped, and short-term mean reversion traders find opportunity on the backside of the spike. For SWRD, it signals that liquidity can vanish quickly once the surge exhausts.
On the fundamental side, Stewards Inc prints about $6.39M in revenue but carries a pretax margin of roughly -116.7%, with quarterly net loss near $7.24M and EBITDA around -$3.95M. The balance sheet shows total assets near $174M, but equity of only about $2.01M and long-term debt around $116.35M, driving a leverage ratio near 86.8. Valuation is extreme: price-to-sales about 135.77 and price-to-book near 234.96, with book value per share at $0.01. For traders, those numbers mean sentiment and speculation dominate, and any disappointment can trigger sharp drawdowns.
Conclusion
Stewards Inc (SWRD) currently trades like a pure momentum play wrapped around a weak underlying business. The weekly path from $3.35 to $4.10 and then down near $2.08 shows how quickly control can shift between bulls and bears. When you combine that with an intraday spike from the mid‑$2s to mid‑$5s and a close back under $3, you are looking at a chart driven by aggressive short-term traders rather than steady accumulation.
Financially, SWRD burns cash, posts negative earnings, and carries heavy debt against very thin equity. A pretax margin around -117% and significant interest expense mean the company needs either much higher revenue or outside capital to stabilize. The rich multiples on price-to-sales and price-to-book tell traders that the stock is priced for hope, not current results, which can work for quick trades but rarely ends well for late buyers.
For traders, the key is to treat Stewards Inc as a trade, not a comfort holding. Clear intraday levels around the recent spike high near $5.50 and the recent lows around $2.00 can frame risk and reward. As the trading expert behind this review, I will repeat the rule I teach every day: “In names like SWRD, your edge is not predicting the story, it is defining your risk before you click the buy button.” That is why process and planning matter so much in volatile names like this; as Tim Bohen, lead trainer with StocksToTrade says, “Preparation is half the trade. By the time the bell rings, my decisions are nearly made.”. This stock belongs on watchlists for disciplined momentum traders only, and strictly for educational and research-focused strategies. “,”scores”:{“risk-level”:”high”},”trade”:”false
This is stock news, not investment advice. StocksToTrade News delivers real-time stock market updates tailored to highlight the key catalysts driving short-term price movements. Our coverage is designed for active traders and investors who thrive in fast-moving markets, with a focus on volatile sectors like penny stocks, AI stocks, Robinhood stocks and other momentum plays. From earnings reports and FDA approvals to mergers, new contracts, and unusual trading volume, we break down the events that can spark significant price action.
Looking to level up your trading game? Explore StocksToTrade, the ultimate platform for traders. With powerful tools designed for swing and day trading, integrated news scanning, and even social media monitoring, StocksToTrade keeps you one step ahead.
Check out our quick startup guide for new traders!
- How to Read Stock Charts: A Guide for Beginners
- Trading Plan: 6 Steps to Create One
- How To Create a Stock Watchlist
Ready to build your watchlists? Check out these curated lists:
Once your watchlist is set, take the next step and trade with confidence using StocksToTrade’s robust platform. Don’t miss out — grab your 14-day trial for just $7 and experience the edge you need to thrive in today’s fast-paced markets.