
Nokia Corporation Sponsored stocks have been trading down by -9.44 percent amid renewed concerns over 5G demand and profitability.
Key Takeaways
- Nokia stock is down more than 7% despite reporting higher Q3 comparable earnings and net sales.
- Telecom equipment providers Nokia and Ericsson were among the notable continental European ADR decliners, falling roughly 3% and 1.7%, respectively.
- Several European ADRs — especially Nokia, Banco Santander, BBVA, ING Group, Biodexa Pharmaceuticals, BHP Group, Lloyds Banking Group and HSBC — underperformed sharply on a day when the S&P Europe Select ADR Index fell 0.96%, with drops ranging from roughly 2.4% to nearly 10%.
- Several European ADRs, primarily biotech names plus Nokia, underperformed sharply: argenx fell 14%, Trinity Biotech 7.7%, Biodexa 5.5%, Silence Therapeutics 5%, Cellectis 3.7%, Autolus 3.6%, BioNTech 3%, and Nokia 3.2%, all on a day when the broader European ADR index was only down 0.3%.
- A subset of European ADRs, including Nokia, Cellectis, ING, Materialise, Biodexa Pharmaceuticals, Trinity Biotech, NuCana, and BHP Group, declined modestly to sharply in an otherwise strong session for European stocks in US trading.
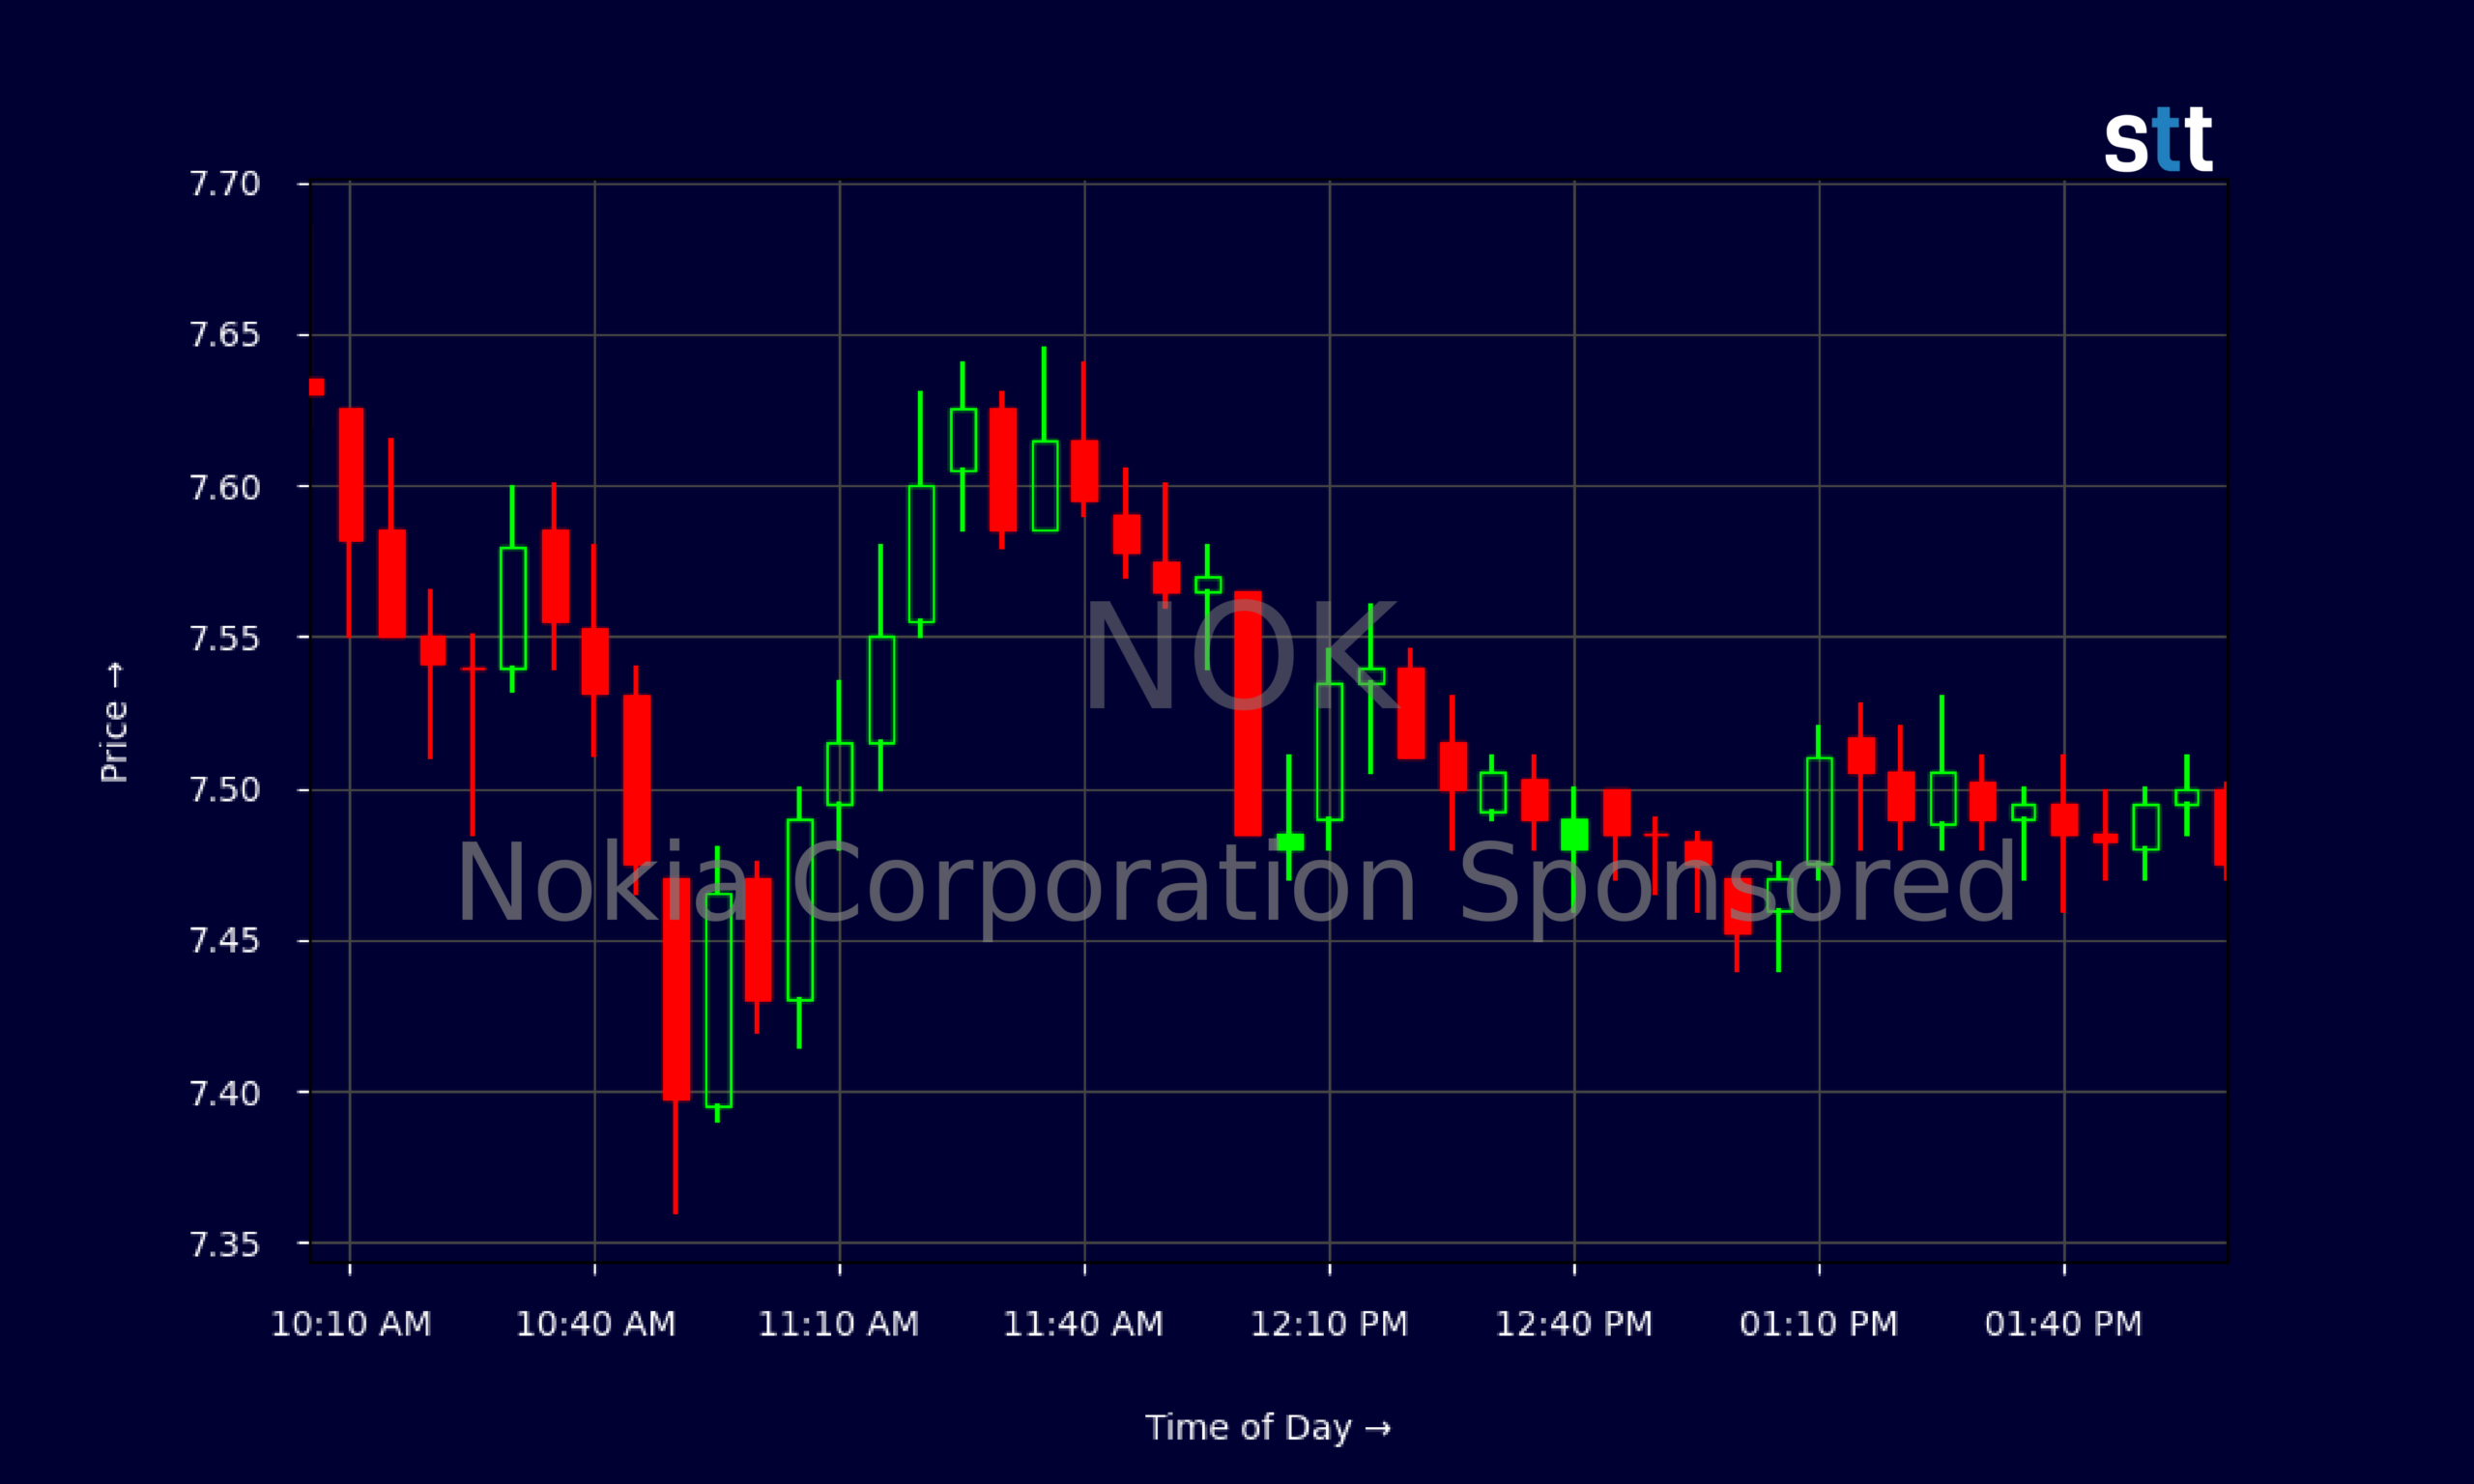
Live Update At 14:04:33 EST: On Thursday, November 05, 2026 Nokia Corporation Sponsored stock [NYSE: NOK] is trending down by -9.44%! Discover the key drivers behind this movement as well as our expert analysis in the detailed breakdown below.
Quick Financial Overview
NOK has been in a steady downtrend on the daily chart. From a recent high near $10.31 on 2026/10/12, Nokia Corporation Sponsored has slid to about $7.48 on 2026/11/05. That is roughly a 27% drawdown in just a few weeks, showing traders are selling strength and fading every bounce.
The last three sessions underline that pressure. NOK closed at $8.56 on 2026/10/30, then $8.30 and $8.48, before breaking lower to $8.26 and then $7.48. The Q3 reaction was harsh: the stock dropped more than 7% even though Nokia reported higher comparable earnings and net sales, a clear sign that the market wanted more on guidance or margins.
Intraday, NOK’s 5‑minute chart on 2026/11/05 shows a heavy fade from the $8s in premarket down into the mid‑$7s, then choppy sideways trading between roughly $7.44 and $7.55. That kind of tight range after a gap down often signals trapped longs and cautious dip buyers.
More Breaking News
- Unity Software Stock Pops As Google AI Deal Ignites Bullish Targets
- CDW Stock Climbs As Analysts Hike Targets And Board Strengthens
- NOK Stock Slides As Traders Question Rally After Earnings
- BitMine Immersion Technologies Falls 2% Today
Fundamentally, Nokia generated about $19.22B in revenue with a price‑to‑sales ratio near 2.58 and a rich P/E around 74.4. With return on equity under 6% and leverage at 1.8, traders may see NOK as fully priced for now, which helps explain why bad sentiment is hitting the stock so hard.
Why Traders Are Watching NOK’s Persistent Weakness
NOK is not just having a bad day. It is stuck in a pattern of underperformance that active traders ignore at their own risk. The headline move was that Nokia stock fell more than 7% after Q3, even though the company delivered higher comparable earnings and net sales. When a stock sells off on “good” numbers, the message is simple: expectations were higher, or the street does not buy the outlook.
That reaction did not come out of nowhere. Earlier in October, Nokia dropped about 3.2% on a day when the broader European ADR index was only off 0.3%. On another session, NOK and Ericsson both slid, with Nokia down roughly 3% versus Ericsson’s 1.7%. The whole telecom equipment group looked heavy, but Nokia’s bigger decline made it the weak link.
Nokia’s name has also kept popping up among the sharpest European ADR laggards. On 2026/10/22, NOK sat alongside big European banks and other names in a selloff where the S&P Europe Select ADR Index fell just 0.96%, but individual names dropped as much as nearly 10%. On 2026/10/30, Nokia again ranked among the largest decliners even though the index was only modestly lower and flat on the week.
For short‑term trading, that repeated relative weakness matters more than any single headline. Momentum traders look for names that either lead on the way up or bleed on the way down. Right now, NOK is clearly in the second camp. The stock has been red even on strong days for European ADRs, which tells day traders that rallies are being sold, not chased.
Conclusion
For active traders, NOK is a live case study in how sentiment can steamroll decent fundamentals. Nokia Corporation Sponsored has real revenue, a solid balance sheet, and rising comparable earnings, yet the stock keeps getting hit across multiple sessions and market backdrops. When a name sells off on good news, then continues to lag on neutral and strong days, that is a strong trend signal.
Short‑biased traders will see NOK’s pattern of gap downs and weak bounces as an opportunity, especially with the daily downtrend firmly in place and intraday charts showing failed attempts to reclaim the $8 handle. Long‑biased swing traders, on the other hand, need to be ruthless about risk. A rich P/E, modest returns on capital, and ongoing sector pressure in telecom equipment argue against blindly buying dips.
NOK remains on many watchlists because persistent losers can also offer sharp oversold bounces. But those trades demand a plan. As Tim Bohen, lead trainer with StocksToTrade says, “Preparation is half the trade. By the time the bell rings, my decisions are nearly made.” As Tim Sykes likes to say, “The market doesn’t care about your opinion; it only cares about your discipline.” For anyone trading Nokia, that means respecting the trend, cutting losses fast, and letting price action — not hope — drive every decision. This analysis is for educational and research purposes only and is not investment advice.
This is stock news, not investment advice. StocksToTrade News delivers real-time stock market updates tailored to highlight the key catalysts driving short-term price movements. Our coverage is designed for active traders and investors who thrive in fast-moving markets, with a focus on volatile sectors like penny stocks, AI stocks, Robinhood stocks and other momentum plays. From earnings reports and FDA approvals to mergers, new contracts, and unusual trading volume, we break down the events that can spark significant price action.
Looking to level up your trading game? Explore StocksToTrade, the ultimate platform for traders. With powerful tools designed for swing and day trading, integrated news scanning, and even social media monitoring, StocksToTrade keeps you one step ahead.
Check out our quick startup guide for new traders!
- How to Read Stock Charts: A Guide for Beginners
- Trading Plan: 6 Steps to Create One
- How To Create a Stock Watchlist
Ready to build your watchlists? Check out these curated lists:
Once your watchlist is set, take the next step and trade with confidence using StocksToTrade’s robust platform. Don’t miss out — grab your 14-day trial for just $7 and experience the edge you need to thrive in today’s fast-paced markets.