
Amid negative sentiment around DRAM and chip demand, Roundhill T-REX 2X Long DRAM Daily Target stocks have been trading down by -14.9 percent.
Market Insights For RAM Traders
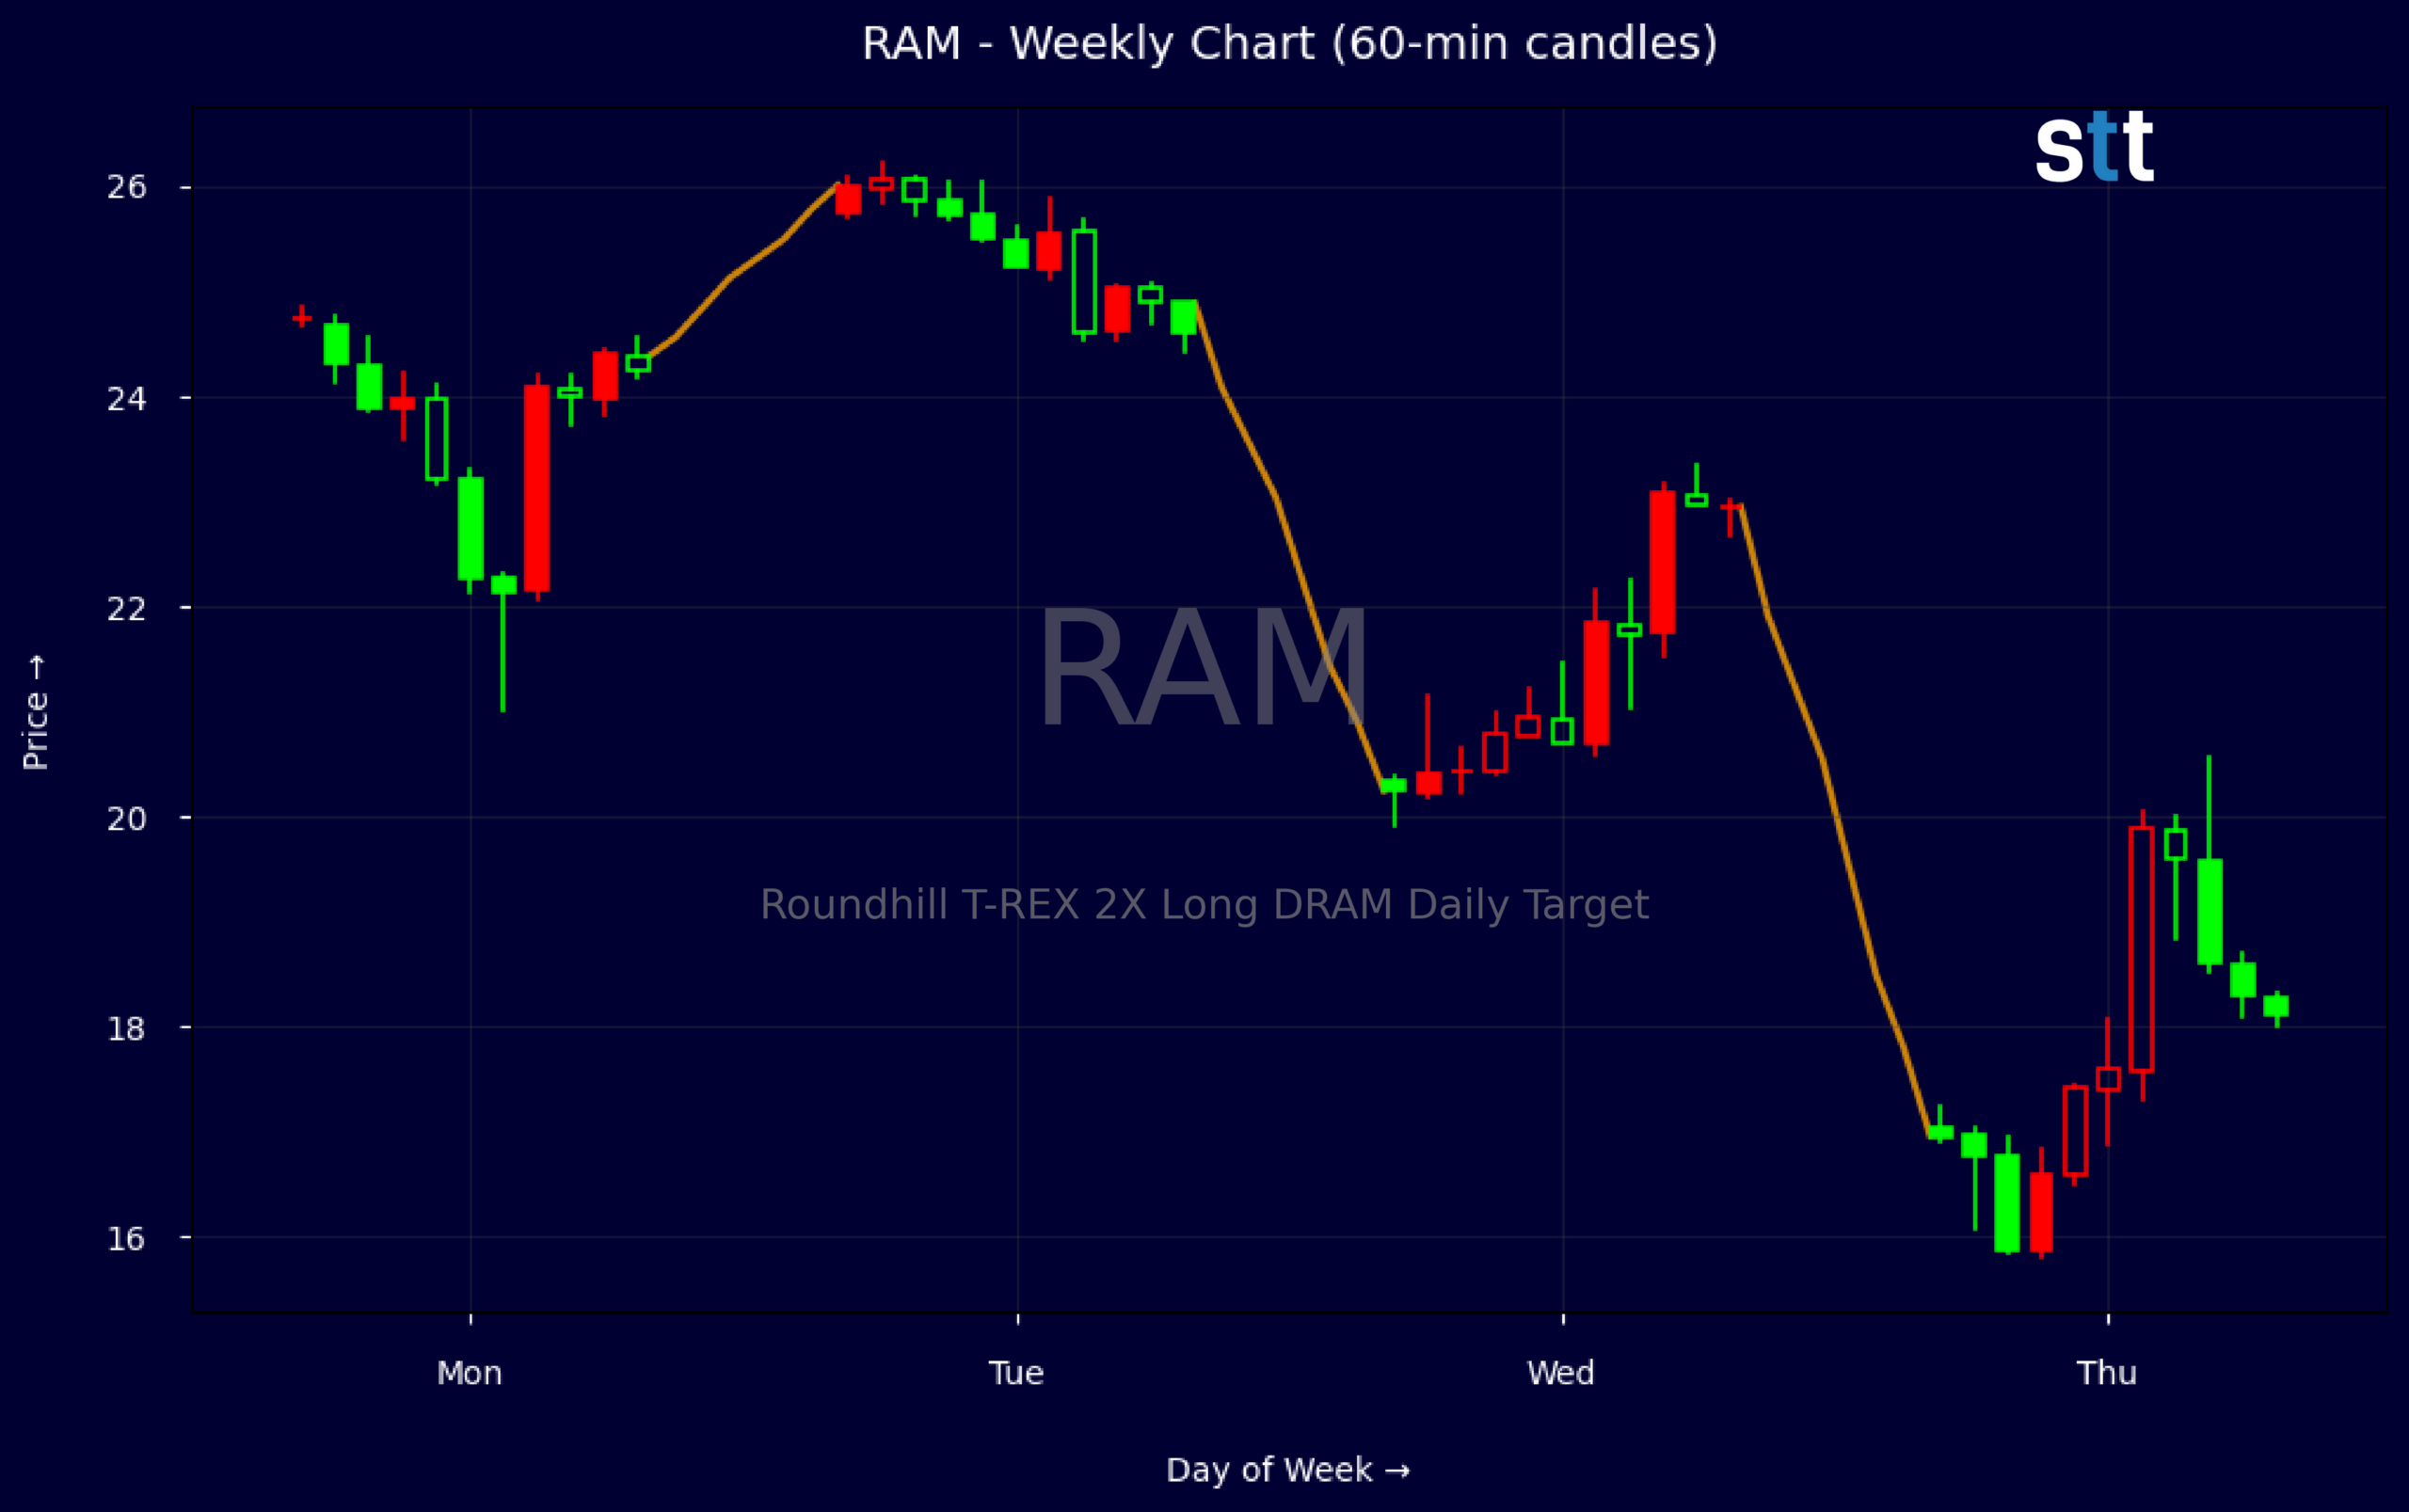
- Roundhill T-REX 2X Long DRAM Daily Target has swung from a late-June push above $26 to an early-July collapse under $17, signaling aggressive volatility.
- Weekly candles show a sharp breakdown from the $25 area to a low near $15.85, putting leveraged DRAM bulls under pressure.
- Intraday data confirms heavy selling, with price fading from about $20 to sub-$17 during a single session.
- With no clear fundamental ratio data, traders must lean heavily on price, volume, and broader DRAM sentiment.
- Key levels around $21 on the upside and $16 on the downside now frame the near-term battleground for RAM.
Weekly Update Jun 29 – Jul 03, 2026: On Saturday, July 04, 2026 Roundhill T-REX 2X Long DRAM Daily Target stock [BATS Global Markets: RAM] is trending down by -14.9%! Discover the key drivers behind this movement as well as our expert analysis in the detailed breakdown below.
Finance industry expert:
Analyst sentiment – negative
RAM’s fundamental profile is effectively opaque: every key ratio field, including revenue, margins, leverage, and returns on equity or assets, is blank. That prevents any serious underwriting of earnings quality, capital intensity, or balance sheet risk, and it blocks comparison versus sector medians on P/E, P/B, or P/CF. The stock therefore trades as a story and liquidity vehicle rather than a fundamentals‑anchored Finance / Diversified Financial Services holding, elevating both volatility and downside risk.
Technically, RAM has transitioned from stability to disorder. The stock held 23.9–26.2 on 6/29–6/30, then gapped sharply lower to close 20.44 on 7/1 and 16.99 on 7/2, a two‑day drawdown exceeding 30%, consistent with capitulation volume on 5‑minute candles. Dominant trend is decisively bearish. The key actionable level is former support at 20; any reflex rally into 19.75–20.25 is an attractive, clearly defined area to initiate or add shorts.
More Breaking News
- CareDx Stock Jumps As Earnings Beat And Guidance Surge Draw Trader Focus
- RKT Stock Dips After Big Q3 Earnings Beat
- RIG Stock Builds Massive Backlog As Valaris Deal Nears Close
- SOFI Stock Slips As Analyst Warns Of $1B Headwind
With no identifiable company‑specific news provided, the violence of the drawdown versus relatively stable Finance and Diversified Financial Services benchmarks signals stock‑specific risk, likely tied to undisclosed events, positioning, or microstructure. I assign a negative tactical outlook: base case is continued distribution below 20 with support around 15–16 and secondary air‑pocket risk toward 12 if selling persists. Resistance sits at 20 and then 23; absent a concrete, positive catalyst, rallies into that band should be sold, not bought.
Quick Financial Overview
Roundhill T-REX 2X Long DRAM Daily Target is a leveraged product tied to DRAM-related exposure, so price moves can be fast and exaggerated. Over the last several weeks, RAM traded from roughly $23.89 up to a high just above $26 before reversing sharply. That push to $25.84–$26.22 suggests traders were willing to chase upside in DRAM names, but the subsequent breakdown shows how quickly sentiment can flip in a leveraged structure.
The weekly chart now tells a story of momentum exhaustion. After peaking near $26 in late June 2026, RAM slid to a weekly close around $20.44, then further to $16.99, with a low near $15.85. That sequence is a textbook momentum unwind: new highs, failed continuation, then an air pocket lower. For short-term traders, this speaks to elevated risk but also expanding opportunity if levels are respected and risk is sized properly.
Financial ratio data for RAM is effectively blank, which is typical for a highly targeted leveraged vehicle where the focus is on underlying index performance, not classic earnings or margin metrics. That pushes traders to treat RAM as a trading instrument rather than a traditional equity. Without revenue, earnings, or valuation ratios to lean on, price structure, sector sentiment, and broader chip-cycle narratives carry more weight. In this context, the rapid swing from the $20s to the mid-teens should be seen as a function of leverage reacting to underlying DRAM moves.
Conclusion
This is stock news, not investment advice. StocksToTrade News delivers real-time stock market updates tailored to highlight the key catalysts driving short-term price movements. Our coverage is designed for active traders and investors who thrive in fast-moving markets, with a focus on volatile sectors like penny stocks, AI stocks, Robinhood stocks and other momentum plays. From earnings reports and FDA approvals to mergers, new contracts, and unusual trading volume, we break down the events that can spark significant price action.
Looking to level up your trading game? Explore StocksToTrade, the ultimate platform for traders. With powerful tools designed for swing and day trading, integrated news scanning, and even social media monitoring, StocksToTrade keeps you one step ahead.
Check out our quick startup guide for new traders!
- How to Read Stock Charts: A Guide for Beginners
- Trading Plan: 6 Steps to Create One
- How To Create a Stock Watchlist
Ready to build your watchlists? Check out these curated lists:
Once your watchlist is set, take the next step and trade with confidence using StocksToTrade’s robust platform. Don’t miss out — grab your 14-day trial for just $7 and experience the edge you need to thrive in today’s fast-paced markets.