

Leverage Shares 2X Long SNDK Daily ETF faces heightened downside pressure as stocks have been trading down by -12.87 percent.
Key Takeaways
- Price action in SNDG shows a sharp slide from recent highs above $8 to the low-$3s, signaling heavy profit-taking and momentum loss.
- Recent daily candles highlight wide ranges and big intraday swings, making SNDG a pure volatility vehicle for short-term trading.
- Intraday SNDG data around $3 shows tight consolidation after the selloff, hinting at a potential bounce or breakdown setup.
- With no clear fundamental ratios reported, SNDG trading remains driven mainly by technicals and sentiment around the underlying SNDK exposure.
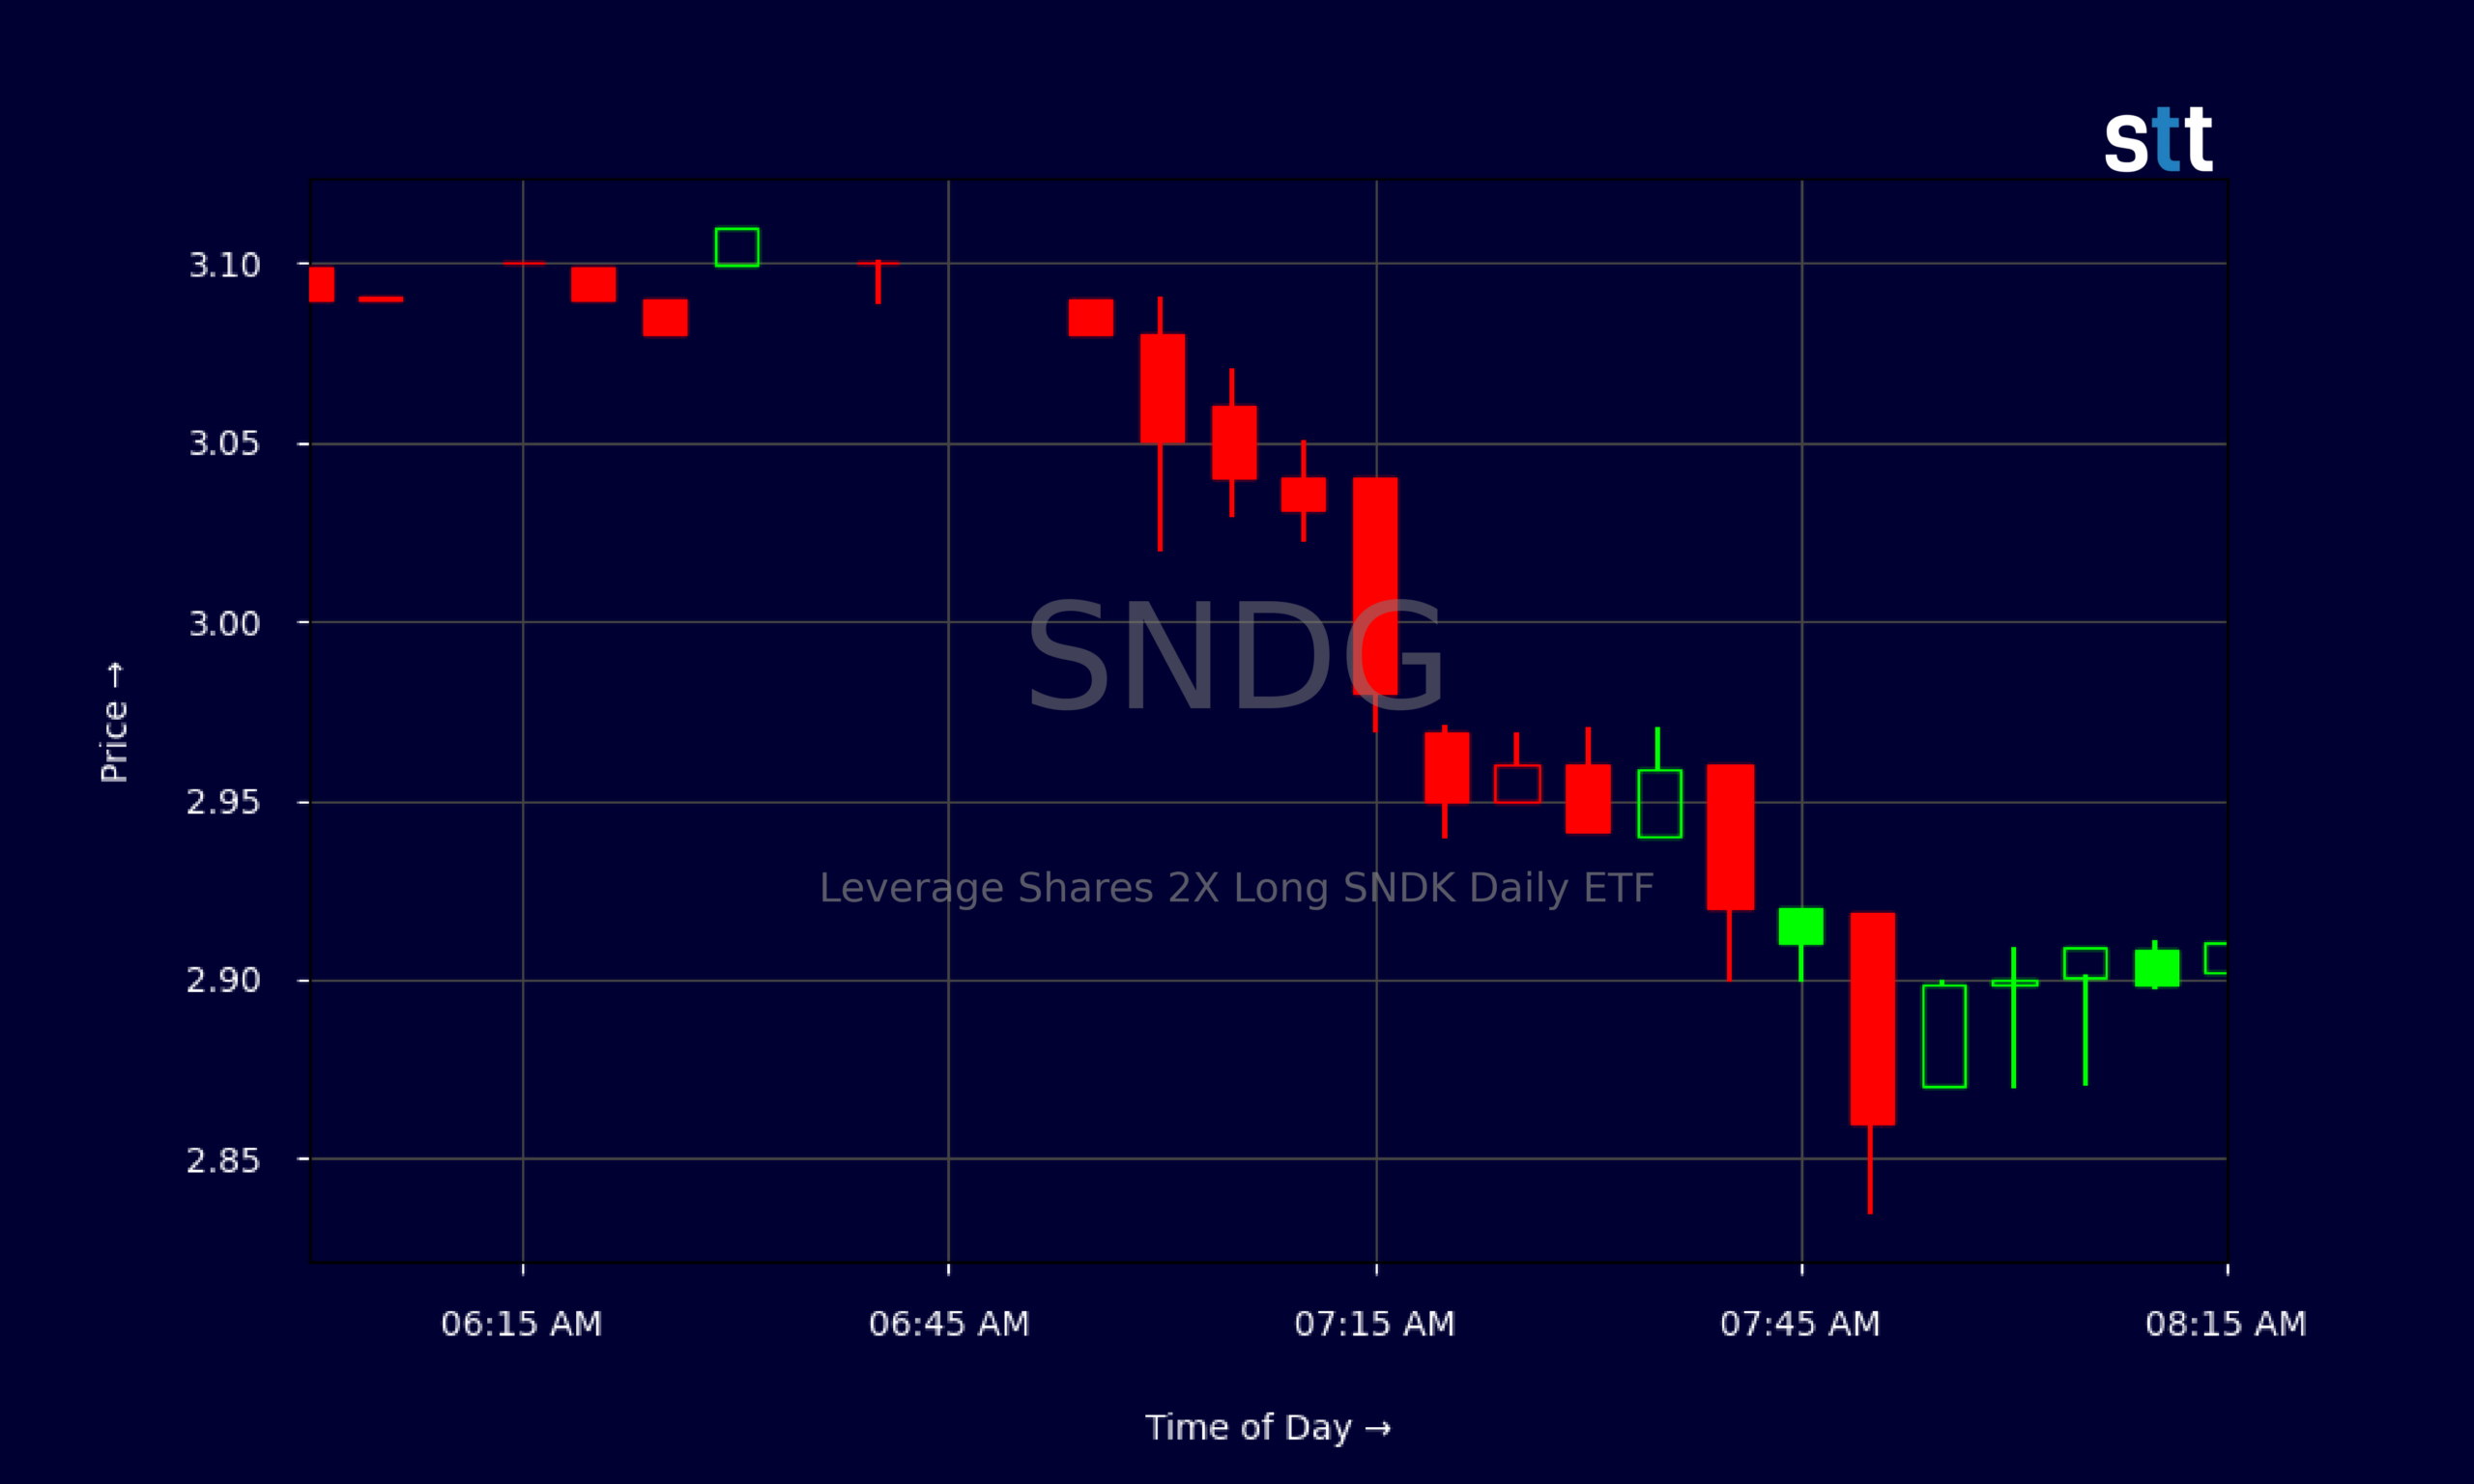
Live Update At 08:18:45 EST: On Thursday, November 05, 2026 Leverage Shares 2X Long SNDK Daily ETF stock [BATS Global Markets: SNDG] is trending down by -12.87%! Discover the key drivers behind this movement as well as our expert analysis in the detailed breakdown below.
Quick Financial Overview
Leverage Shares 2X Long SNDK Daily ETF, ticker SNDG, is built for leverage and speed, not for calm and comfort. The chart tells the whole story. In mid-2026, SNDG traded above $8, but over the recent sessions it has collapsed into the $3s, losing more than half its value from the highs. That kind of move is normal for a 2X leveraged product, and traders need to respect it.
On the daily chart, SNDG printed a series of lower highs and lower lows. The close dropped from $7.45 on 2026/10/12 to $3.34 on 2026/11/04. Each bounce has been weaker than the last. That steady downtrend suggests sentiment has flipped from aggressive dip-buying to more cautious trading.
More Breaking News
- EPAM Stock Climbs As Wall Street Lifts Price Targets
- Wetour Robotics Limited Falls 4% as Slide Continues
- CIFR Stock Slumps As Texas Policy Risk Rattles Cipher Mining
- RIOT Stock Slides As Wall Street Slashes Price Targets
Because SNDG is an ETF with leverage, traditional valuation ratios like P/E or margins in the key-ratio feed don’t guide much. They are essentially blank here. For active traders, SNDG is a vehicle to express a short-term view on its Sandisk-linked exposure, amplified 2X, rather than a classic long-term holding. The main “fundamental” is price itself, along with liquidity, volume, and volatility.
Why Traders Are Watching SNDG Price Action
SNDG has the kind of movement that active traders hunt every day. The ETF ran as high as $8.01 on 2026/10/12 and then started a steep downhill ride. By 2026/10/30 it closed at $4.16, and the slide continued to a $3.34 close on 2026/11/04. For a leveraged product, that speed cuts both ways. Big gains on the way up, big pain on the way down.
What stands out on the SNDG daily chart is how clean the trend looks. After the $8 area, you see a stair-step of lower closes: $7.45, $7.39, then into the mid-$6s, then $5s, then $4s. Every attempt by SNDG to reclaim prior highs faded quickly. That tells traders the bears have been in control, and dip-buyers have not been able to hold the line.
Zooming into the intraday data, SNDG is now trading around $3 with small 5-minute candles between roughly $2.87 and $3.11. That’s classic post-selloff consolidation. The wild downside move has cooled, but SNDG hasn’t reversed. For momentum traders, this is where the next big leg often starts — either a sharp short squeeze back toward $4–$5 or a breakdown into fresh lows.
Because SNDG is 2X long, anyone holding through multiple red days experiences the compounding drag. Day traders and swing traders in this ETF usually treat it as a short-term tool, respecting tight risk levels and using the volatility as a weapon, not a surprise.
Conclusion
Right now, SNDG is a textbook example of why traders must understand leveraged ETFs before touching them. The Leverage Shares 2X Long SNDK Daily ETF gave traders massive upside when it pushed into the $7–$8 range, and then punished anyone who overstayed as it bled into the low-$3s. The downtrend is clear, and the current intraday consolidation around $3 puts SNDG at a technical tipping point.
Traders watching SNDG should focus on key levels, not hope. A sustained push above recent consolidation highs near $3.10–$3.20 could trigger momentum back toward the $3.50–$4 zone. Failure there, combined with a crack below the recent intraday lows near $2.85–$2.90, opens the door to new downside. With no helpful earnings ratios or classic fundamentals in play, SNDG remains a pure trading product tied to its underlying SNDK exposure. In this kind of fast-moving product, chasing strength or panic-selling weakness can be especially dangerous, which is why it helps to remember the mindset behind disciplined entries and exits.
As Tim Sykes likes to say, “The market doesn’t care about your opinion, only your discipline.” As Tim Bohen, lead trainer with StocksToTrade says, “I never chase price. The best opportunities allow me to enter on my terms, not when I’m feeling pressured.”. For SNDG, that discipline means cutting losses fast, trading the chart in front of you, and never confusing a leveraged ETF with a safe long-term holding. This analysis is for educational and research purposes only, but the price action lessons SNDG is offering right now are real and worth studying.
This is stock news, not investment advice. StocksToTrade News delivers real-time stock market updates tailored to highlight the key catalysts driving short-term price movements. Our coverage is designed for active traders and investors who thrive in fast-moving markets, with a focus on volatile sectors like penny stocks, AI stocks, Robinhood stocks and other momentum plays. From earnings reports and FDA approvals to mergers, new contracts, and unusual trading volume, we break down the events that can spark significant price action.
Looking to level up your trading game? Explore StocksToTrade, the ultimate platform for traders. With powerful tools designed for swing and day trading, integrated news scanning, and even social media monitoring, StocksToTrade keeps you one step ahead.
Check out our quick startup guide for new traders!
- How to Read Stock Charts: A Guide for Beginners
- Trading Plan: 6 Steps to Create One
- How To Create a Stock Watchlist
Ready to build your watchlists? Check out these curated lists:
Once your watchlist is set, take the next step and trade with confidence using StocksToTrade’s robust platform. Don’t miss out — grab your 14-day trial for just $7 and experience the edge you need to thrive in today’s fast-paced markets.