

PicoCELA Inc. stocks have been trading up by 155.11 percent amid strong optimism from its most recent technological partnership news.
Market Insights For Active Traders
- Weekly chart shows PCLA exploding from the $1.30 area to a $7.08 high before pulling back toward the mid-$5s, signaling an extremely speculative tape.
- Intraday 5‑minute action shows a violent range between roughly $4.50 and $7.40, with a close near $6.62, highlighting heavy day-trading interest.
- Revenue of about $544.7M against an enterprise value near $62.4M gives PicoCELA Inc. a relatively low sales multiple, but deeply negative returns flag real business pressure.
- Balance sheet carries over $534.9M in cash and sizable working capital, giving PCLA liquidity to navigate current losses while traders focus on momentum swings.
- Key ratios show sharp negative profitability and return metrics, so price action in PCLA is being driven more by speculation than by fundamentals right now.
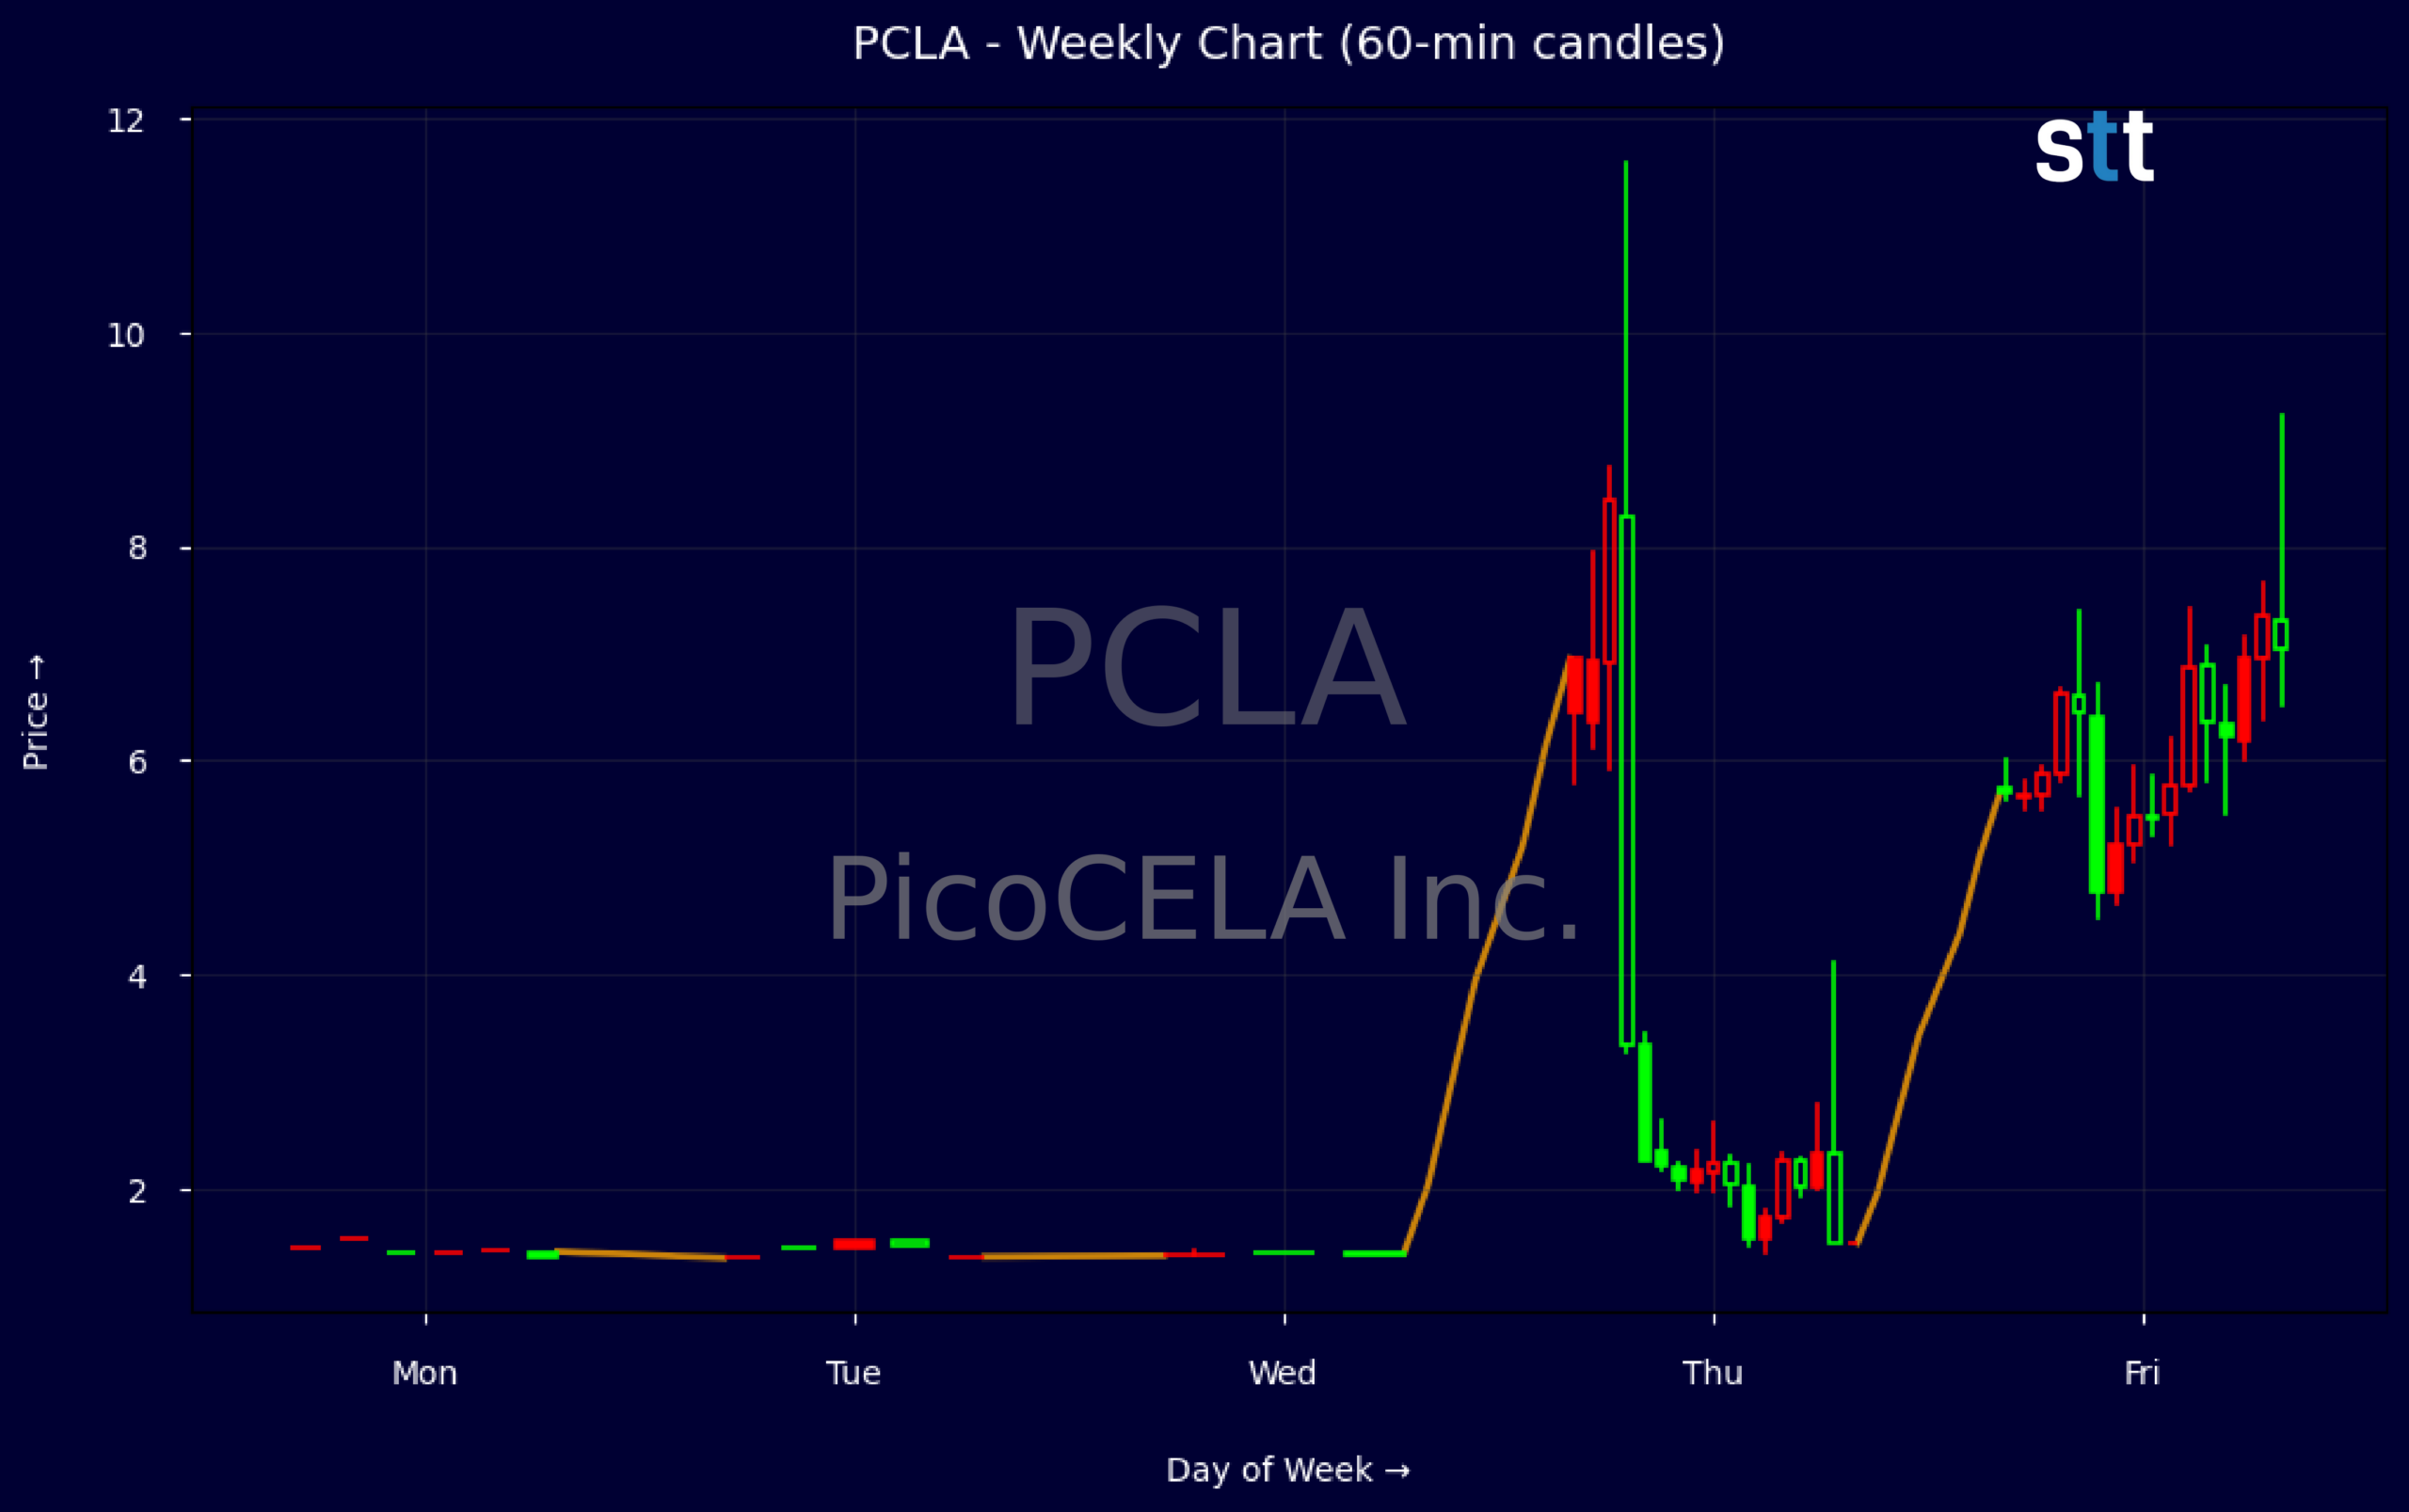
Weekly Update May 18 – May 22, 2026: On Saturday, May 23, 2026 PicoCELA Inc. stock [NASDAQ: PCLA] is trending up by 155.11%! Discover the key drivers behind this movement as well as our expert analysis in the detailed breakdown below.
Media industry expert:
Analyst sentiment – neutral
PCLA sits in a niche media/telecom position with modest scale (c. $545m revenue) but weak profitability, as evidenced by a deeply negative pre‑tax margin of roughly ‑114% and ROA/ROE of ‑7.6% and ‑16%. The balance sheet, however, is surprisingly solid: equity of c. $470m versus total liabilities of $617m, long‑term debt only ~$10m, and leverage ratio 2.3x. Cash of ~$535m and working capital of ~$527m provide substantial liquidity and strategic optionality.
Technically, PCLA has undergone a violent regime shift. The stock based in the $1.35–1.45 area, then exploded to a $7.08 high before closing the week at $5.74, signaling a high‑momentum, high‑volatility uptrend with profit‑taking. Intraday 5‑minute candles show heavy volume spikes on breakouts and sharp wicks, indicating aggressive trading interest and short‑term exhaustion. The key actionable level is support around $6.00–6.20; sustained trade above $6.20 favors a retest of the $7.00 zone.
More Breaking News
- SNAP Stock Slides As Ads, Regulation And Insider Sale Weigh
- RIG Stock Climbs As Backlog And Valaris Deal Transform Outlook
- MEOH Stock Jumps As Earnings Beat Fuels Buyback Momentum
- CMCSA Stock Grinds Higher As Restructuring Meets Earnings Beat
With no fresh fundamental news, the move appears technically and liquidity driven rather than thesis‑driven, especially relative to steadier Media and Telecom benchmarks that trade on mature cash flows and mid‑single‑digit growth. PCLA’s valuation (EV/revenue ~0.11, P/S ~1.7, P/B ~2.0) implies optionality on a turnaround but requires clear execution to justify recent price spikes. Near term, support sits at $5.20–5.50 and resistance at $7.00–7.50; risk‑reward favors disciplined trading over investment.
Quick Financial Overview
PicoCELA Inc. shows a sharp disconnect between its income statement and its market profile. Revenue stands near $544.7M, but pretax profit margin is around -114.1%, pointing to a business that is burning cash rather than building earnings. Returns are deeply negative, with return on assets at about -7.62% and return on equity near -15.98%, reinforcing that current operations are not generating value. For traders, that usually means the story trades on liquidity, sentiment, and catalysts rather than clean fundamentals.
Despite the losses, PCLA’s balance sheet is not weak. Total assets are about $1.09B, with cash and equivalents near $534.9M and working capital around $527.4M, suggesting strong short‑term flexibility. Total liabilities of roughly $617.2M versus equity of about $470.0M put leverage at a manageable level, with long‑term debt just over $10.4M. A leverageratio of 2.3 and limited long‑term debt give PicoCELA Inc. time to adjust its model or cut costs, which matters when traders weigh downside risk.
On the chart, the story is explosive. The weekly data show PCLA grinding around $1.35–$1.45 before an abrupt gap up to the high-$6s. Price spiked to about $7.08, then cooled to a $5.74 weekly close, which is still multiple times above prior levels. Intraday, a 5‑minute candle between roughly $4.54 and $7.40 with a close near $6.62 confirms aggressive intraday rotations, wide spreads, and strong momentum trading. That volatility is opportunity for short‑term traders, but it also demands tight risk control and clear levels.
Conclusion
This is stock news, not investment advice. StocksToTrade News delivers real-time stock market updates tailored to highlight the key catalysts driving short-term price movements. Our coverage is designed for active traders and investors who thrive in fast-moving markets, with a focus on volatile sectors like penny stocks, AI stocks, Robinhood stocks and other momentum plays. From earnings reports and FDA approvals to mergers, new contracts, and unusual trading volume, we break down the events that can spark significant price action.
Looking to level up your trading game? Explore StocksToTrade, the ultimate platform for traders. With powerful tools designed for swing and day trading, integrated news scanning, and even social media monitoring, StocksToTrade keeps you one step ahead.
Check out our quick startup guide for new traders!
- How to Read Stock Charts: A Guide for Beginners
- Trading Plan: 6 Steps to Create One
- How To Create a Stock Watchlist
Ready to build your watchlists? Check out these curated lists:
Once your watchlist is set, take the next step and trade with confidence using StocksToTrade’s robust platform. Don’t miss out — grab your 14-day trial for just $7 and experience the edge you need to thrive in today’s fast-paced markets.