

Omeros Corporation stocks have been trading down by -12.77 percent after negative sentiment over its latest clinical trial setback.
What Traders Need To Know
- Intraday action shows a hard selloff from above $10 to the mid-$8s, signaling aggressive profit-taking and possible stop runs.
- Weekly data for Omeros Corporation highlights a failed push over $10 followed by a sharp pullback, putting recent buyers under pressure.
- Key ratios on OMER reveal very high price-to-sales and negative book value, pointing to a high‑risk, story‑driven name.
- Cash flow statements show negative free cash flow and shrinking cash, making capital access and dilution key risks for traders.
- Liquidity ratios for OMER remain solid, giving Omeros Corporation some near‑term runway despite heavy losses and balance‑sheet stress.
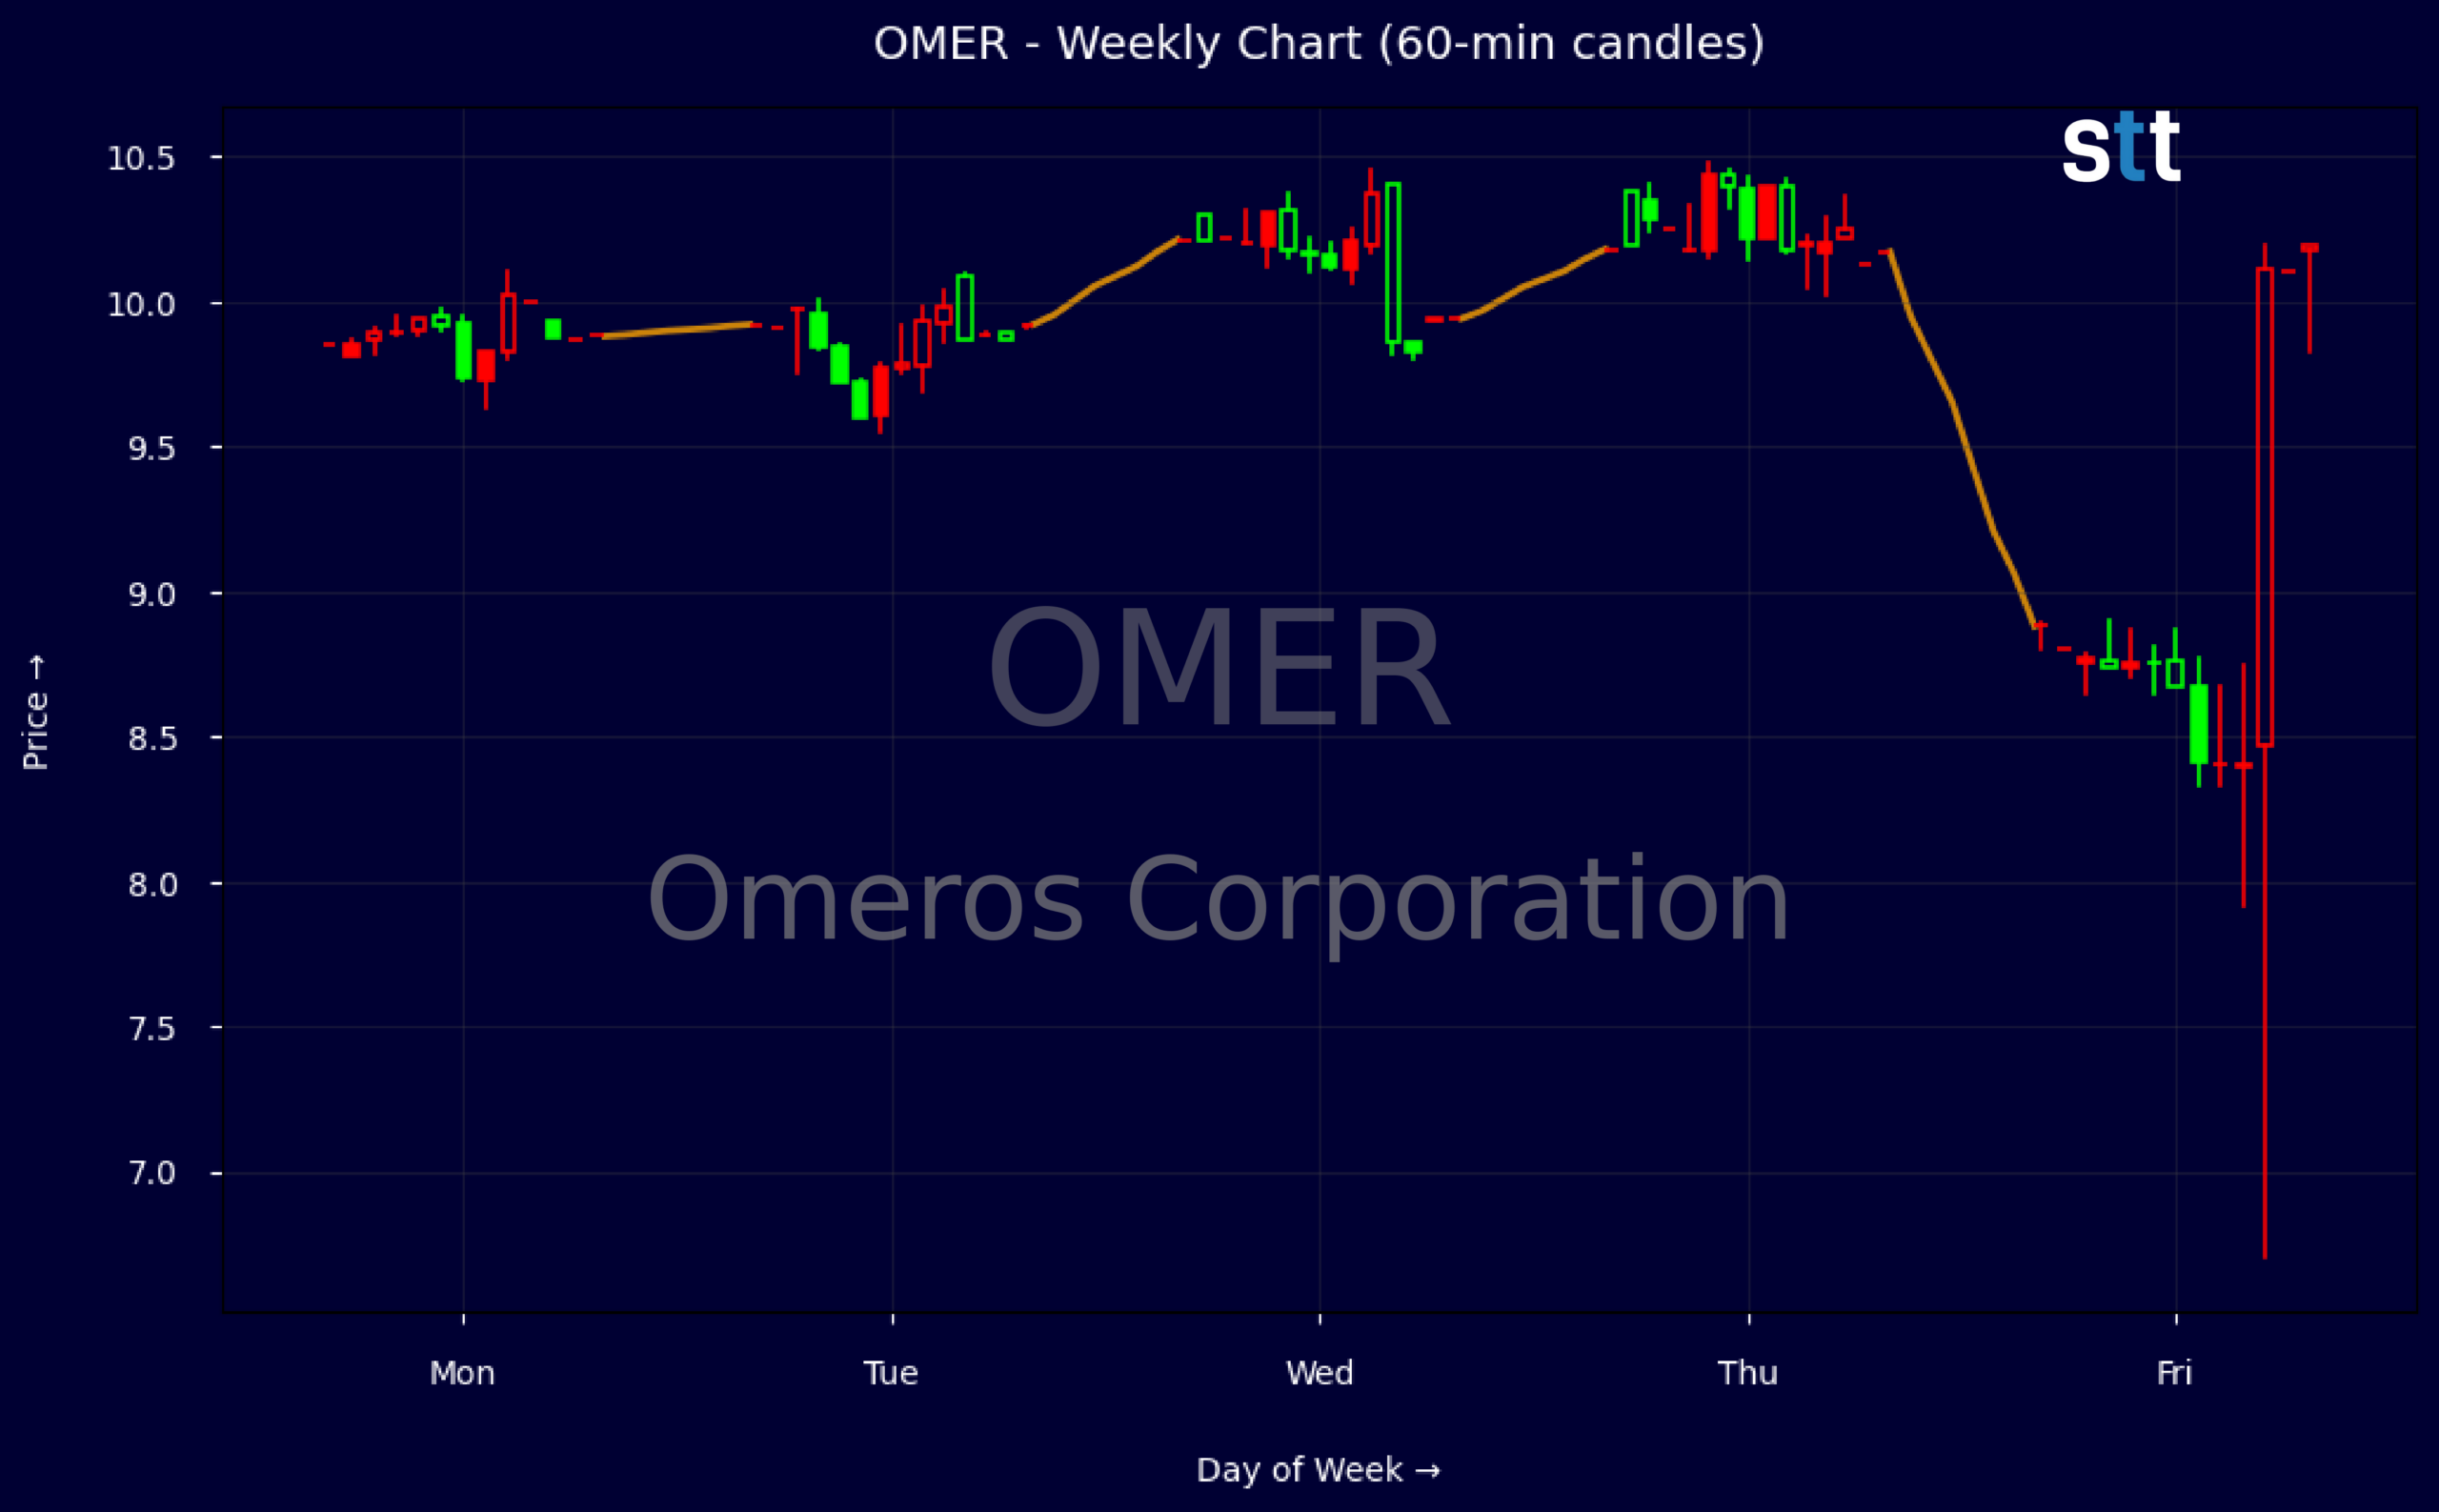
Weekly Update Jun 08 – Jun 12, 2026: On Saturday, June 13, 2026 Omeros Corporation stock [NASDAQ: OMER] is trending down by -12.77%! Discover the key drivers behind this movement as well as our expert analysis in the detailed breakdown below.
Healthcare industry expert:
Analyst sentiment – neutral
OMEROS (OMER) sits in a precarious but asymmetric position: negligible operating revenue ($9.9M in Q1) and deeply negative operating income (-$17.4M) contrast with headline net income driven almost entirely by a $73M securities gain, not core operations. Valuation is stretched with price/sales above 100x and negative book value, while cash burn is material (Q1 operating cash flow -$14.5M) despite a solid current ratio of 3.0 and $135M in cash and short-term investments.
Technically, OMER shows short-term weakness after failing to hold the $10 handle: a swift reversal from $10.20–10.18 down to an $8.65 low and $8.88 close reflects aggressive selling. Intraday 5‑minute candles have shown expanding ranges and increasing volume on down moves, indicating distribution rather than consolidation. The dominant trend is now downward/ corrective. The key actionable level is $8.50 support; a decisive break below it opens risk toward $7.75, while failed breaks offer tactical long scalp opportunities with tight risk.
More Breaking News
- GoDaddy Stock Jumps As Q3 Beat And AI Airo Fuel Bullish Outlook
- CareDx CDNA Rips Higher After Big Earnings Beat And Guidance Hike
- RIG Stock Climbs As Backlog And Valaris Deal Transform Outlook
- NOK Stock Slides As Earnings Strength Fails To Impress Traders
With no fresh fundamental news, the stock trades mainly on sentiment around its pipeline and balance-sheet optionality. Versus broader Healthcare and Biotech benchmarks, OMER offers higher upside optionality but meaningfully higher risk, given negative equity and dependence on external capital and asset sales. Near term, resistance is at $10.25 and stronger at $11.50; support lies at $8.50 and then $7.75. Base case: range-bound to mildly negative bias, with a 3–6 month trading band of $7.50–$11.00.
Quick Financial Overview
OMER shows classic speculative behavior on the chart. The weekly data indicates price pushing from roughly $9.81 toward $10.20, then failing and reversing down toward the high‑$8s. Intraday, a single wide‑range candle from just above $10 down toward the mid‑$6s before bouncing to about $8.74 tells you there was real panic selling and forced liquidation. For short‑term traders, that kind of range expands both opportunity and risk; slippage and spread matter when candles look like that.
Fundamentals on Omeros Corporation are complex. Recent quarterly numbers show total revenue under $10M against operating expenses around $27M, producing an operating loss above $17M. Net income flips positive near $56M only because of a large gain on sale of securities, which also drives the unusually high reported margins and return metrics. For trading purposes, that means the headline profit is not from core drug sales but from financial moves, which can be one‑time and volatile.
The balance sheet for OMER mixes solid liquidity with structural strain. Current assets of about $180.4M against current liabilities near $59.4M support a current ratio near 3.0 and quick ratio around 2.4, which buys time. At the same time, stockholders’ equity is negative around -$63.3M, with long‑term debt above $52.8M and sizable derivative liabilities over $84M. Cash flow from operations is roughly -$14.5M with free cash flow at about -$14.5M as well, so the company is burning cash and reliant on external capital or asset sales.
Conclusion
This is stock news, not investment advice. StocksToTrade News delivers real-time stock market updates tailored to highlight the key catalysts driving short-term price movements. Our coverage is designed for active traders and investors who thrive in fast-moving markets, with a focus on volatile sectors like penny stocks, AI stocks, Robinhood stocks and other momentum plays. From earnings reports and FDA approvals to mergers, new contracts, and unusual trading volume, we break down the events that can spark significant price action.
Looking to level up your trading game? Explore StocksToTrade, the ultimate platform for traders. With powerful tools designed for swing and day trading, integrated news scanning, and even social media monitoring, StocksToTrade keeps you one step ahead.
Check out our quick startup guide for new traders!
- How to Read Stock Charts: A Guide for Beginners
- Trading Plan: 6 Steps to Create One
- How To Create a Stock Watchlist
Ready to build your watchlists? Check out these curated lists:
Once your watchlist is set, take the next step and trade with confidence using StocksToTrade’s robust platform. Don’t miss out — grab your 14-day trial for just $7 and experience the edge you need to thrive in today’s fast-paced markets.