

Ondas Inc faces heightened selling pressure after its most influential bearish news, as stocks have been trading down by -15.37 percent.
Key Takeaways
- ONDS has retreated from the 7.00 area to the mid‑4s, putting a sharp pullback on traders’ radar.
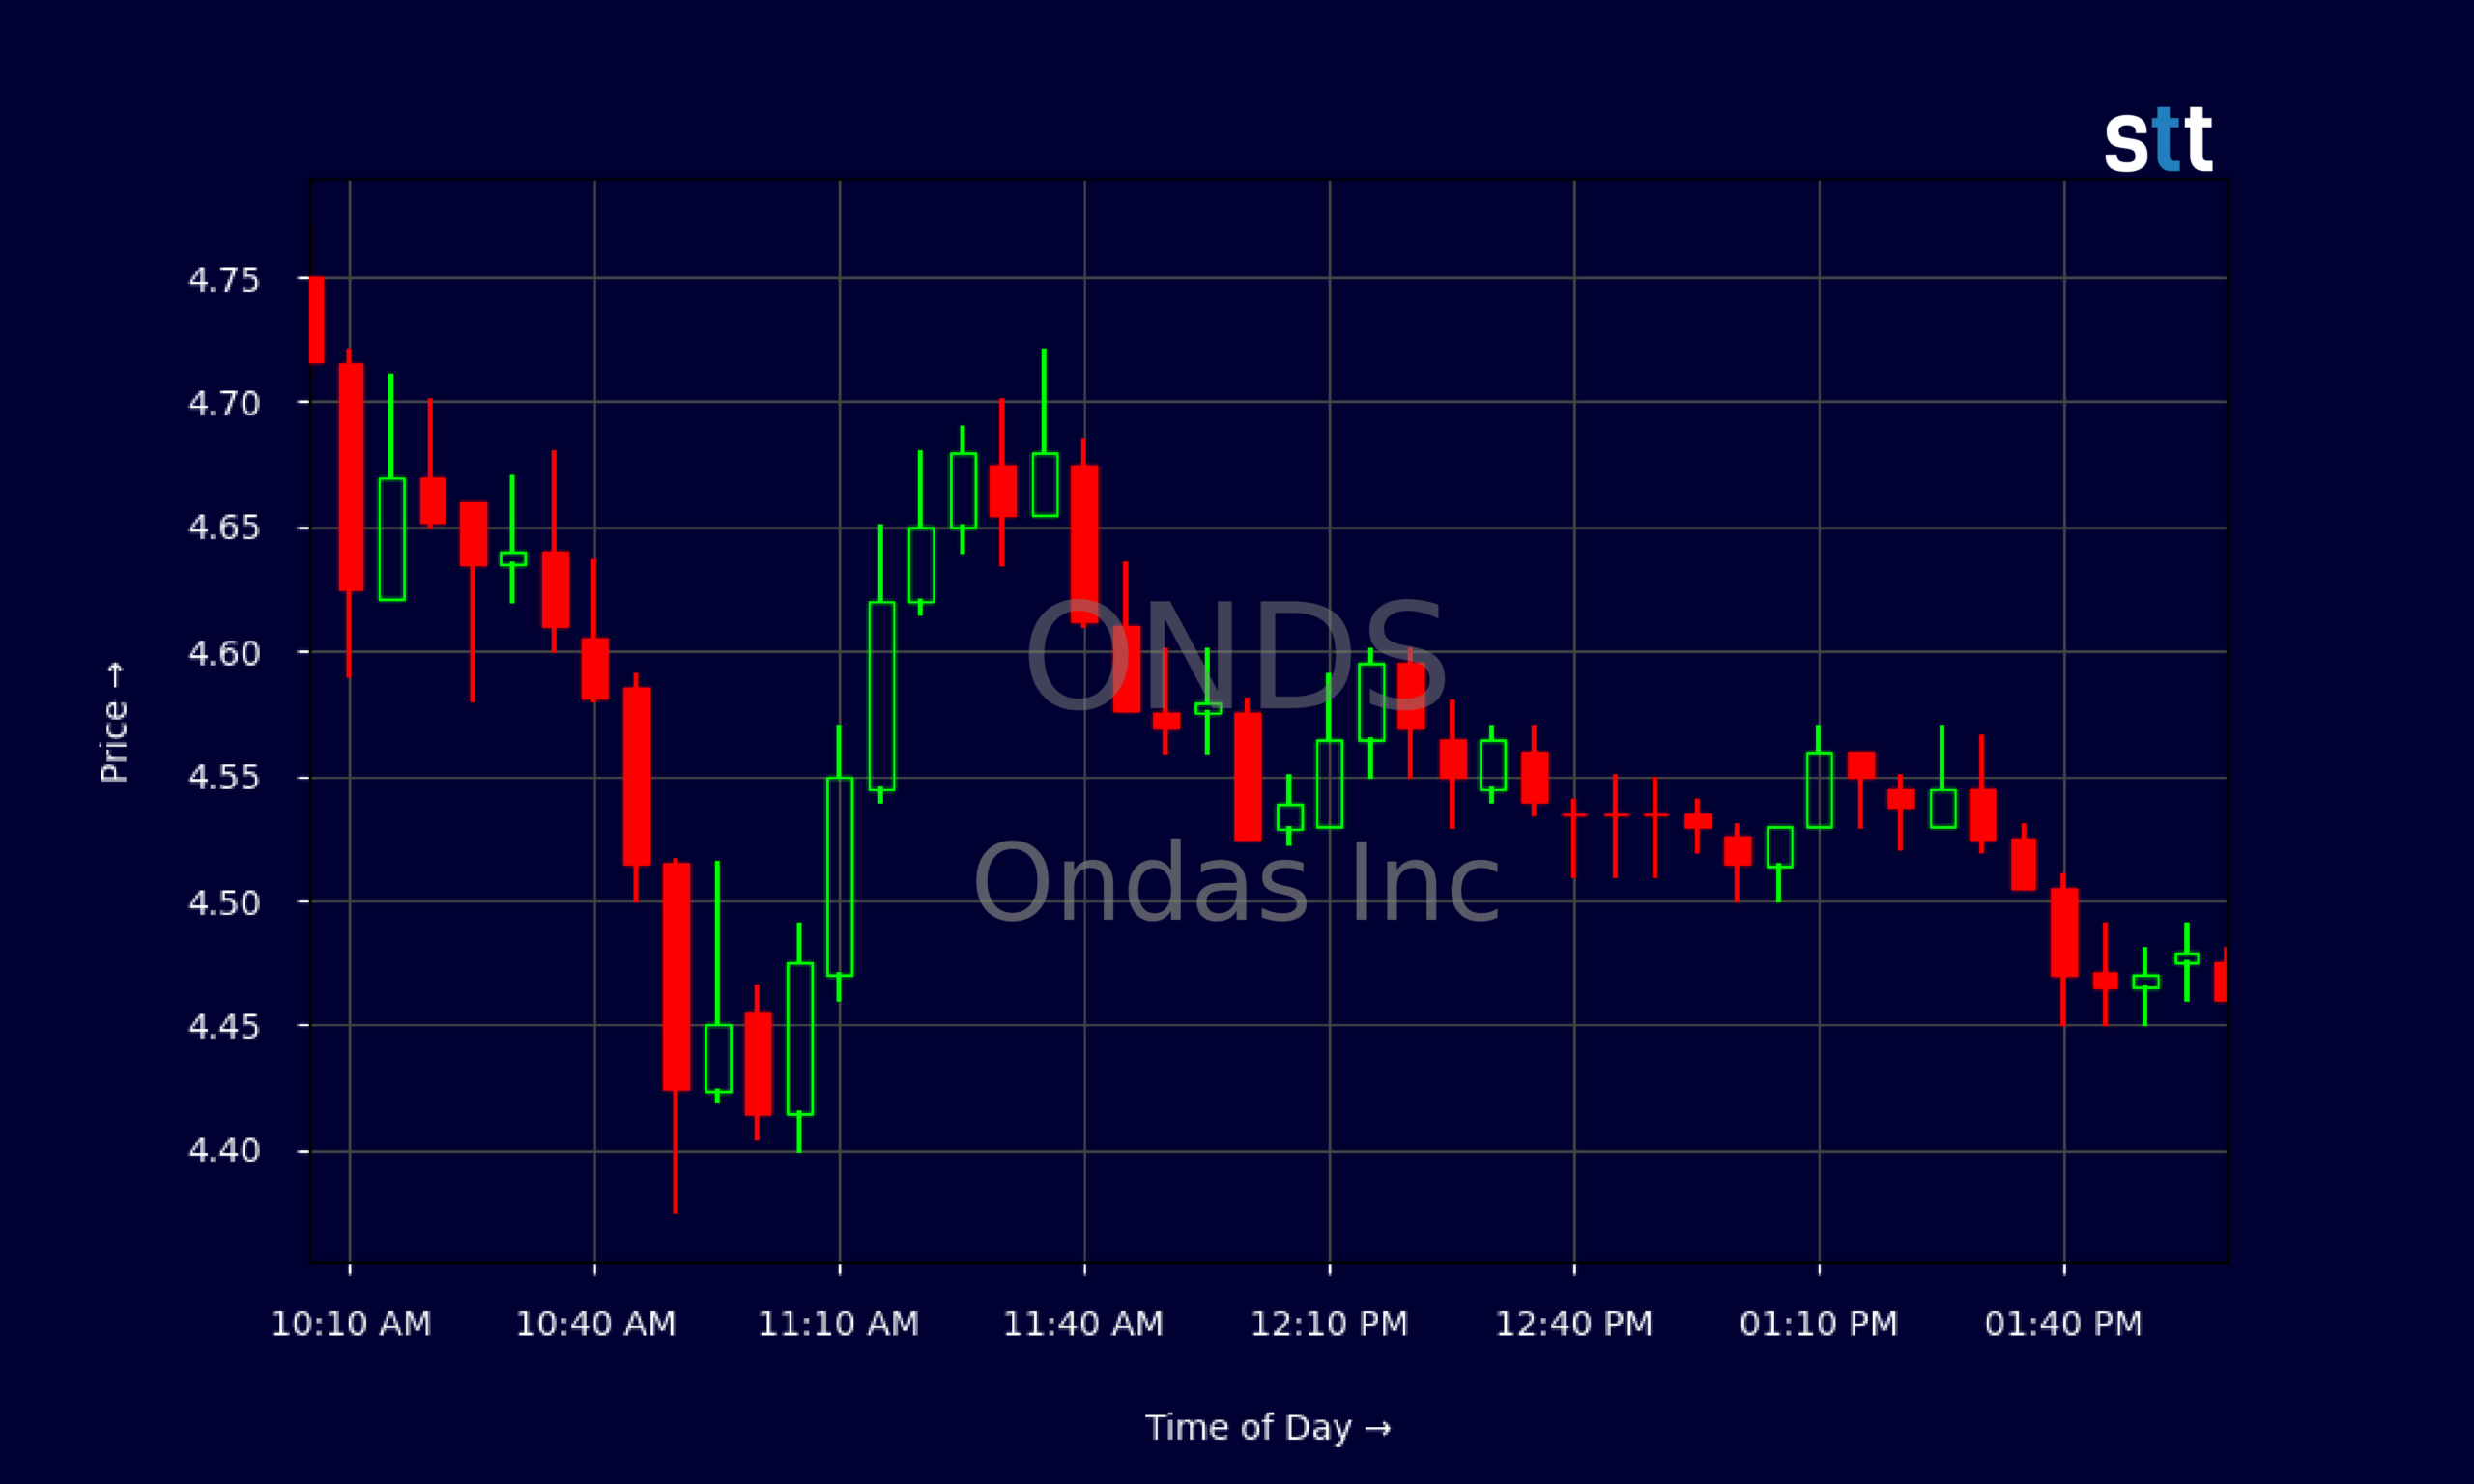
- Intraday trading shows ONDS fading all morning, then grinding sideways, a classic low-volume consolidation after a selloff.
- Ondas Inc holds over $600M in cash and minimal debt, giving the company a sizable financial cushion despite heavy quarterly losses.
- High price-to-sales and negative cash flow keep ONDS firmly in speculative territory for active trading strategies.
Live Update At 14:02:50 EST: On Thursday, November 05, 2026 Ondas Inc stock [NASDAQ: ONDS] is trending down by -15.37%! Discover the key drivers behind this movement as well as our expert analysis in the detailed breakdown below.
Quick Financial Overview
Ondas Inc, trading under the ONDS ticker, is a classic story of strong top-line growth paired with heavy spending. The latest figures show revenue of about $50.7M, with multi‑year revenue growth well above 100%. That tells traders ONDS is not some dead story; it is building sales and trying to scale.
Profitability is another matter. ONDS posted quarterly revenue of roughly $83.8M but still booked a net loss of about $88.2M and negative operating income near $143.7M. Cash flow from operations came in around -$86.1M, with free cash flow near -$93.8M. For traders, that screams “aggressive growth mode,” not “steady cash generator.”
More Breaking News
- SK Hynix Slips 0% As NVIDIA Earnings Boost Fades
- Grab Holdings Falls 1% Today
- LivaNova (LIVN) Stock Pops As Traders Eye Bullish Barclays Call And CORE‑VNS Data
- BBD Stock Jumps As Analyst Upgrades And Buyback Fuel Momentum
On the balance sheet, ONDS shows total assets of about $2.99B and equity around $1.57B. The current ratio near 9.9 and long-term debt of only about $4.1M mean liquidity is strong. ONDS also sits on roughly $657.9M in cash and over $1.38B in cash plus short-term investments. The flip side is valuation: a price-to-sales ratio near 22.5 keeps ONDS richly priced, so any stumble in growth or sentiment can hit the stock hard.
Why Traders Are Watching ONDS Price Action
The ONDS chart is the real story right now. In late October, Ondas Inc was trading in the mid‑6s to low‑7s. Recent daily data show closes slipping from about 6.88–6.32 down to 5.79–5.27, and now 4.46. That’s a sustained downtrend, not just a random wiggle. For momentum traders, ONDS has clearly shifted from breakout mode into a “broken chart” that might still offer sharp bounces.
Intraday, ONDS opened near 5.09 and tried to push into the 5.15–5.16 range during premarket. Once the regular session started, sellers took control. The stock slid steadily, printing lower highs from the 4.90s to the mid‑4.60s, and eventually closing around 4.46. After the early flush from 5.00 to the low‑4.40s, ONDS traded in a tight band between roughly 4.45 and 4.58 for hours. That kind of sideways action after a morning selloff often signals exhaustion from both buyers and sellers.
For short-term trading, ONDS now has a clear intraday resistance zone around 4.70–4.90 and support near 4.35–4.40. On the multi‑day chart, the prior consolidation in the 6.10–6.40 zone turned into a failed base. ONDS broke down from there and has not reclaimed it. Many technical traders will treat that 6+ zone as major overhead supply.
Given ONDS’s rich valuation and negative earnings, the chart tends to matter more than the story. When small-cap names like Ondas Inc break trend, they often over‑shoot both on the downside and on the snapback. That is what keeps active traders locked on ONDS right now.
Conclusion
ONDS sits at an interesting crossroads. On one hand, Ondas Inc has strong revenue growth, thick gross margins near 43.7%, and a fortress-like liquidity profile with almost no long-term debt. The balance sheet shows ONDS can keep funding operations and product development for a while, even with heavy losses. On the other hand, the company is burning cash, posting negative operating income and free cash flow, and trading at a steep price-to-sales multiple. That makes ONDS extremely sensitive to sentiment and technical shifts.
For traders, this mix creates opportunity and risk. The recent slide from the 7.00 area to the mid‑4s has reset expectations and shaken out late longs. If ONDS holds support in the low‑4s and volume returns, snapback setups toward 5.00 and above are possible. If that support cracks, the same volatility that once drove ONDS higher can work the other way.
This is exactly the type of chart the Sykes community studies daily. As Tim Sykes often says, “The market rewards those who are prepared, not those who are hopeful.” Applied to ONDS, that means respecting the trend, planning trades around key levels, and cutting losses fast if the price action proves you wrong. As Tim Bohen, lead trainer with StocksToTrade says, “The best way to learn is by tracking trades, wins, losses, and lessons learned. Every trade has something to teach.”. Taken together, these lessons highlight that ONDS should be treated as a trading vehicle where meticulous preparation and post‑trade review go hand in hand with disciplined execution. This article is for educational and research purposes only and is not investment advice; every trader must do their own homework before taking any position in ONDS.
This is stock news, not investment advice. StocksToTrade News delivers real-time stock market updates tailored to highlight the key catalysts driving short-term price movements. Our coverage is designed for active traders and investors who thrive in fast-moving markets, with a focus on volatile sectors like penny stocks, AI stocks, Robinhood stocks and other momentum plays. From earnings reports and FDA approvals to mergers, new contracts, and unusual trading volume, we break down the events that can spark significant price action.
Looking to level up your trading game? Explore StocksToTrade, the ultimate platform for traders. With powerful tools designed for swing and day trading, integrated news scanning, and even social media monitoring, StocksToTrade keeps you one step ahead.
Check out our quick startup guide for new traders!
- How to Read Stock Charts: A Guide for Beginners
- Trading Plan: 6 Steps to Create One
- How To Create a Stock Watchlist
Ready to build your watchlists? Check out these curated lists:
Once your watchlist is set, take the next step and trade with confidence using StocksToTrade’s robust platform. Don’t miss out — grab your 14-day trial for just $7 and experience the edge you need to thrive in today’s fast-paced markets.