

Olin Corporation faces heightened pressure as regulatory and demand concerns deepen, with stocks have been trading down by -15.52 percent.
What Traders Need To Know
- BMO Capital cut its price target on Olin from $30 to $25, citing weak housing and autos and pressure on commodity chemical names through Q2 and the second half.
- Goldman Sachs reduced its Olin price target from $31 to $24 and kept a Neutral stance, warning of downside earnings risk from Q3 onward tied to weaker conflict benefits and feedstock constraints.
- The company posted a wider Q2 net loss of $0.12 per share versus a $0.01 loss a year ago, badly missing expectations for a $0.10 profit as revenue slipped and missed consensus.
- After the Q2 miss, shares dropped more than 5% in after-hours trading, signaling shaken confidence among short-term traders.
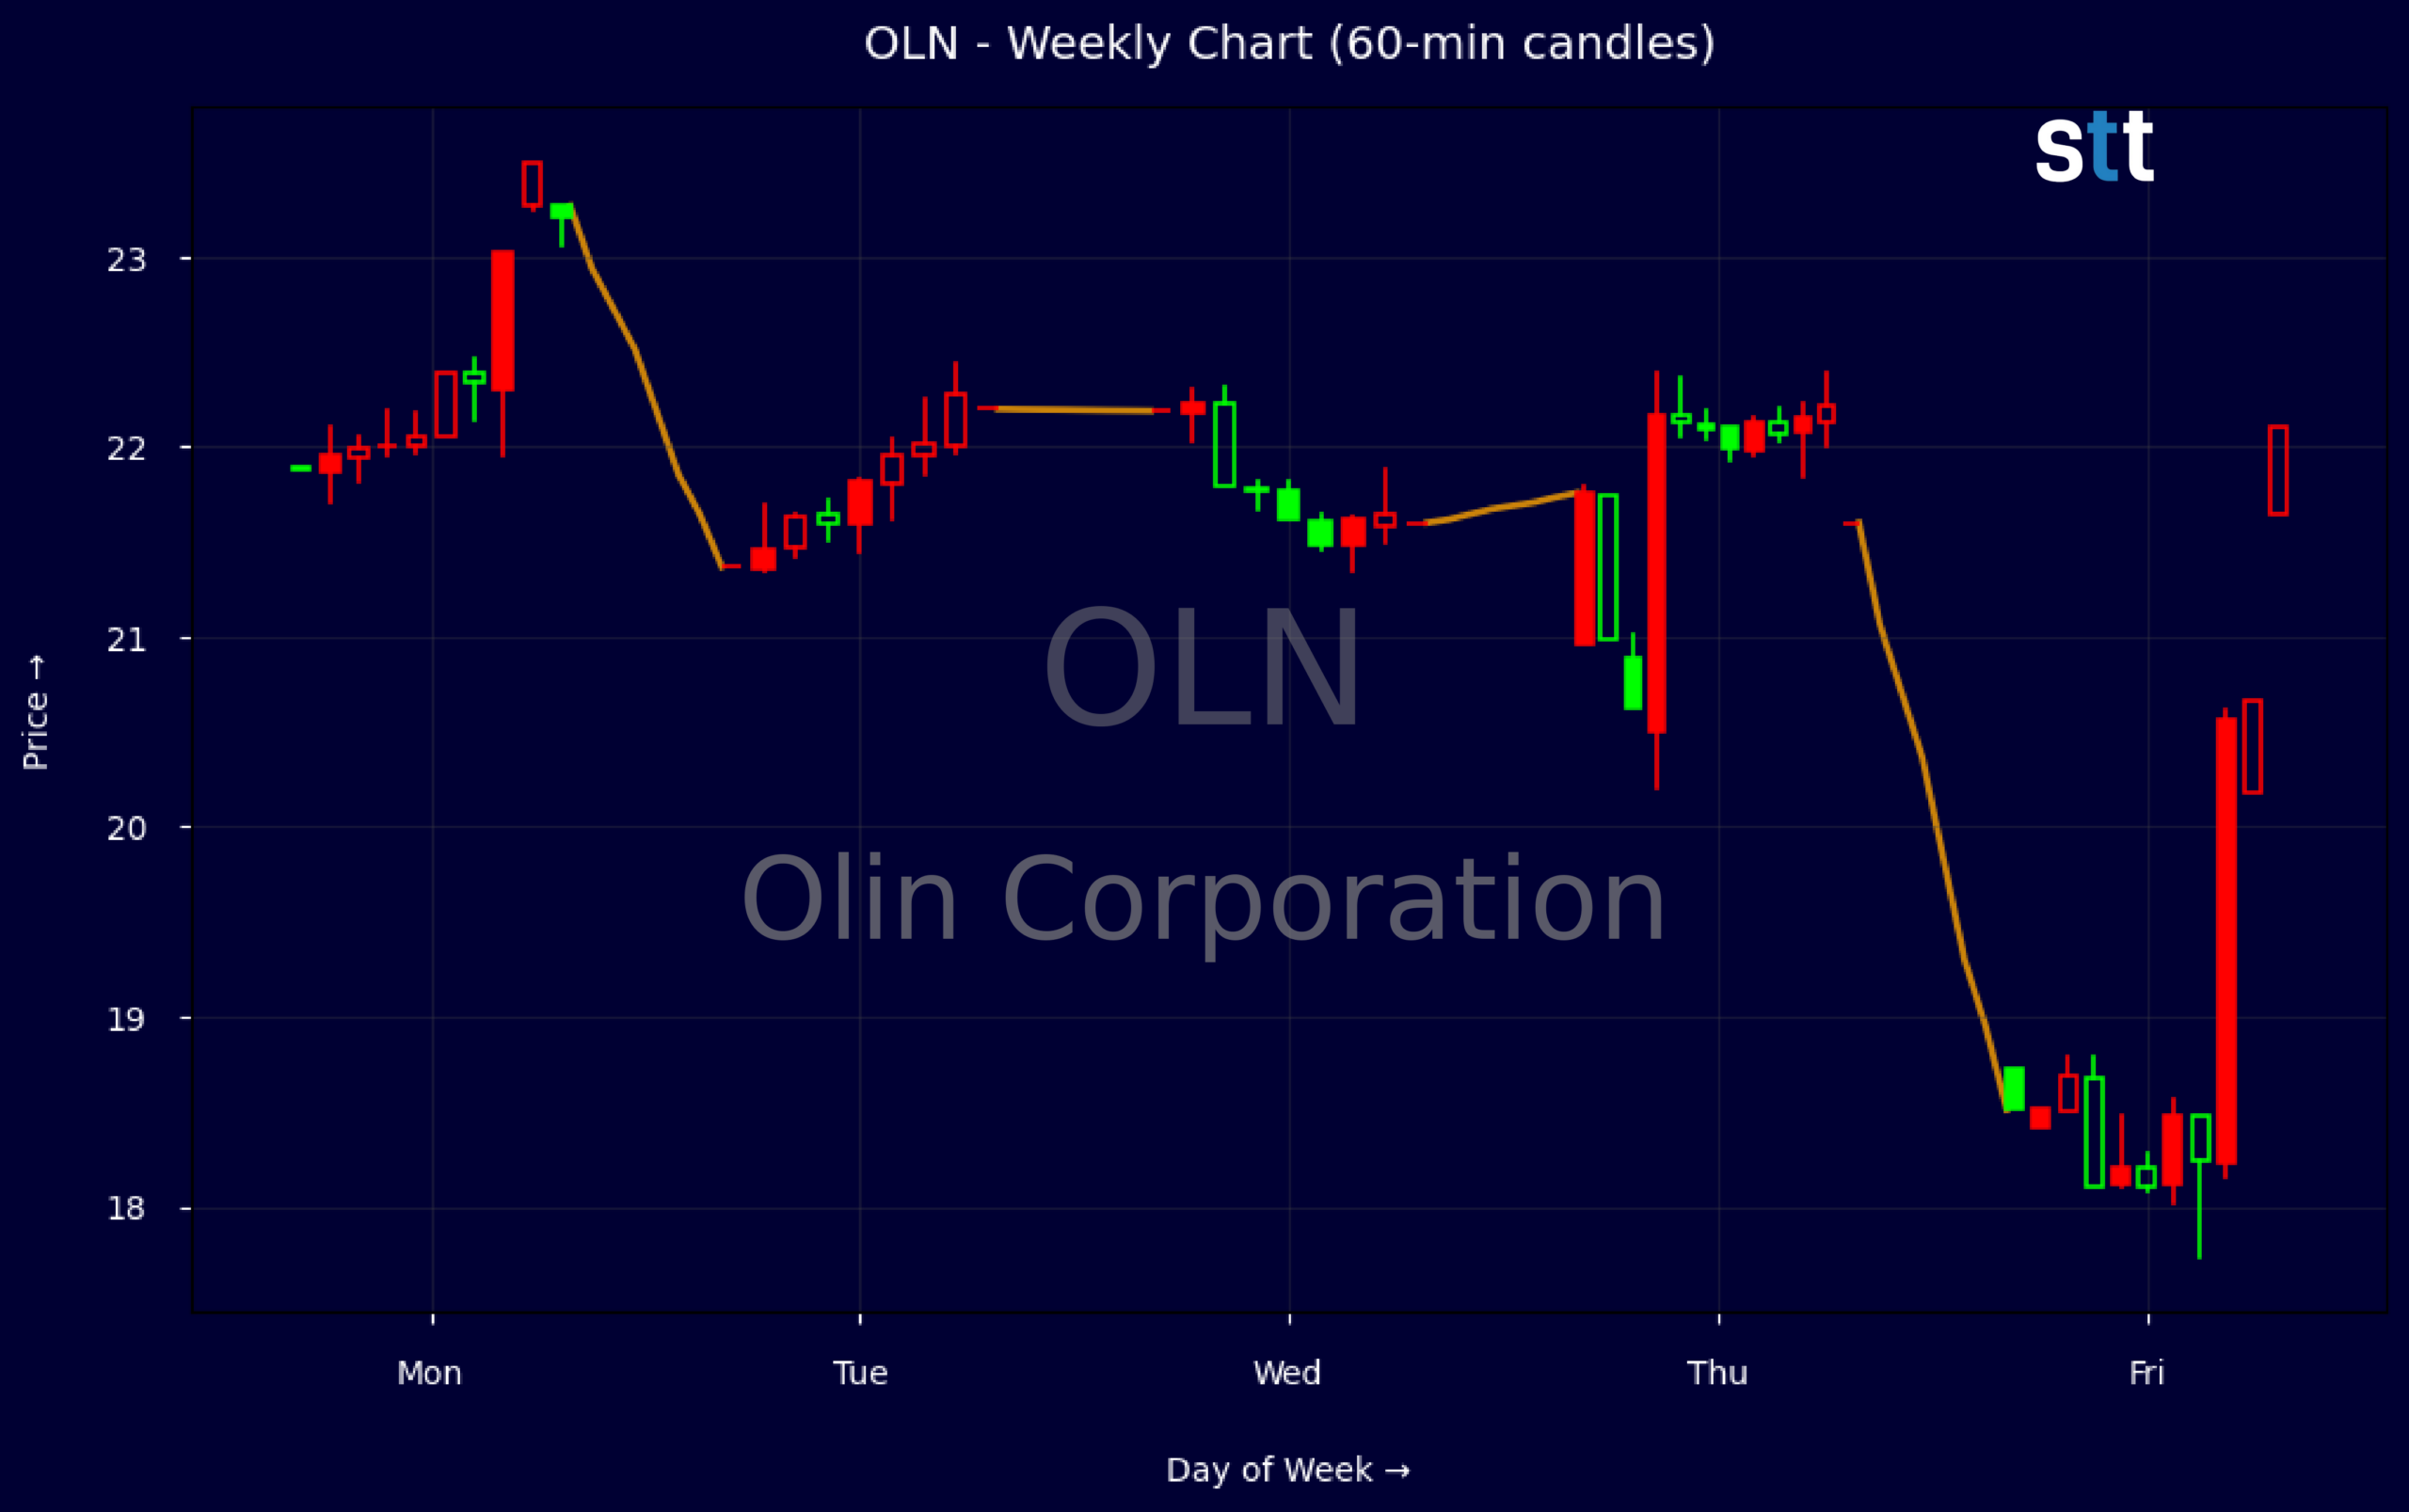
Weekly Update Jul 27 – Jul 31, 2026: On Sunday, August 02, 2026 Olin Corporation stock [NYSE: OLN] is trending down by -15.52%! Discover the key drivers behind this movement as well as our expert analysis in the detailed breakdown below.
Materials industry expert:
Analyst sentiment – negative
Olin’s current fundamentals reflect a stressed but asset-rich chlor-alkali and ammunition franchise. Consolidated EBIT and net margins are negative despite 6.9% gross margin, and trailing three- and five-year revenue CAGRs are mildly negative, showing a downcycle rather than structural decline. Leverage is elevated (total debt/equity ~2.0x, interest coverage 2.3x), with weak LTM ROE (-10.7%) and ROA (-2.6%), but asset turnover near 0.9x and price/sales of 0.31x indicate the equity is already priced as deep value.
Technically, OLN has transitioned from a tight consolidation near $22 into an impulsive breakdown, with the weekly range collapsing from $22.39 to an $18.41 low and closing at $18.73. That pattern, likely on rising volume, confirms a new dominant downtrend and loss of prior support around $21–22. Short-term, $19.00 is now key resistance; rallies into $18.90–19.20 favor sells or hedges, targeting $17.00 where stronger longer-term demand is likely.
More Breaking News
- Micron Stock Slides As China’s CXMT DRAM Threat Rattles Traders
- NU Stock Plunges Nearly 20% As Volatility Spikes
- CMCSA Stock Grinds Higher As Earnings Beat Meets Big Restructure
- Global Payments Stock Jumps As Analysts Hike Targets
Near-term catalysts are clearly negative: Q2 EPS of -$0.12 versus +$0.10 expected, revenue undershoot, and two target cuts (BMO to $25, Goldman to $24) signal compressed earnings power ahead of a weaker macro tape for housing- and auto-exposed chemicals. Relative to Materials and Chemicals peers, Olin now trades as a high-beta laggard with balance-sheet risk. Base case: fair value $18–20 with overhead resistance at $22 and strong support near $16–17; risk/reward is skewed negatively.
Quick Financial Overview
Olin Corporation just delivered the kind of quarter that forces traders to reset expectations. Q2 revenue was about $1.74B, but that top line came with a net loss of $0.12 per share instead of the $0.10 profit analysts had expected. That swing versus consensus explains why OLN sold off more than 5% after the release, and it lines up with the cautious tone from recent Wall Street target cuts.
Under the surface, margins are thin and patchy. Recent key ratios show an EBIT margin of roughly -1.4% and a profit margin near -3%, while gross margin sits under 7%. On 2026/06/30, EBITDA of about $170.2M on $1.74B in revenue underscores that the core business still throws off cash before interest and special items, but interest expense of $44.3M, restructuring charges, and a heavy tax line turned that into a bottom-line loss.
The balance sheet and cash flows tell traders this is a leveraged, cyclical story. Total debt to equity near 2.0 and a leverage ratio above 4 mean Olin Corporation carries meaningful financial risk if the cycle stays weak. Operating cash flow of $7.9M in the latest quarter, against capital spending of $29M and dividends of $22.8M, left free cash flow negative by about $21.1M, so the dividend yield around 4.3% is not “free money” in the current tape.
Price action confirms the pressure. On the weekly view, OLN traded near $21-22 early in the week, but the earnings day saw a spike to roughly $22.39 before a hard intraday fade to about $20.97. The next session opened near $18.5 and closed around $18.73, showing follow-through selling. On the 5‑minute chart, a single wide candle dropping from roughly $20.48 to near $18.51 with a low in the $17.70s points to an air-pocket move where bids disappeared after the earnings shock.
Conclusion
This is stock news, not investment advice. StocksToTrade News delivers real-time stock market updates tailored to highlight the key catalysts driving short-term price movements. Our coverage is designed for active traders and investors who thrive in fast-moving markets, with a focus on volatile sectors like penny stocks, AI stocks, Robinhood stocks and other momentum plays. From earnings reports and FDA approvals to mergers, new contracts, and unusual trading volume, we break down the events that can spark significant price action.
Looking to level up your trading game? Explore StocksToTrade, the ultimate platform for traders. With powerful tools designed for swing and day trading, integrated news scanning, and even social media monitoring, StocksToTrade keeps you one step ahead.
Check out our quick startup guide for new traders!
- How to Read Stock Charts: A Guide for Beginners
- Trading Plan: 6 Steps to Create One
- How To Create a Stock Watchlist
Ready to build your watchlists? Check out these curated lists:
Once your watchlist is set, take the next step and trade with confidence using StocksToTrade’s robust platform. Don’t miss out — grab your 14-day trial for just $7 and experience the edge you need to thrive in today’s fast-paced markets.