

Nokia Corporation Sponsored stocks have been trading down by -7.73 percent as investors react to weaker-than-expected earnings guidance.
Key Takeaways
- Nokia stock is down more than 7% despite reporting higher Q3 comparable earnings and net sales.
- On 2026/10/22, Nokia was among several European ADRs that underperformed sharply while the S&P Europe Select ADR Index slipped just 0.96%.
- Telecom equipment names Nokia and Ericsson both dropped, with Nokia falling roughly 3%, almost double Ericsson’s decline.
- On 2026/10/08, Nokia lost 3.2% while the broader European ADR index dipped only 0.3%, highlighting persistent underperformance.
- European ADRs including Nokia also fell in an otherwise strong session, underscoring stock‑specific pressure.
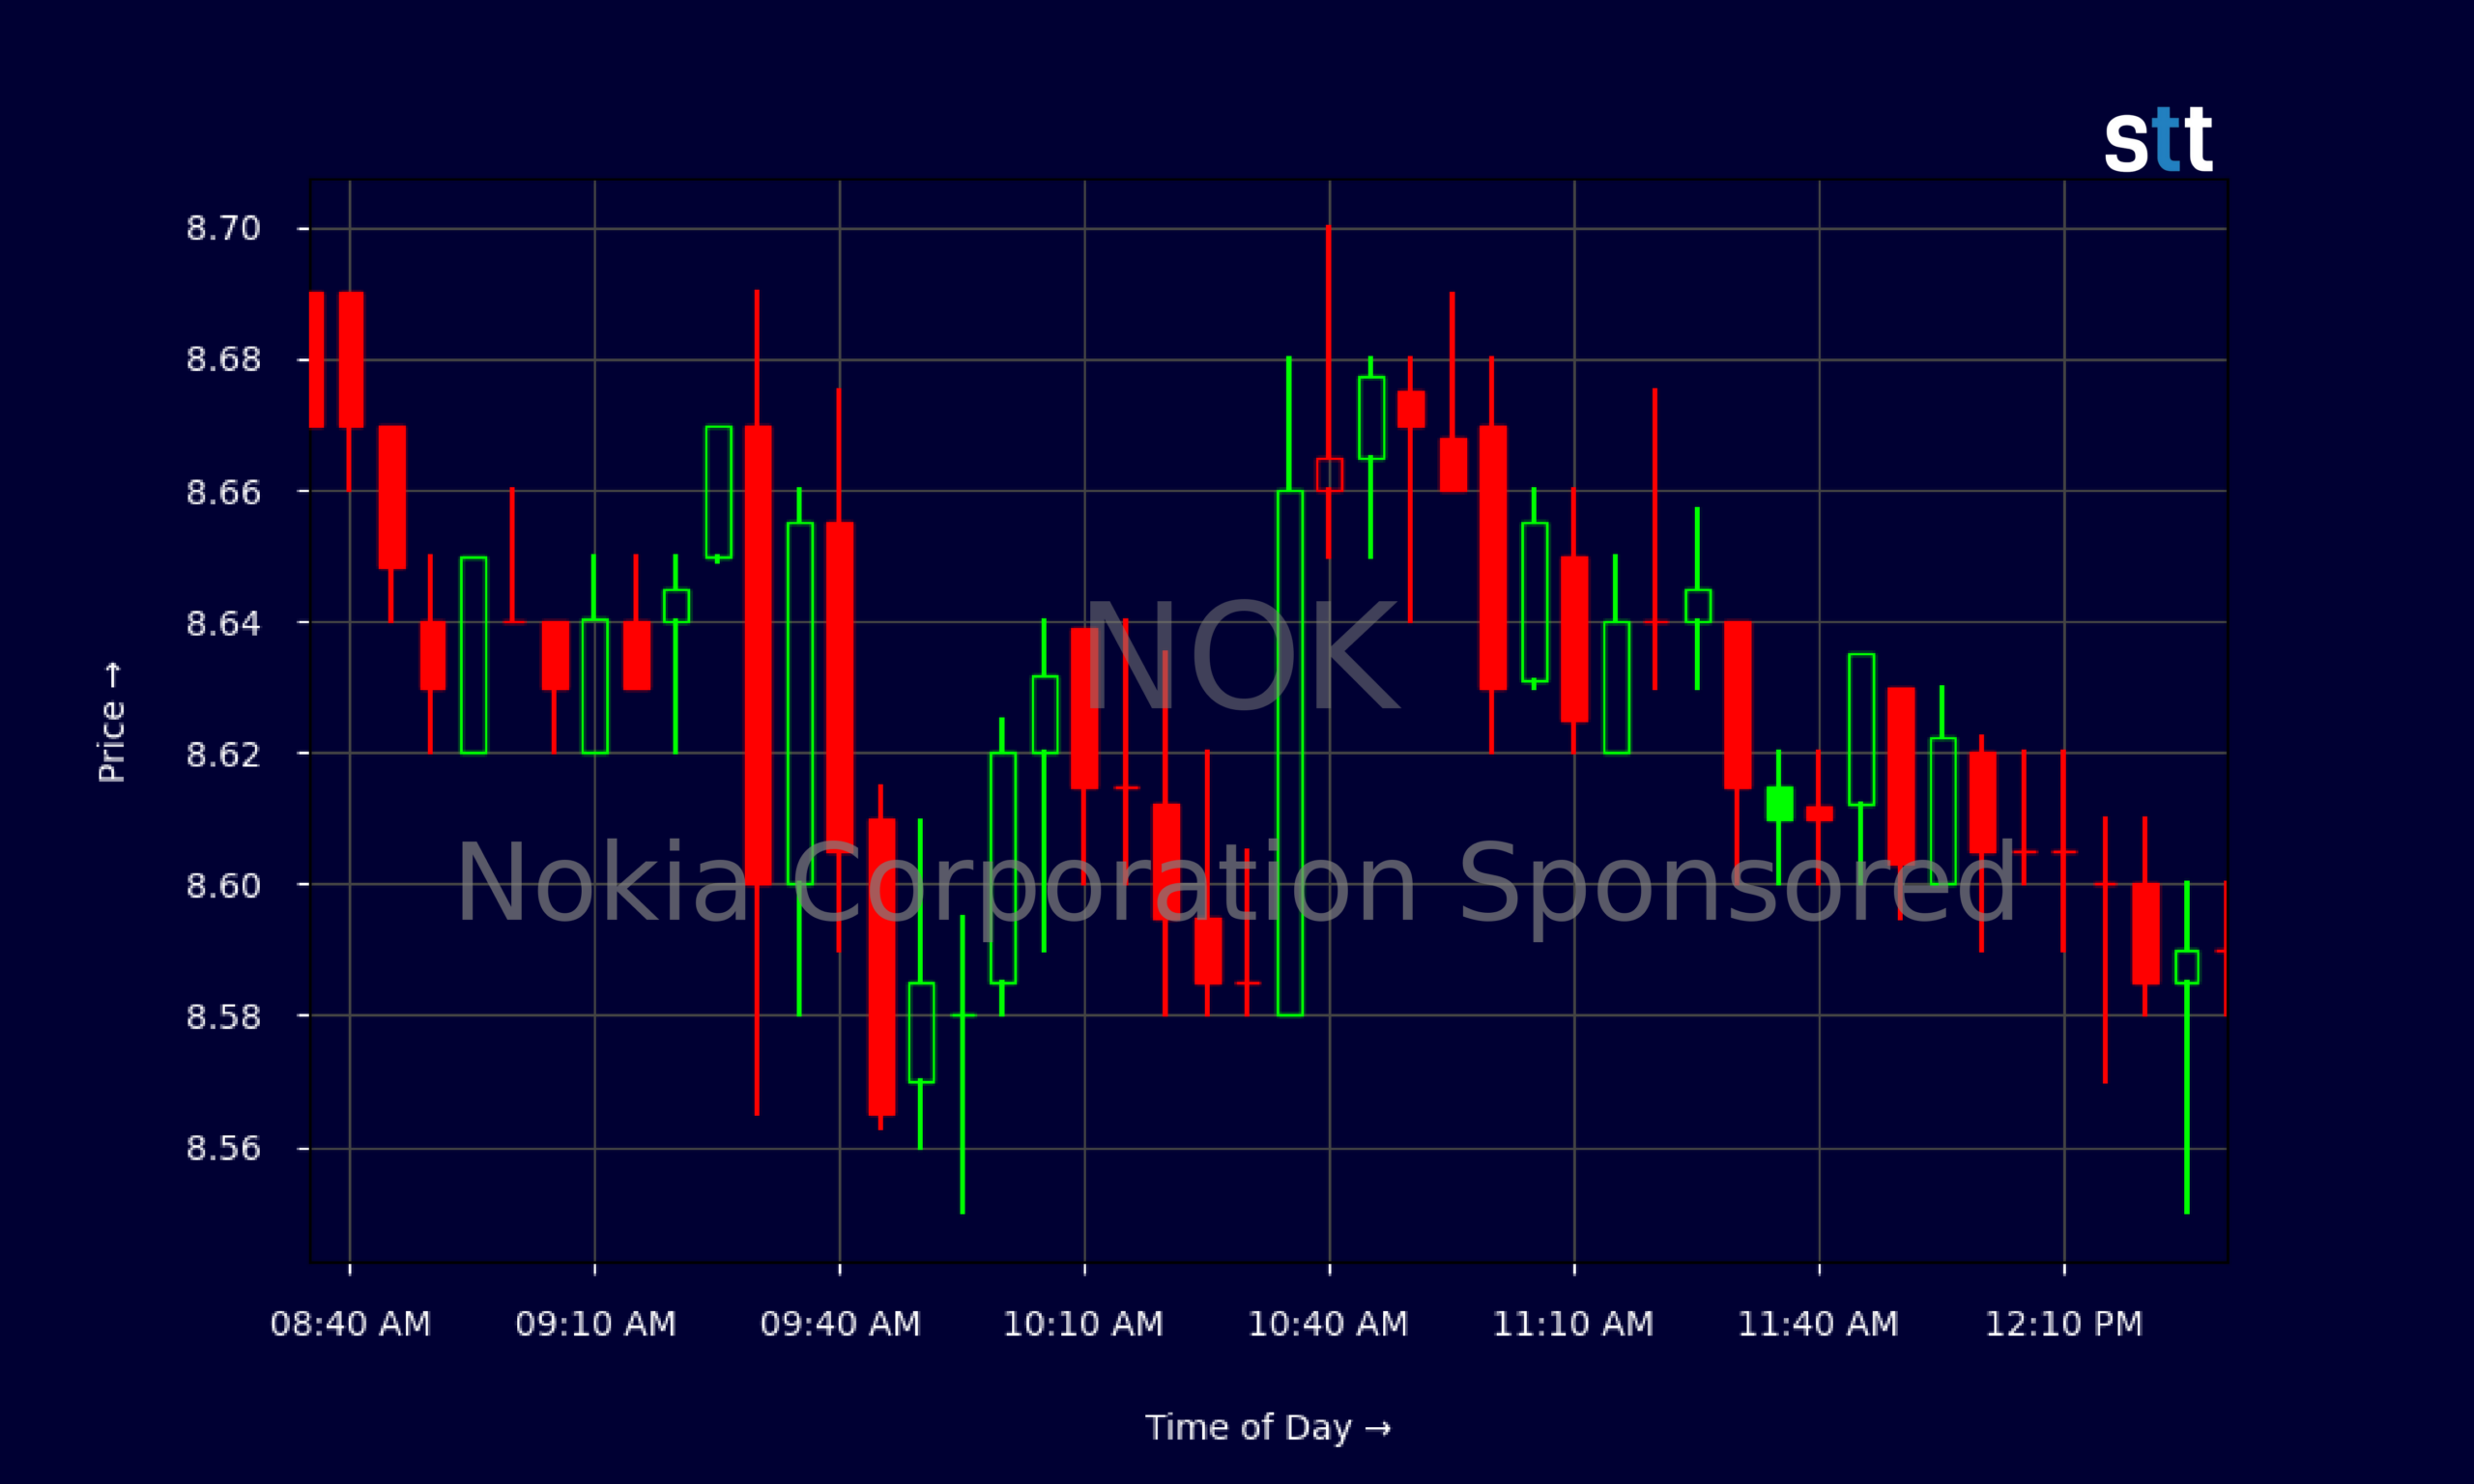
Live Update At 12:33:58 EDT: On Friday, October 30, 2026 Nokia Corporation Sponsored stock [NYSE: NOK] is trending down by -7.73%! Discover the key drivers behind this movement as well as our expert analysis in the detailed breakdown below.
Quick Financial Overview
NOK has been bleeding lower for weeks, and the chart tells the story clearly. At the start of this recent stretch, Nokia ADRs were trading above $10; now they’re struggling to hold the mid‑$8s. That’s a slide of roughly 15% in a matter of days, even as the company just posted higher Q3 comparable earnings and net sales.
Daily candles show a steady grind down: lower highs from around $10.97 to $9.90, then to $9.57, and now down to $8.59. For short‑term traders, that’s a textbook downtrend. Every bounce in NOK has been getting sold.
Intraday, the 5‑minute chart is almost flat‑lining around $8.60–$8.70. Tight ranges, low momentum, and no clear trend shift. Nokia’s tape shows more of a controlled drift than panic, which often signals trapped longs quietly exiting while aggressive traders fade pops.
More Breaking News
- IOVA Stock Collapses As Traders Flee Biotech High‑Flier
- MPT Stock Slides As Traders Focus On Debt And Cash Flow
- SPCX Slides As SpaceX Faces Geopolitics, Competition, AI Risks
- ABEV Stock Slumps As Bank Of America Turns Bearish
Fundamentally, NOK is not a tiny story stock. Revenue sits around $19.22B, with a price‑to‑sales ratio near 2.6 and a lofty P/E above 74. That kind of valuation demands strong, consistent growth. Yet returns on assets and equity are modest, in the low‑single digits. For active traders, that combination — rich multiple, soft returns, and a weak chart — explains why the market is ruthless when sentiment turns.
Why Traders Are Watching NOK’s Persistent Weakness
The key tension around NOK right now is simple: the numbers are getting better, but the stock is getting punished. Nokia just reported higher Q3 comparable earnings and net sales, yet the ADR dropped more than 7% on that day. When a company “beats the headline” and still gets sold hard, traders know the market is looking past the quarter.
On 2026/10/22, Nokia was part of a broader sell‑off in European ADRs. The S&P Europe Select ADR Index was down less than 1%, but big names — especially Nokia, Banco Santander, BBVA, ING Group, and others — fell between roughly 2.4% and nearly 10%. Even inside that weak group, Nokia stood out on the downside. That tells traders the issue is not just macro.
Earlier in the month, the pattern was already in place. On 2026/10/08, NOK dropped 3.2% while the overall European ADR index slipped just 0.3%. A few days later, a subset of European ADRs, including Nokia, declined in what was otherwise a strong session. Again, the crowd was buying Europe, but not Nokia.
Even sector peers underscore the point. Telecom equipment names Nokia and Ericsson both sold off, but Nokia fell around 3% while Ericsson lost only about 1.7%. When the whole space is under pressure and your stock drops almost twice as much, traders read that as a vote of no confidence in your specific story.
Put together, NOK is sending a clear message to short‑term traders: sentiment is fragile, every risk‑off wave hits the stock harder than the market, and earnings strength alone is not enough to flip the script — at least not yet.
Conclusion
For active traders, NOK is a lesson in why price action always gets the final word. Nokia’s balance sheet is not falling apart. The company carries about $2.33B of long‑term debt against more than $6.76B in cash and short‑term investments, decent working capital, and over $20.96B in total equity. On paper, that looks stable. But the market is not rewarding stability; it is discounting future growth.
The rich P/E near 74, modest returns (around 2.9% on assets and 5.8% on equity), and a price drifting below book value per share signals a tug‑of‑war. Some traders see a beaten‑down telecom heavyweight with a small cash dividend near 1.4%. Others see a legacy name like Nokia that the market is willing to fade every time there is a bounce. As Tim Bohen, lead trainer with StocksToTrade says, “If you’re still guessing at the end of your analysis, it’s probably not a trade worth taking.” That mindset is crucial when deciding whether NOK’s current setup is a clear opportunity or just a coin‑flip in a choppy name.
In this kind of tape, Tim Sykes’ rule hits home: “Cut losses quickly, because small losses are manageable, big losses are account killers.” For anyone trading NOK, that means respecting the downtrend, not marrying a thesis, and letting the chart — not hope — define your risk. This analysis is for educational and research purposes only, but the takeaway is clear: until Nokia’s price action turns, traders should treat every spike as a potential liquidity event, not a victory lap.
This is stock news, not investment advice. StocksToTrade News delivers real-time stock market updates tailored to highlight the key catalysts driving short-term price movements. Our coverage is designed for active traders and investors who thrive in fast-moving markets, with a focus on volatile sectors like penny stocks, AI stocks, Robinhood stocks and other momentum plays. From earnings reports and FDA approvals to mergers, new contracts, and unusual trading volume, we break down the events that can spark significant price action.
Looking to level up your trading game? Explore StocksToTrade, the ultimate platform for traders. With powerful tools designed for swing and day trading, integrated news scanning, and even social media monitoring, StocksToTrade keeps you one step ahead.
Check out our quick startup guide for new traders!
- How to Read Stock Charts: A Guide for Beginners
- Trading Plan: 6 Steps to Create One
- How To Create a Stock Watchlist
Ready to build your watchlists? Check out these curated lists:
Once your watchlist is set, take the next step and trade with confidence using StocksToTrade’s robust platform. Don’t miss out — grab your 14-day trial for just $7 and experience the edge you need to thrive in today’s fast-paced markets.