Nokia Corporation Sponsored stocks have been trading down by -4.39 percent amid investor concern over weakening telecom equipment demand.
Click Here for a Millionaire's POV on Trading NOK
SUBSCRIBE FOR ALERTSJOIN 50,000+ ACTIVE TRADERS
Key Takeaways
- Nokia’s ADR keeps lagging, with fresh declines on 2026/10/15 even while broader European stocks in US trading finished strong.
- On 2026/10/12, telecom names Nokia and Ericsson were notable decliners, with Nokia dropping about 3%.
- On 2026/10/08, Nokia’s ADR fell roughly 3.2% while the broader European ADR index slipped just 0.3%.
- On 2026/09/28, ADRs for Nokia, Opera, SAP and Materialise underperformed a slightly negative S&P Europe Select ADR Index.
- On 2026/09/24, Nokia joined a group of European and UK/Irish ADRs that declined sharply against a marginally lower European ADR benchmark.
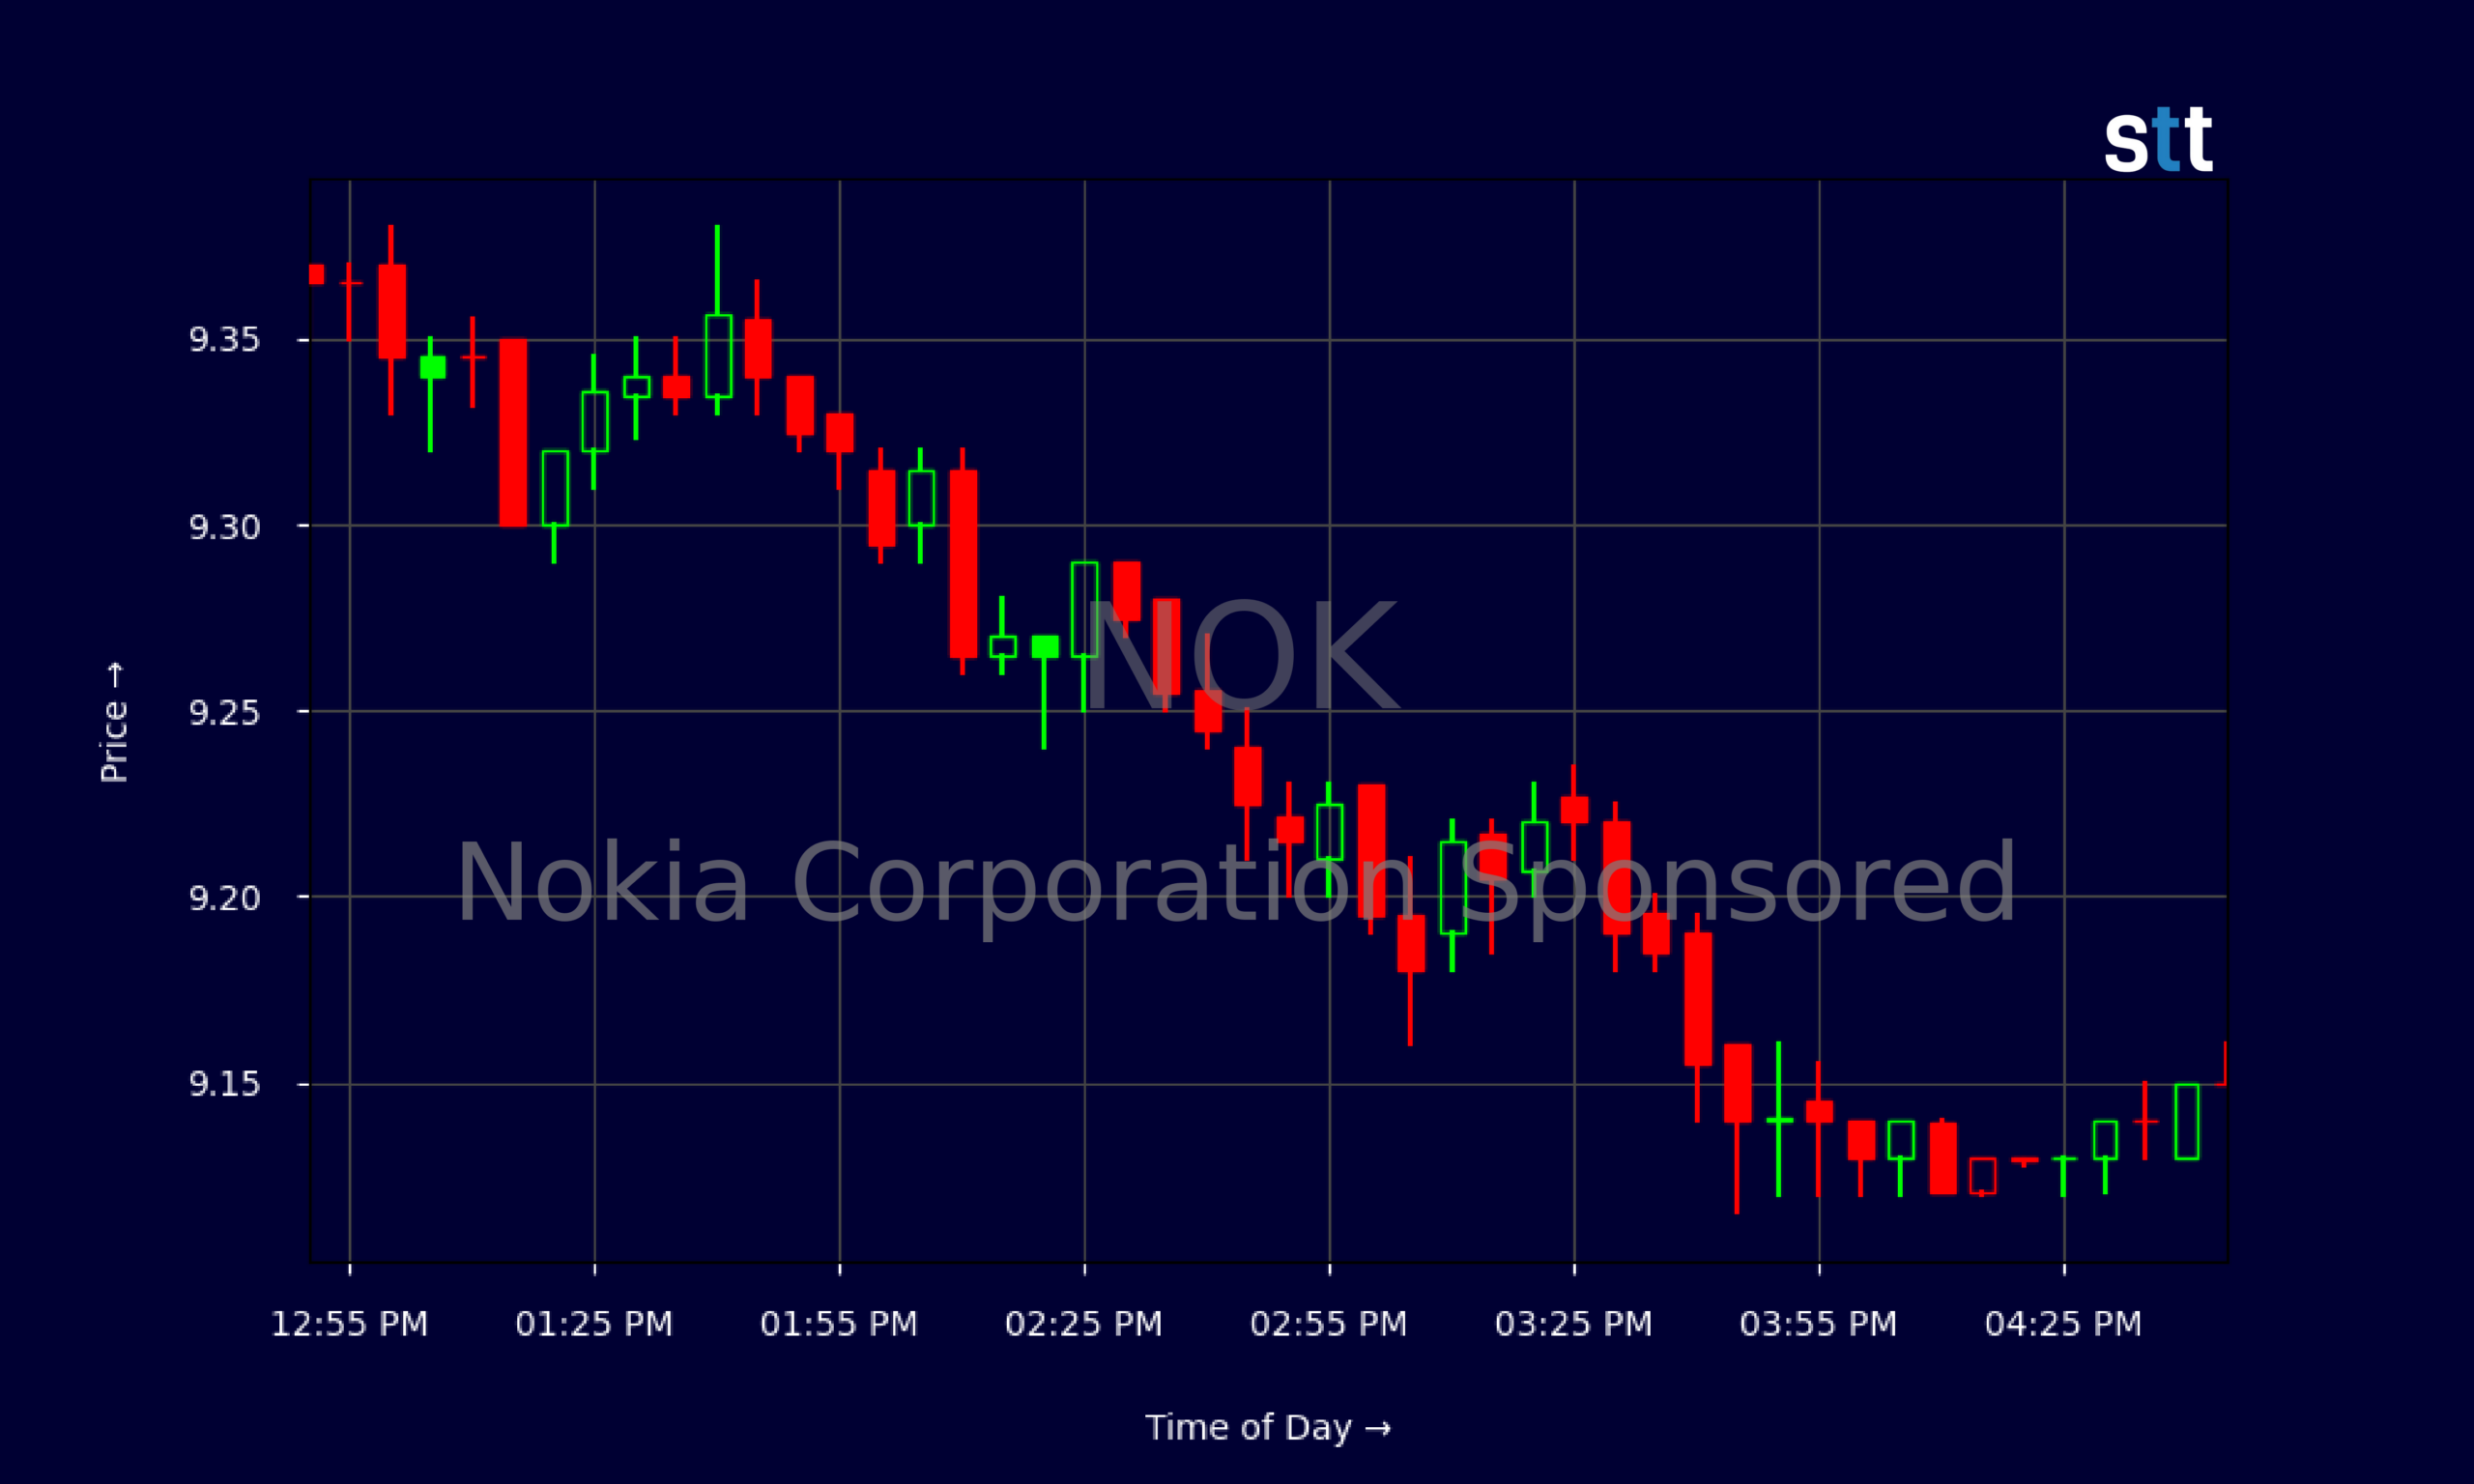
Live Update At 16:48:38 EDT: On Friday, October 16, 2026 Nokia Corporation Sponsored stock [NYSE: NOK] is trending down by -4.39%! Discover the key drivers behind this movement as well as our expert analysis in the detailed breakdown below.
Quick Financial Overview
NOK has been trading like a slow-moving downtrend, not a clean free fall but a steady grind lower. In late September, Nokia hovered around the low $10s, with closes near $10.60 on 2026/10/02 and $10.37 on 2026/10/01. Since then, the ADR has slipped under $10 and recently closed near $9.14 on 2026/10/16, a meaningful pullback for short‑term traders.
Intraday action tells the same story. NOK opened around $9.58 and spent most of the session sliding in a tight channel, ending very close to the low of the day. That kind of close shows sellers in control into the bell, with only brief, weak bounces on the 5‑minute chart.
More Breaking News
- KEEL Stock Slides As Weak Margins Weigh On Momentum
- RTX Stock Strengthens As Mega Defense Wins Pile Up
- SKYD Stock Slides As Skydance Faces Debt And Legal Shockwaves
- Tesla Stock Jumps As Q3 Deliveries And AI Story Heat Up
Fundamentally, Nokia posts about $19.22B in annual revenue and runs at a lean profit margin, with pretax margin around 6.8%. The market is paying a rich 74.4 P/E and about 2.6 times sales, which is a high tag for a name with modest returns on equity of 5.82%. For active traders, that mix — premium valuation, thin margins, and a weak chart — often means the market is quick to punish any sign of risk.
Why Traders Are Watching NOK’s Persistent Underperformance
Traders are glued to NOK right now because the stock is not just drifting with the European tide — it is consistently underperforming. On 2026/10/15, a subset of European ADRs sold off while the overall tone for European stocks in US trading stayed strong. Nokia was in that weak subset. When a stock can’t catch a bid on an up day, momentum traders take notice.
That pattern has been building for weeks. On 2026/10/12, telecom equipment providers Nokia and Ericsson were among the notable decliners, with Nokia off around 3%. Two days earlier, on 2026/10/08, Nokia’s ADR dropped about 3.2% while the broader European ADR index was down just 0.3%. That gap is huge. It says the pressure on NOK goes beyond macro headlines.
Late September showed the same theme. On 2026/09/28, Nokia’s ADR slid between roughly 1.1% and 2.4% along with Opera, SAP, and Materialise, all underperforming a slightly negative S&P Europe Select ADR Index. On 2026/09/24, Nokia again sat in the weak group as European and UK/Irish ADRs fell sharply while the main European ADR index was only marginally lower. And on 2026/09/22, Nokia and Ericsson led the downside in a broader decline across European telecom, tech, software, and banking ADRs.
For short‑term traders, this repeated role as a laggard positions NOK as a go‑to ticker when risk comes off in Europe — and a name to treat with caution on any bounce until the tape proves otherwise.
Conclusion
For Nokia, the message from the tape is simple: the market is voting with sell orders. NOK has broken down from the $10–$11 range into the $9s, and the daily chart shows lower highs and lower lows. The intraday pattern — weak opens, fades into the close, and no real surge of buying — confirms that sellers are still driving the action.
Under the surface, Nokia is not a broken company. It generates over $19B in revenue, has more than $5.4B in cash and cash equivalents on the balance sheet, and carries manageable long‑term debt of about $2.33B. But the returns are modest, and the P/E near 74.4 leaves little room for disappointment. When a stock like NOK trades at a premium while repeatedly underperforming its European ADR peers, active traders tend to focus more on price action than story.
Right now, that price action points to caution. NOK has been a consistent laggard in downswings and even on strong European sessions it often finds itself in the red. For day traders and swing traders who follow the Sykes‑style playbook — cut losses fast, trade the reaction, not the story — this is a name to stalk, not marry. That’s also where disciplined trade selection matters: as Tim Bohen, lead trainer with StocksToTrade says, “If you’re still guessing at the end of your analysis, it’s probably not a trade worth taking.” As Tim Sykes likes to say, “The market doesn’t care about what you think should happen, only about what actually happens — trade the chart in front of you, not the one in your head.”
This article is for educational and research purposes only and is not investment advice.
This is stock news, not investment advice. StocksToTrade News delivers real-time stock market updates tailored to highlight the key catalysts driving short-term price movements. Our coverage is designed for active traders and investors who thrive in fast-moving markets, with a focus on volatile sectors like penny stocks, AI stocks, Robinhood stocks and other momentum plays. From earnings reports and FDA approvals to mergers, new contracts, and unusual trading volume, we break down the events that can spark significant price action.
Looking to level up your trading game? Explore StocksToTrade, the ultimate platform for traders. With powerful tools designed for swing and day trading, integrated news scanning, and even social media monitoring, StocksToTrade keeps you one step ahead.
Check out our quick startup guide for new traders!
- How to Read Stock Charts: A Guide for Beginners
- Trading Plan: 6 Steps to Create One
- How To Create a Stock Watchlist
Ready to build your watchlists? Check out these curated lists:
Once your watchlist is set, take the next step and trade with confidence using StocksToTrade’s robust platform. Don’t miss out — grab your 14-day trial for just $7 and experience the edge you need to thrive in today’s fast-paced markets.