

CorMedix Inc. stocks have been trading down by -24.81 percent amid heightened concern over its latest clinical trial developments.
Market Insights For Active CRMD Traders
- Price has dropped from above $8 to the mid-$5s this week, putting CRMD back into a high-volatility zone.
- Intraday action shows a wide-range selloff, with heavy pressure from the open and a weak close near the session low.
- Strong gross margin and solid profitability metrics suggest CorMedix Inc. still has fundamental backing despite the pullback.
- Balance sheet liquidity and low debt levels give the company room to navigate near-term market swings.
- Traders are watching whether the recent breakdown turns into a deeper trend change or a shakeout before a bounce.
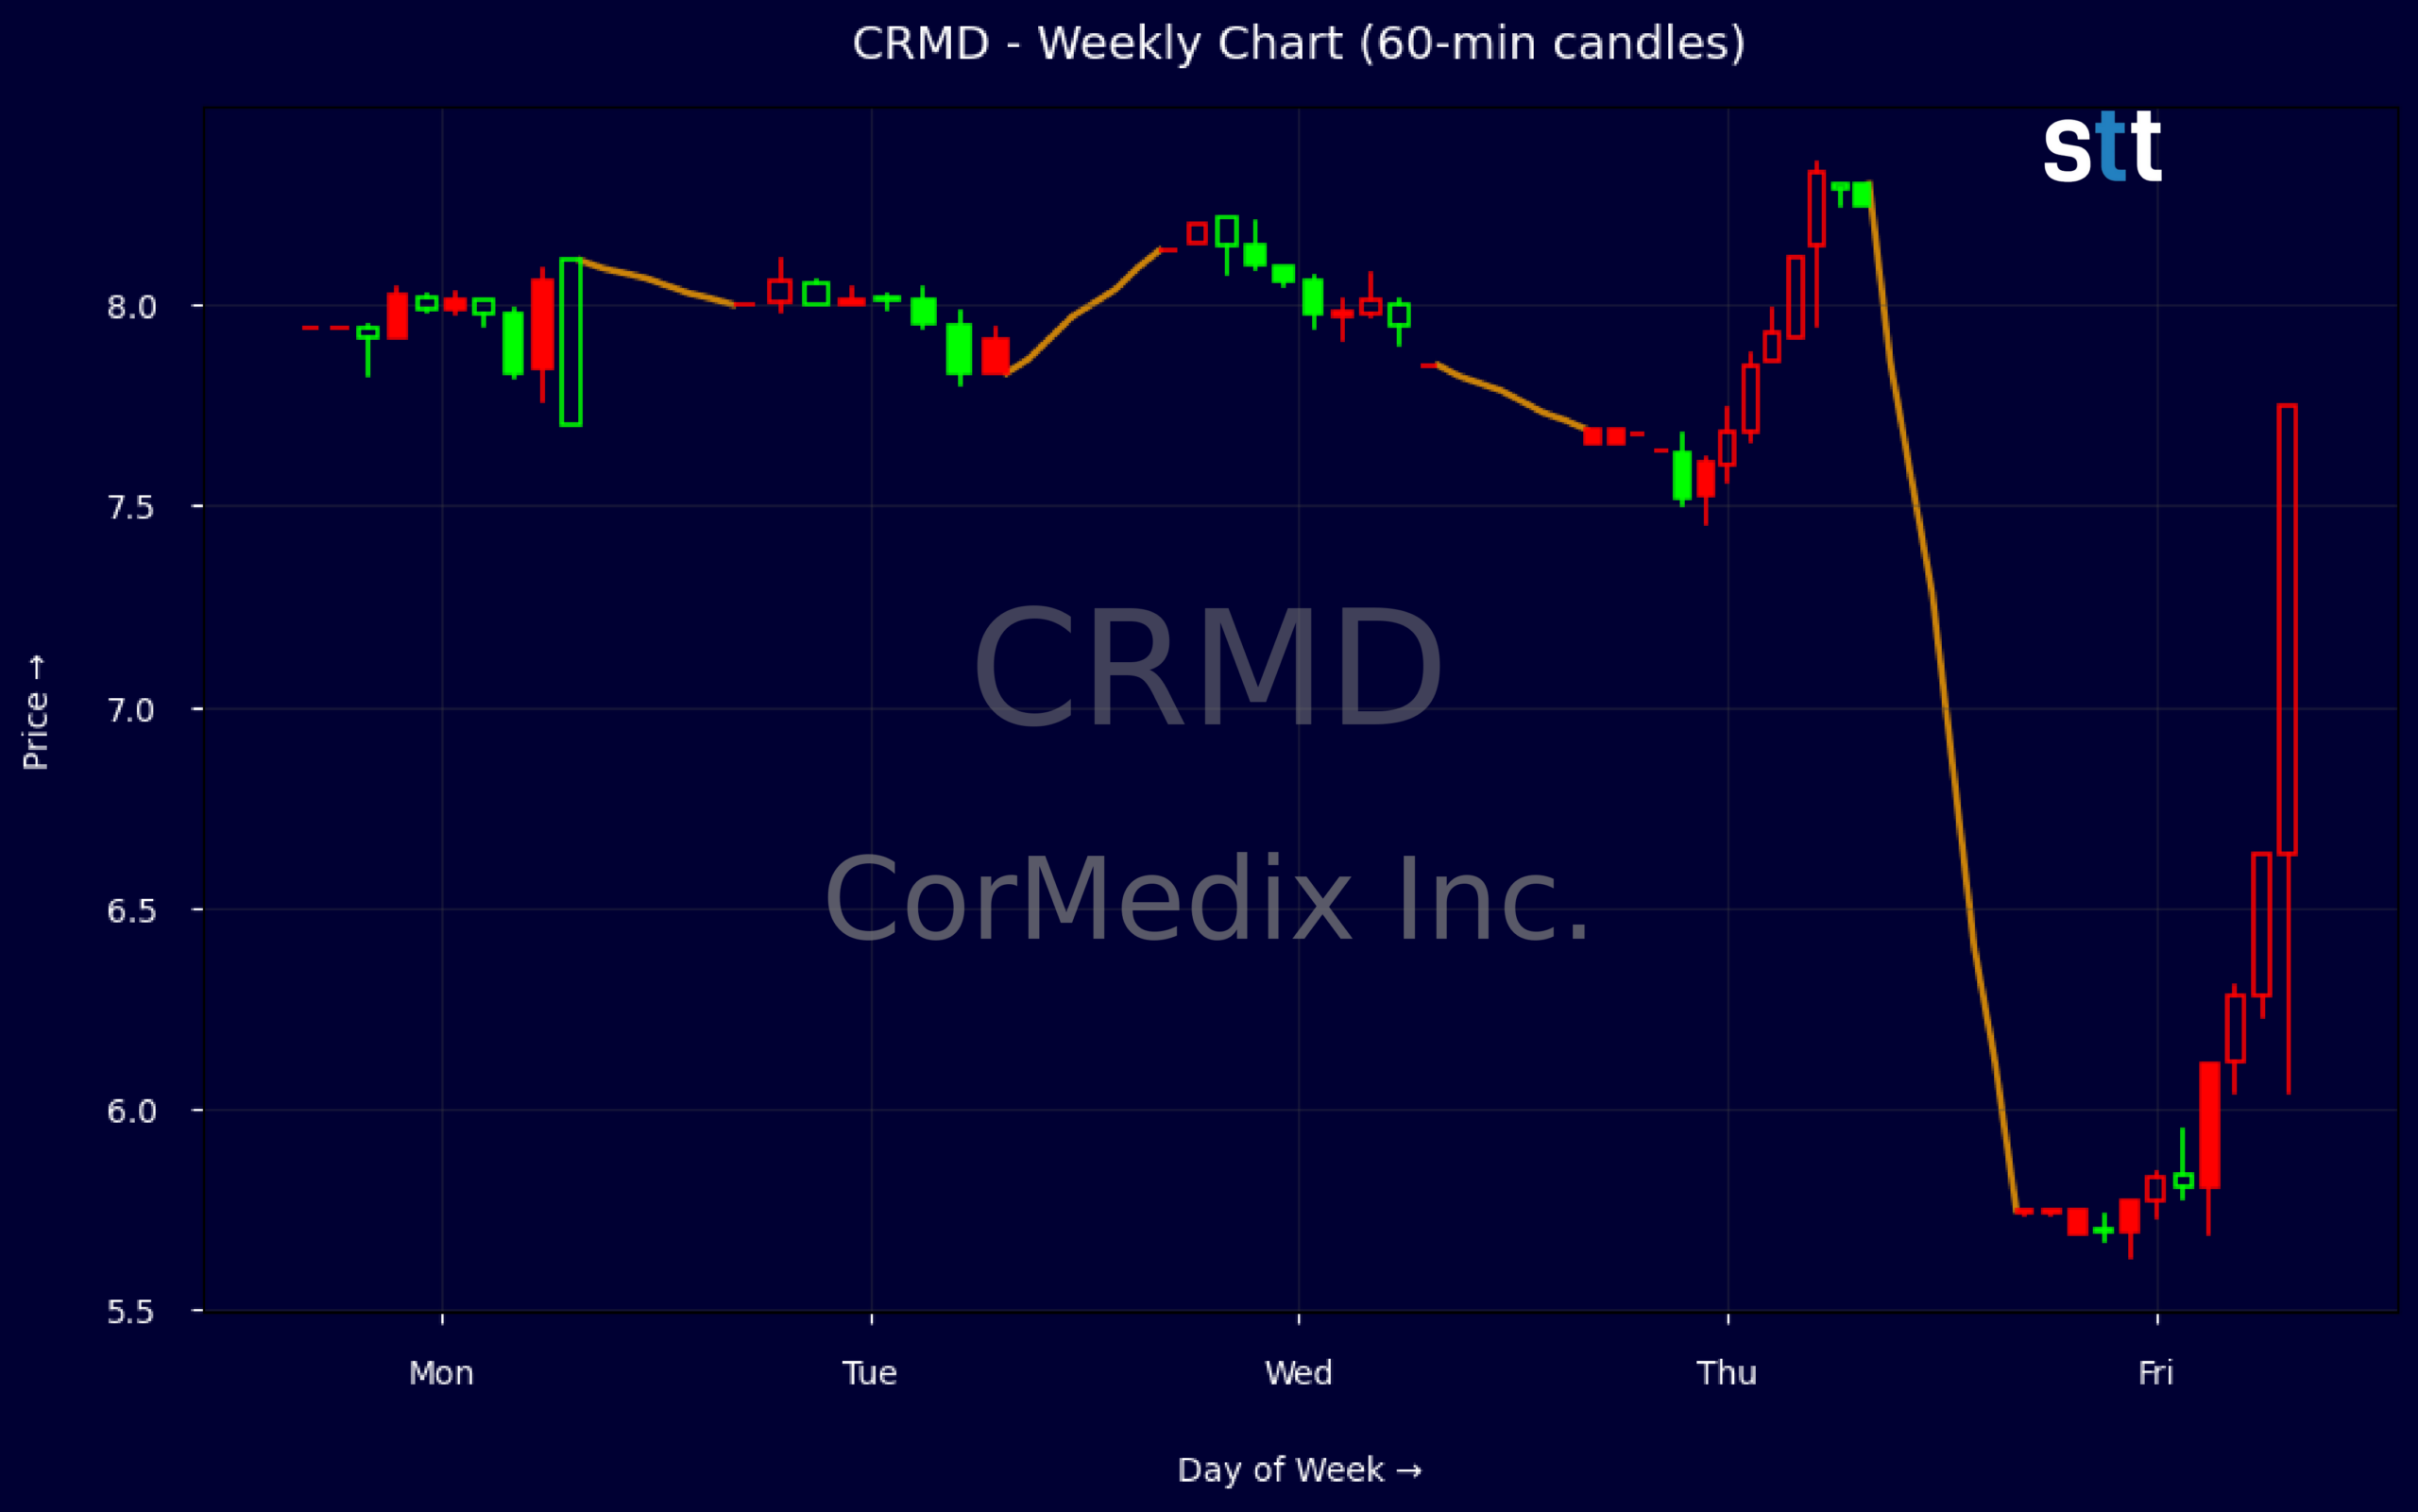
Weekly Update Oct 26 – Oct 30, 2026: On Sunday, November 01, 2026 CorMedix Inc. stock [NASDAQ: CRMD] is trending down by -24.81%! Discover the key drivers behind this movement as well as our expert analysis in the detailed breakdown below.
Healthcare industry expert:
Analyst sentiment – positive
CorMedix (CRMD) sits in an unusually strong fundamental position for a small-cap healthcare name: 82.7% gross margins, ~54% EBITDA margin, and ~47.5% EBIT margin point to a scalable, high-value product mix. Revenue growth is explosive (3-year +2,226%, 5-year +351%), yet the stock trades at just 3.4x trailing earnings and 1.24x sales, with EV/FCF near 1.7x. Balance sheet risk is low (D/E 0.31, current ratio 2.6), and cash of ~$257M plus FCF of ~$86M in Q2 2026 provide ample runway.
Technically, CRMD has broken from an 8+ area to 5.7 in only a few sessions, signaling an aggressive downside reversal and likely stop-driven liquidation. The sequence from 7.94–8.20–7.66–5.74 shows clear distribution at 8+ followed by a high-volume air pocket lower, confirming a dominant short-term downtrend. Intraday 5-minute candles show heavy selling into bounces. Traders should key on $6.20–6.30 as the first meaningful resistance; below, $5.50 is the next likely liquidity magnet and tactical support zone.
More Breaking News
- NCPL Plunges As SEC Fraud Charges Ignite Legal Firestorm
- TNMG Stock Pulls Back As Traders Eye Debt And Support
- AZN Jumps As AstraZeneca Delivers Big Oncology Wins
- Global Payments Stock Jumps As Analysts Hike Targets
Despite the lack of specific news flow, CRMD’s profitability, cash generation, and ROIC (~67% 1yr, >50% LTM) are superior to most Healthcare and Biotechnology & Life Sciences peers, which typically run losses or low single-digit margins at this size. The market is discounting execution and regulatory risk excessively. Base case: reversion toward 6.75–7.25 over 6–12 months as selling pressure normalizes, with strong support near $5.50 and major resistance at $8.00.
Quick Financial Overview
CRMD has seen fast pressure on the chart. Weekly data show price stalling near $8.20 before breaking down toward $5.70, a move that signals clear supply hitting the tape. That drop, from a recent high above $8 to the mid-$5s, is the kind of range expansion that often marks a shift in control from buyers to sellers. Intraday, the 5-minute candle shows a hard slide from about $7.68 to a close just under $5.70, with the low parked near the close, which usually reflects weak dip-buying demand.
Under the hood, CorMedix Inc. posts strong profitability for a smaller-cap name. Recent quarterly revenue sits around $99.3M, with gross profit near $74.5M and an EBIT margin above 40%, backed by an 82.7% gross margin. Net income from continuing operations is about $26M, and diluted EPS is $0.29 on roughly 92.5M diluted shares. Those numbers drive a low price-to-earnings ratio near 3.4 and a price-to-sales near 1.2, implying the stock trades at a discount versus its earnings power.
Liquidity and balance sheet strength matter for traders judging risk on a sharp selloff. CorMedix Inc. holds roughly $256.7M in cash and short-term investments, with current assets close to $480.6M against current liabilities of about $187.4M, giving a current ratio around 2.6. Total debt to equity is modest at 0.31, and interest coverage above 90 suggests little near-term balance-sheet stress. Return on equity in the mid-50% range and strong returns on capital highlight that management has recently been effective at turning capital into profit, which can support sentiment once the technical selling eases.
Conclusion
This is stock news, not investment advice. StocksToTrade News delivers real-time stock market updates tailored to highlight the key catalysts driving short-term price movements. Our coverage is designed for active traders and investors who thrive in fast-moving markets, with a focus on volatile sectors like penny stocks, AI stocks, Robinhood stocks and other momentum plays. From earnings reports and FDA approvals to mergers, new contracts, and unusual trading volume, we break down the events that can spark significant price action.
Looking to level up your trading game? Explore StocksToTrade, the ultimate platform for traders. With powerful tools designed for swing and day trading, integrated news scanning, and even social media monitoring, StocksToTrade keeps you one step ahead.
Check out our quick startup guide for new traders!
- How to Read Stock Charts: A Guide for Beginners
- Trading Plan: 6 Steps to Create One
- How To Create a Stock Watchlist
Ready to build your watchlists? Check out these curated lists:
Once your watchlist is set, take the next step and trade with confidence using StocksToTrade’s robust platform. Don’t miss out — grab your 14-day trial for just $7 and experience the edge you need to thrive in today’s fast-paced markets.