

Nexera Technologies Ltd stocks have been trading up by 8.63 percent amid strong optimism over its latest strategic growth initiatives.
Market Insights For Active Traders
- Nexera Technologies gained 47% in premarket trading, extending a 5% rise from the previous session.
- The move appears to be driven by momentum, with no specific fundamental news cited as the catalyst.
- Recent weekly candles show a spike from near $1.10 to above $2.00 before pulling back.
- Intraday action printed a wide range from roughly $1.33 to $3.27, signaling extreme volatility.
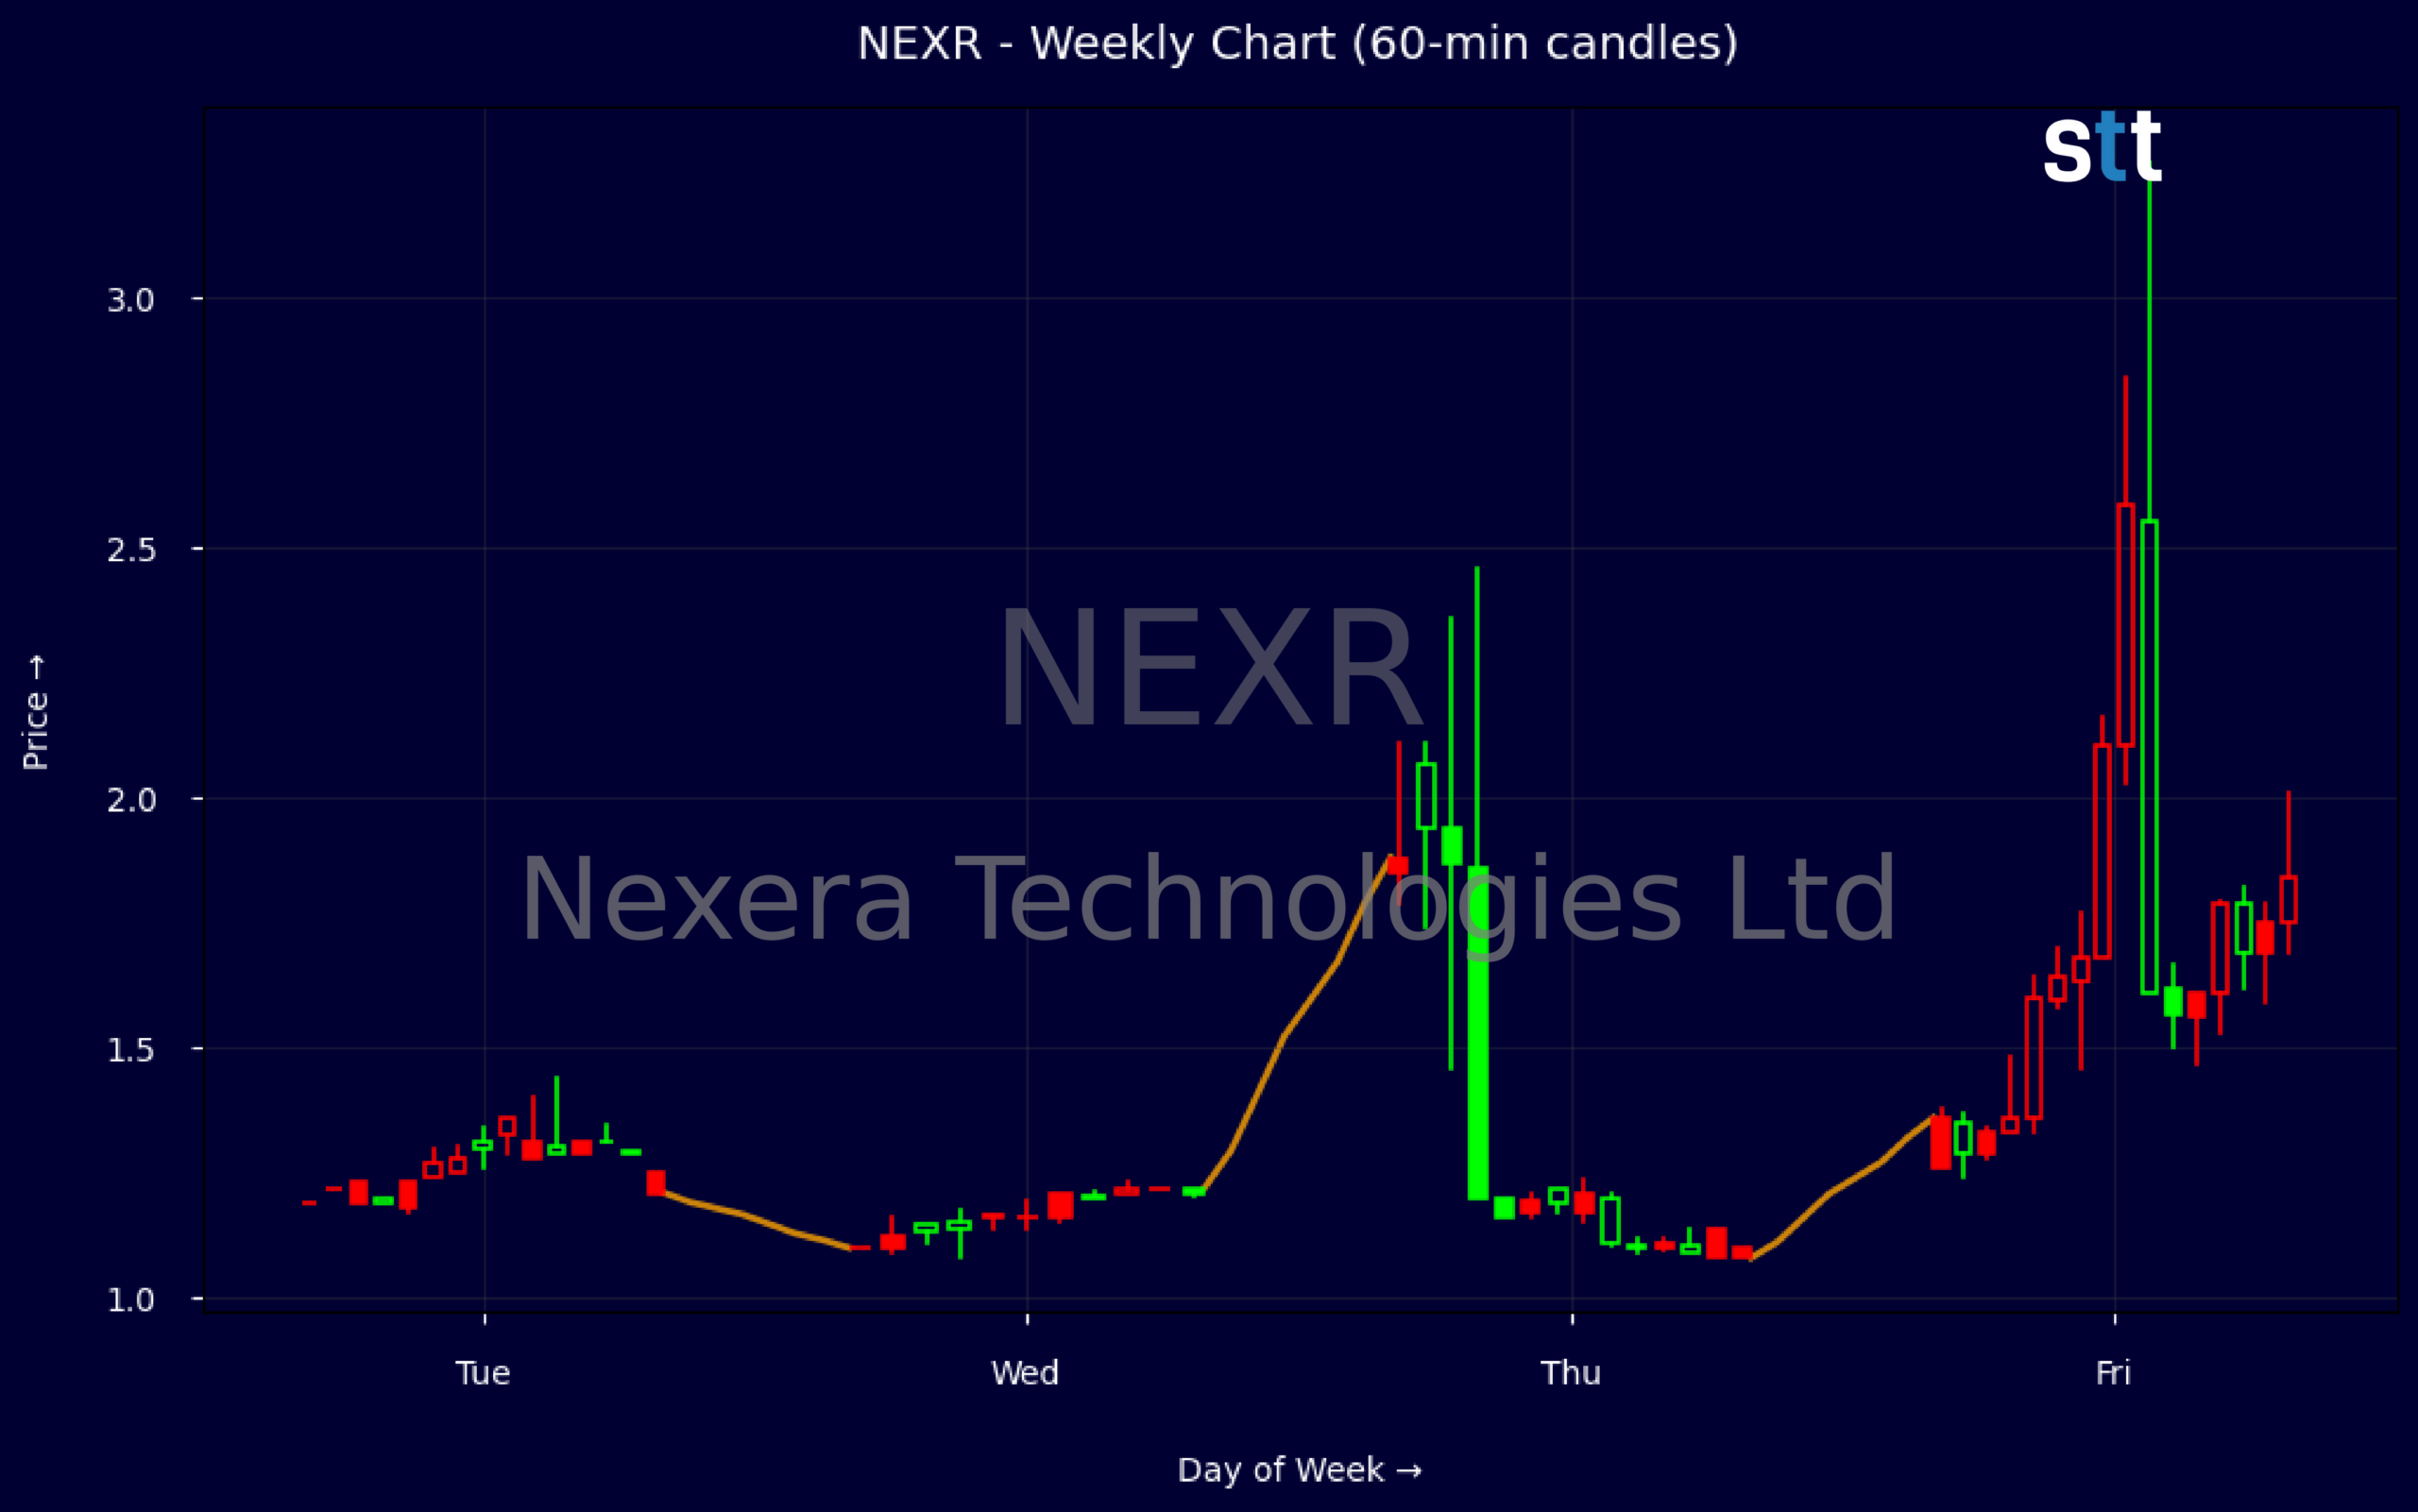
Weekly Update May 25 – May 29, 2026: On Sunday, May 31, 2026 Nexera Technologies Ltd stock [NASDAQ: NEXR] is trending up by 8.63%! Discover the key drivers behind this movement as well as our expert analysis in the detailed breakdown below.
Consumer Discretionary industry expert:
Analyst sentiment – negative
Nexera Technologies (NEXR) is a micro-cap, deeply distressed consumer discretionary name trading at roughly 0.2x book and 0.14x sales, signaling severe market skepticism about earnings power and asset quality. Revenues of ~$16.8m against negative ROIC of -32.6% and large accumulated deficit (-$19.8m retained earnings) indicate a structurally unprofitable model. Leverage is moderate (long-term debt and leases ~€4.0m vs equity €11.8m; leverage ratio 1.9), but cash of €1.7m and working capital of €3.4m offer only limited runway without a clear path to profitability.
Technically, NEXR is in a highly volatile, news-less momentum phase. Weekly data show a spike from 1.10 to an intrawweek high of 2.11 before closing at 1.95, followed by a sharp pullback to 1.26, confirming a failed breakout and establishing 2.10–2.15 as a critical resistance band. Five-minute candles around the surge showed expanding ranges with elevated volume, then declining volume on the pullback, signaling momentum exhaustion. For traders, 1.00–1.10 is the key downside level; a break below 1.00 likely triggers further forced selling.
More Breaking News
- CDE Stock Pullback Has Active Metals Traders On Watch
- BTG Stock Pulls Back As Charts Flash Key Support
- NCPL Plunges As SEC Fraud Charges Ignite Legal Firestorm
- AAL Stock Slides As Fuel Shock Slams 2026 Outlook
Recent price action is purely momentum-driven, with a 47% premarket spike on no incremental fundamental news, which contrasts sharply with the sector where Consumer Discretionary and Retail – Discretionary benchmarks move on earnings and macro data. NEXR’s risk/return profile is materially worse than peers given negative returns on capital and reliance on speculative flows. Base case: trading range near term with high event risk. Resistance: 2.10; support: 1.00. Verdict: avoid as an investment, strictly speculative trading only.
Quick Financial Overview
Nexera Technologies Ltd (NEXR) just delivered a textbook momentum burst, with a 47% premarket jump on top of a prior 5% push. Weekly price data shows the stock trading near $1.10 before ripping to above $2.00 and then fading back toward the mid-$1.20s. That kind of fast round-trip move is classic for a speculative momentum phase. Traders need to recognize this as a short-term sentiment run, not a confirmed trend yet.
On the intraday 5‑minute chart, NEXR printed a huge range, with prices swinging from the low $1.30s up toward $3.27 before closing much lower. This tells you liquidity is thin and orders can move the tape quickly in both directions. For day traders, that can be opportunity, but it also means small mistakes get punished fast. Tight risk control is not optional here.
Fundamentally, Nexera Technologies Ltd is small, with revenue near $16.8M and enterprise value around $5.8M, and it trades at a very low price-to-sales of about 0.14 and price-to-book near 0.20. The balance sheet shows total assets of roughly $22.2M and equity around $11.8M, but retained earnings are deeply negative at about -$19.8M, and return on capital near -32.6% signals that recent capital deployment has not created value. Financial strength looks mixed, with leverage around 1.9 and long-term debt plus capital lease obligations over $4.0M against modest cash of about $1.6M.
Conclusion
This is stock news, not investment advice. StocksToTrade News delivers real-time stock market updates tailored to highlight the key catalysts driving short-term price movements. Our coverage is designed for active traders and investors who thrive in fast-moving markets, with a focus on volatile sectors like penny stocks, AI stocks, Robinhood stocks and other momentum plays. From earnings reports and FDA approvals to mergers, new contracts, and unusual trading volume, we break down the events that can spark significant price action.
Looking to level up your trading game? Explore StocksToTrade, the ultimate platform for traders. With powerful tools designed for swing and day trading, integrated news scanning, and even social media monitoring, StocksToTrade keeps you one step ahead.
Check out our quick startup guide for new traders!
- How to Read Stock Charts: A Guide for Beginners
- Trading Plan: 6 Steps to Create One
- How To Create a Stock Watchlist
Ready to build your watchlists? Check out these curated lists:
Once your watchlist is set, take the next step and trade with confidence using StocksToTrade’s robust platform. Don’t miss out — grab your 14-day trial for just $7 and experience the edge you need to thrive in today’s fast-paced markets.